IMPLEMENTATION OF IMAGE ANALYSIS FROM THIN LAYER CHROMATOGRAM OF PURPLE SWEET POTATO LEAF EXTRACT IN CHEMICAL FINGERPRINTING
on

Journal Pharmaceutical Science and Application Volume 5, Issue 2, Page 59-65, December 2023 E-ISSN: 2301-7708
IMPLEMENTATION OF IMAGE ANALYSIS FROM THIN LAYER
CHROMATOGRAM OF PURPLE SWEET POTATO LEAF EXTRACT IN
CHEMICAL FINGERPRINTING
Ni Putu Dinda Mirayanti1, Putu Sanna Yustiantara1*, I Made Agus Gelgel Wirasuta1 1Department of Pharmacy, Faculty of Math and Science, Udayana University, Bali-Indonesia
Corresponding author email: putuyustiantara@unud.ac.id
ABSTRACT
Background: Purple sweet potato (Ipomoea batatas L.) is a crop that contains rich amounts of anthocyanins and flavonoids. For maintaining its quality in preparations, fingerprint analysis using Thin Layer Chromatography (TLC) is commonly used. Objective: In this study, image analysis was implemented on the chromatogram to develop fingerprint profiles of the leaves of various types of purple sweet potatoes. Methods: Fingerprint analysis and acquisition of data were carried out by combining modern TLC equipment with software for image analysis. The in-situ fingerprint analysis using WinCats was compared with the image analysis results obtained in this study. The chemometric technique, cluster analysis, was performed to measure their difference in terms of sample classification. Cluster analysis was carried out to confirm that the clusters formed from image analysis were the same as those from WinCats. Results: The results obtained were two dendrograms, both showing the formation of two clusters, but with a different order of samples. This study concluded that the data obtained from image analysis using ImageJ software resulted in clustering with a similarity of 38.15%, while the data obtained from WinCats software resulted in classification with a similarity of 28.31%. Both methods had issues in determining the fingerprint profiles, as evidenced by the low level of similarity. Conclusion: These results indicate that image analysis has the potential to be implemented for fingerprint profile development. However, further analysis is needed to align the Rf values and confirm the compounds in the peaks.
Keywords: Average linkage; Cluster analysis; Dendrogram; Purple sweet potato; Thin layer chromatography
INTRODUCTION
Purple sweet potato (Ipomoea batatas (L.) Lam.) is one of the crop commodities that is widely cultivated in Indonesia. In addition to being used as a food ingredient, the leaves of purple sweet potato may have pharmacological potential. The leaves of sweet potatoes are known to contain beneficial compounds such as minerals, vitamin E, beta-carotene, lutein, and
polyphenols[1]. Several studies have reported that sweet potato leaves are a very good source of antioxidant polyphenolic compounds, including anthocyanins such as peonidin and cyanidin derivatives, and phenolic acids such as caffeic and chlorogenic acid[2]. Purple sweet potato leaves have a high anthocyanin content, but the amount depends on the type of sweet potato leaf. It is also known that purple sweet
potato leaves of different types have different colors, which may be an indication of different anthocyanins that are implicated in a different fingerprint profile.
The chemical compounds found in a plant can be identified by performing a fingerprint profile identification. Identification and analysis of fingerprint patterns from purple sweet potato leaf extracts have been conducted in the study by Yustiantara et al.[3] to identify key compounds that correlate with pharmacological activity. The phytochemical fingerprint of a compound is indicated by a chromatogram profile in the form of spots, densitograms, or spectra. However, this method is time-consuming when used for routine applications such as controlling the quality of a large number of samples simultaneously. TLC is a simple, fast, and inexpensive chromatography method that can be used to analyze up to 20 samples simultaneously[4]. TLC provides a large amount of information in the form of variables and features from a large number of samples, thus requiring efficient statistical procedures to extract such information. The TLC method has been widely explored in the development of plant fingerprint profiles, as all chromatograms are treated as multidimensional vectors without specific peak identification[5].
The application of chemometric analysis for sample classification in TLC obtained from WinCats software is generally based on the differences in peaks recorded manually[6]. The drawback of this method is that it requires a long time to evaluate each peak. As an alternative, Ristivojević et al.[7] reported the results of their study on an alternative method for creating fingerprints on TLC using image analysis that utilizes ImageJ software. This method can reduce the time required for identifying data from each peak and thus can be applied for routine analyses. ImageJ software has various built-in
algorithms that are proven to be quite good for processing TLC chromatogram images[6].
This study was conducted to implement the TLC image analysis method. The result will be compared with the in-situ TLC protocol using the WinCats software, which is a built-in software of the instrument (CAMAG). To compare these two image analysis methods, the fingerprint chromatogram data of purple sweet potato leaf samples obtained from both WinCats and ImageJ software were further analyzed using multivariate analysis. To obtain insight into the chemometrics between these fingerprints, Hierarchical Cluster Analysis (HCA) was used to measure similarity levels and cluster classification. The implementation of the TLC image analysis method is expected to be useful for quality control analysis of the extract compound profiles of purple sweet potato leaves on a production scale in the industrial environment in the future.
METHODS
The instruments used were glassware (Iwaki-Pyrex®), analytical balance (Kern-Alj®), bulb filler, ADC chamber (CAMAG), GF254 silica gel TLC plate, ATS (CAMAG), TLC Visualizer (CAMAG), UV lamp (CAMAG), and TLC Scanner 4 spectrodensitometer (CAMAG). The software used for chromatogram data analysis was ImageJ and Minitab 20.3.
The plant material used in this study was purple sweet potato (Ipomoea batatas L.) leaves of Sawentar, Antin-3, Beta-2, Sari, Papua-Salosa types obtained from the Balai Penelitian Tanaman Aneka Kacang dan Umbi, Malang, East Java; Aan type purple sweet potato leaves obtained from Aan Village, Klungkung, Bali, Indonesia; and Pering type purple sweet potato leaves obtained from Pering Village, Gianyar, Bali, Indonesia.
The chemicals used in this study were ethyl acetate (Merck®), formic acid (Merck®), acetic acid (Merck®), water, ethanol (Merck®), citric acid (Merck®), and methanol (Merck®).
The C-18 TLC plate was prepared by washing it with methanol and activating it at a temperature of 70oC for 10 minutes. Using the CAMAG 4 autosampler, a sample volume of 20 µL was spotted twice on the plate. The samples were organized into rows based on their sweet potato type: rows 1 and 2 for Sawentar type, rows 3 and 4 for Antin type, rows 5 and 6 for Beta 2 type, rows 7 and 8 for Sari type, rows 9 and 10 for Papua type, rows 11 and 12 for Pering type, and rows 13 and 14 for Aan type. The plate was then eluted in a chamber saturated with a mobile phase composed of 10% formic acid (in water) and acetonitrile (85:15 v/v).
The eluted and dried TLC plate was observed under white light, UV 254, and UV 366 using the CAMAG TLC Visualizer and scanned using the CAMAG TLC Scanner 4 spectrophotodensitometer at a wavelength of 210 nm, and all peaks that were detected were measured again in the range of wavelengths 200-700 nm. At this stage, chromatogram data from the scanning results of the TLC was obtained and digital data from the WinCats software.
Data analysis was started by identifying each peak based on the level of similarity in its spectrum. The digital data obtained from
WinCats were in the form of information about hRf and peak height at the start, max, and end positions. Peaks that were not aligned were aligned or shifted to the same hRf value based on spectrum correlation, and the peak height values were arranged as a rectangular data matrix. Meanwhile, the TLC plate images from the previous study were processed using ImageJ software. In the first step, the documented plate results were cropped to leave only the eluted spots (Selection/Image/Crop), and the image type was changed to 8-bit (Image/Type/8-bit). Noise reduction was carried out through the median filter function (Process/Filter/Median) with a two-pixel wide filter without further background subtraction. Next, the image was rotated (Image/Transform/Rotate 90 Degrees Right), and each track was marked with the rectangle menu. Line profile plots were made with the plot profile option (Analyze/Plot profile) for each sample. The plot profile displays a twodimensional graph of pixel intensity along the line. The x-axis represents the distance along the line, and the y-axis represents the pixel intensity of the image.
The digital data obtained from WinCats and the data obtained from the processing using ImageJ software were then analyzed using multivariate methods to determine the proximity of the samples using two different methods. The multivariate analysis performed was cluster analysis using the hierarchical method, which will be depicted in a dendrogram form using Minitab 20.3 software.
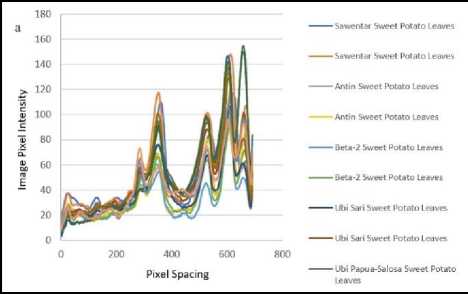
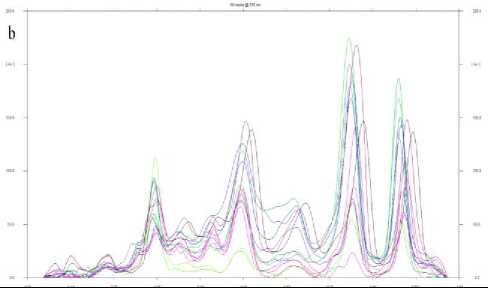
Figure 1. Chromatogram peak pattern (a) from image analysis (ImageJ) (b) WinCats
2 Dendrogram β Dendrogram
Average Linkage. Euclidean Distance Average Linkage, Euclidean Distance
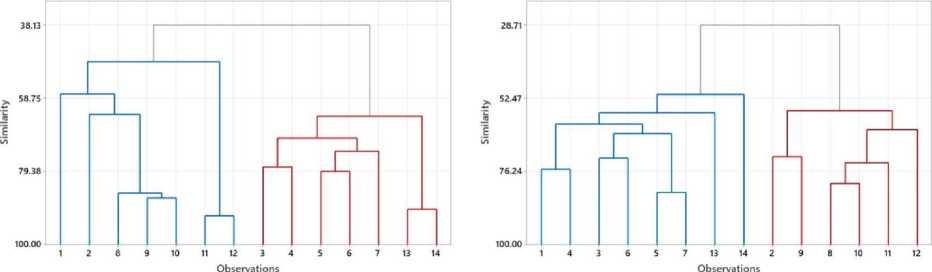
Figure 2. Dendrogram (a) data from image analysis using Software ImageJ (b) data from WinCats software
RESULTS
In this study, chromatogram peak patterns were obtained from both image analysis and WinCats software data analysis. Based on the images, it can be seen that both data sets have a high similarity in terms of chromatogram peak patterns (Figure 1).
Cluster analysis was conducted to confirm that the clusters formed from image analysis are the same as those from WinCats analysis. Based on the generated dendrogram image, it can be seen that both data sets exhibit the same clustering patterns, albeit with different levels of similarity. The data generated by the WinCats software provided a similarity level of 28.31%, while the data from image analysis using ImageJ provided a
similarity level of 28.15% in the clustering analysis (Figure 2).
DISCUSSION
Image analysis is a process that involves improving the quality of an image and extracting pixel data from the analyzed image. This analysis technique utilizes differences in pixel data between certain areas and the background of the image, allowing for the detection of specific point areas on the TLC plate[8]. This forms the basis for the objective of this research, which is to present a multivariate image analysis method in the classification of purple sweet potato leaf samples using the chemometric cluster analysis technique combined with TLC, making it applicable for quality control
purposes in the production of purple sweet potato leaf extract compound profiles.
Validation of the analysis method of purple sweet potato leaf extract using thin layer chromatography has been conducted in previous research by Yustiantara et al.[3]. In that study, flavonoid derivative compounds, namely anthocyanin and its acylated form, were identified. Yustiantara et al.[3] also performed fingerprinting identification using the TLC method, resulting in a plate that was further analyzed in this study.
This study used samples obtained from Aan Village, Klungkung, Bali, Balai Penelitian Tanaman Aneka Kacang dan Umbi, Malang, East Java, and Pering Village, Gianyar, Bali with different types to determine the similarity of peak patterns from different sample types. The types of purple sweet potato leaf samples used in this study, respectively, are Sawentar sweet potato leaf (1 and 2), Antin sweet potato leaf (3 and 4), Beta-2 sweet potato leaf (5 and 6), Sari sweet potato leaf (7 and 8), Papua-salosa sweet potato leaf (9 and 10), Pering sweet potato leaf (11 and 12), and Aan sweet potato leaf (13 and 14) (Figure 3).
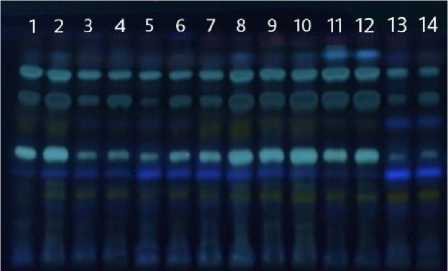
Figure 3. TLC plate chromatogram of purple sweet potato leaf extract samples in fluorescence mode at a wavelength of 366 nm (Yustiantara et al., 2021) (1 & 2 -Sawentar sweet potato leaf, 3 & 4 - Antin sweet potato leaf, 5 & 6 - Beta-2 sweet potato leaf, 7 & 8 - Sari sweet potato leaf, 9 & 10 - Papua sweet potato leaf, 11 & 12 -Pering sweet potato leaf, 13 & 14 - Aan sweet potato leaf)
The chromatogram of purple sweet potato leaf extract was processed using the Hierarchical Cluster Analysis (HCA) method. In this hierarchical method, clusters are naturally formed and represented in the form of a dendrogram, which is a visual representation of the steps in cluster analysis that show how a cluster can be formed. In this study, cluster analysis was performed using the agglomerative method, namely average linkage. Average linkage considers the average distance between members in two groups, which can be divided into two types, namely inter-group linkage and intra-group linkage. Average linkage is the most commonly used method and highly recommended because it is suitable for grouping and recommended for processing a large number of samples as well as complex variables and indicators[9].
Based on the cluster analysis results depicted in the dendrogram from the data obtained from the analysis of TLC plate images using both ImageJ software and WinCats software, it is evident that there are two clusters formed. Both dendrograms show the same clustering pattern (Figure 2). In dendrogram (a), it can be observed that the Sawentar, Papua, and Pering types of sweet potato leaves are in the same cluster, indicated by the blue line. On the other hand, the Antin, Beta 2, and Aan types are in the same cluster, represented by the red line. Similarly, in dendrogram (b), the clustering pattern formed is mostly the same as in dendrogram (a), but is represented by different colored lines. This result provides a preliminary indication that image analysis can be implemented in creating a fingerprint profile of a particular compound.
Based on the degree of similarity determined by the dendrogram, the data processed using image analysis software has a similarity of 38.13%, while the data obtained from WinCats software has a similarity of 28.71%. WinCats software has a
feature for processing data called peak assignment. This process is carried out by evaluating the identity and similarity of peaks based on their respective spectra. To be compared in a multivariate manner, the number of assigned peaks must be the same in each track. This procedure can be used further in the identification of compounds and peaks. However, for quality control analysis that requires routine analysis, the image analysis method for peak patterns using ImageJ software can minimize the time required for chromatogram data processing. Therefore, this study demonstrates the application of image processing to chromatograms without identifying or performing peak assignments. This research can be applied for routine quality control analysis purposes in large-scale production of purple sweet potato leaf extract compounds in the industry, with further analysis of Rf values alignment and confirmation of compounds in peaks to provide more optimal results.
CONCLUSION
The development of an efficient TLC method for fingerprint analysis requires a chemometric approach that begins with the application of experimental design, separation, data acquisition, and classification or clustering problems. In this study, TLC was combined with multivariate image analysis for fingerprint analysis and clustering of purple sweet potato leaf samples of various types. The chemometric technique used was Hierarchical Cluster Analysis (HCA). The results obtained were in the form of two dendrograms, in which both dendrograms showed the formation of two clusters. The clustering patterns of the data obtained from WinCats and the image analysis using ImageJ appeared to be the same, and this could be observed from the level of their similarity. Although both results were relatively low, they indicated that the
image analysis method could be implemented in the creation of a compound fingerprint profile, with further analysis of Rf values alignment and confirmation of compounds in peaks to provide more optimal results. The image analysis method of chromatogram could also be used in the future as quality control for the profile of purple sweet potato leaf extract in large-scale production because of its more efficient use.
CONFLICT OF INTEREST
The author would like to express gratitude to the supervising lecturer and staff in the pharmacy department of Udayana University who have provided guidance in the completion of this research article.
ACKNOWLEDGEMENT
There are no conflicts of interest in this research. This research article was written independently. All authors have no financial or personal relationships with other individuals or organizations that could inappropriately influence this research.
REFERENCES
-
1. Maretta OO, Sukardi S, Winarsih S.
Efek Penggunaan Tepung Daun Ubi Jalar Ungu Dan Tepung Daun Ubi Jalar Kuning Terhadap Karakteristik Fisikokimia, Organoleptik Dan Aktivitas Antioksidan Pada Cookies. Food Technology and Halal Science Journal. 2021;4(2):192–207.
-
2. Islam S. Medicinal and Nutritional Qualities of Sweetpotato Tops and Leaves. 2014.
-
3. Yustiantara PS, Warditiani NK, Armita Sari PMN, Anita Dewi NLKA, Ramona Y, Jawi IM, et al.
Determination of TLC fingerprint
biomarker of Ipomoea batatas (L.) Lam leaves extracted with ethanol and its potential as antihyperglycemic agent. Pharmacia. 2021;68(4):907–17.
-
4. Kartini K, Wulandari WA, Jayani NIE, Setiawan F. TLC-based fingerprinting for Phyllanthus niruri from diverse geographical origins in East and Central Java Indonesia. IOP Conf Ser Earth Environ Sci. 2021;948(1):1–8.
-
5. Shawky E, El Sohafy SM. Untargeted and targeted chemical profiling for efficacy-directed discrimination of Hedera helix L. subspecies using HPTLC- image analysis and HPTLC/MS. Ind Crops Prod [Internet]. 2020;145:1–9.
-
6. Milojković-Opsenica D, Ristivojević P, Andrić F, Trifković J. Planar chromatographic systems in pattern recognition and fingerprint analysis. Chromatographia. 2013;76(19–
20):1239–47.
-
7. Ristivojević P, Andrić FL, Trifković JD, Vovk I, Stanisavljević LZ, Tešić ŽL, et al. Pattern recognition methods and multivariate image analysis in HPTLC fingerprinting of propolis extracts. J Chemom. 2014;28(4):301– 10.
-
8. Sowers ME, Ambrose R, Bethea E, Harmon C, Jenkins D. Quantitative thin layer chromatography for the determination of medroxyprogesterone acetate using a smartphone and opensource image analysis. J Chromatogr A [Internet]. 2022;1669:1–11.
-
9. Xu N, Finkelman RB, Dai S, Xu C, Peng M. Average Linkage Hierarchical Clustering Algorithm for Determining the Relationships between Elements in Coal. ACS Omega. 2021;6(9):6206– 17.
65
Discussion and feedback