Ensemble Model of Precipitation Change Over Indonesia Caused by El Nino Modoki
on
JMRT, Volume 4 No 1 Tahun 2021, Halaman: 72-76
JOURNAL OF MARINE RESEARCH AND TECHNOLOGY
journal homepage: https://ojs.unud.ac.id/index.php/JMRT
ISSN: 2621-0096 (electronic); 2621-0088 (print)
Ida Bagus Mandhara Brasikaa *
aProgram Studi Ilmu Kelautan, Fakultas Kelautan dan Perikanan, Universitas Udayana, Bali, Indonesia
* Corresponding author email: mandharabrasika@unud.ac.id
ARTICLE INFO
ABSTRACT
Article history:
Received: January 27th 2021
Received in revised form: February 16th 2021
Accepted: February 26th 2021
Available online: February 28th 2021
Keywords:
El Nino Modoki
Ensemble Model Precipitation Change Square Error Skill Score
The aim of this research is to understand the impact of El Nino Modoki into Indonesian precipitation and how ensemble models can simulate this changing. Ensemble model has been recognized as a method to improve the quality of model and/or prediction of climate phenomenon. Every model has their own algorithm which causes strength and weakness in many aspects. Ensemble will improve the quality of simulation while reducing the weakness. However, the combination of models for ensembles is differ for each event and/or location. Here we utilize the Squared Error Skill Score (SESS) method to examine each model quality and to compare the ensemble model with the single model. El Nino Modoki is a unique phenomenon. It remains debatable amongst scientists, many features of this phenomenon are unfold. So, it is important to find out how El Nino Modoki has changed precipitation over Indonesia. To verify the changing precipitation, the composite of precipitation on El Nino Modoki Year is divided with the composite of all years. Last, validating ensemble model with Satellite-gauge precipitation dataset. El Nino Modoki decreases precipitation in most of Indonesian regions. This mainly occur in the east Indonesia, the highest precipitation change is located in Maluku islands. The ensemble, while statistically promising, has failed to simulate precipitation in some region. There are region with low spatial correlation, such as Sumatra, Kalimantan, Maluku and Papua, is also the area where model uncapable to simulate. Moreover, this include the significantly-decreased precipitation area like Maluku.
2021 JMRT. All rights reserved.
El Nino is known as climate disturbance which is indicated by the changing of sea surface temperature over the east Pacific Ocean. This is mainly caused by trade wind on equatorial pacific (Anderson, Perez & Karspeck, 2013). In the normal condition, trade wind is blowing from east (subtropical region) to west (around equator). However, every 2-7 years the trade wind will change its direction (Trenberth & Shea, 1987). This causes a distinct pattern of warm pool on east Pacific Ocean and cold pool on the west. The condition is recognized as El Nino. The opposite pattern of the warm pool and cold pool is also known as La Nina. Together, they are usually called as El Nino Southern Oscillation (ENSO) (Philander, 1983). The climate phenomenon that has been linked in many climate events around the world (Cai, et al., 2015), include some massive disasters. ENSO also has influenced rainfall over Indonesia (Rauniyar & Walsh, 2013; Wang & Hendon, 2007; As-Syakur, et al., 2014).
In 2004, the Sea Surface Temperature (SST) over east Pacific Oceans appeared with different patterns compared to El Nino or La Nina(Ashok, et al., 2007). There is a warm pool, flanked with two cold pools in the west and east of it, then known as El Nino Modoki (Ashok, et al., 2007). It also has a decadal temporal pattern (Weng, et al., 2007). To measure this disturbance, Japan
Agency of Marine Science and Technology (JAMSTEC) revealed an index called El Nino Modoki Index (EMI) by calculating SST anomaly on specific areas. By this method, it is known that El Nino Modoki has appeared several times before it is named as El Nino Modoki. These are 1986, 1990, 1991, 1992, 1994, 2002, 2004, 2009 and 2010. The pattern of global SST has also shown different from ENSO. Despite some differences, ENSO and El Nino Modoki have significant impact for environmental and societal condition (Gutman, Csiszar, & Romanov, 2000; Glantz, 2001; Juneng & Tangang, 2005; Liao, Ma, & Zhan, 2012; Xu, Zhu, & He, 2013; Salimun, Tangang, Juneng, Behera, & Yu, 2014).
The position of warm pool during El Nino Modoki impact the increasing of atmospheric and oceanic condition that affect tropical cyclone on the north-west (120o-190oBT, 0o-30oLU) of Pacific Ocean (Pramuwardani, 2012). El Nino Modoki also decrease the precipitation in some area over Indonesia such as Sumbawa Besar, Makassar and Banjar Baru on June-August (Windari, Faqih, & Hermawan, 2012).
This unique pattern and impact of El Nino Modoki conduct a big question mark. How this phenomenon will vary in time and space of precipitation. How good a model can capture these variations. As a limited-known phenomenon, ensemble models
can be a based information to understand the modelling of El Nino Modoki. This method can show which model has a capacity to capture the impact of El Nino Modoki. Then, it can be initial information to build a model or improve current model. This research will give us an better understanding about El Nino Modoki and the potential to model it. So, we can mitigate potential hazard that might occur caused by El Nino Modoki.
In this research, the ensemble is created based on model capacity on simulating El Nino Modoki Index. El Nino Modoki Index is an index to detect El Nino Modoki by calculating SST anomaly in 3 zones of Pacific Ocean (Ashok, et al., 2007). This shown in the equation (1) :
EMI= [SSTA]A-0.5*[SSTA]B-0.5*[SSTA]………………….(1)
Where:
SSTA = Sea Surface Temperature Anomaly
A= 165o BT-140o BB ; 10o LS-10o LU
B= 110o BB-70o BB ; 15o LS-5o LU
C= 125o BT-145o BT ; 10o LS-20o LU
Figure 1 illustrate area A, B and C to calculate the value of El Nino Modoki Index. This based on research by Ashok, et al.
(2007)
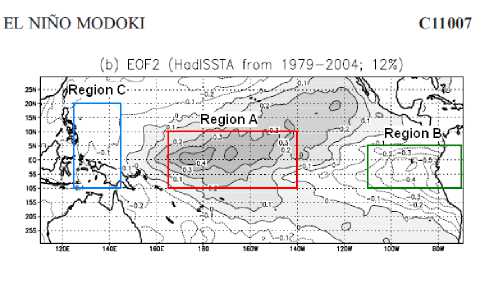
Figure 1. EOF2 mode of SST anomaly during SST El Nino Modoki 1979-2004.
MSEclim = (oi)2
(5)
Where:
= forecast value on month i
= observation value on month i n = number of SESS
SESS/MSESS will have score of 1 if the forecast and observation are the same value (perfect forecast). SESS/MSESS will be 0 or lower to show that the forecast/model has no ability on predicting the phenomenon.
This skill score method evaluates the capability of several single models. There are 7 single models from the Climate-system Historical Forecast Project (CHFP). Database CHFP provides valuable and free access data, especially to measure the skill of models worldwide and how seasonal prediction can be applied (Stockdale, et al., 2010).
The 7 single model from CHFP is our basic to create ensemble. They are POAMA-P24A, POAMA-P24B, POAMA-P24C, CCCma-CanCM3, CCCma-CanCM4, ECMWF and MIROC5. The single model with constant high score on the El Nino Modoki season (boreal summer and boreal winter) will be chosen as a member of our ensemble model scenario.
After that SESS is utilized to evaluate the model, comparing several scenarios of multimodel ensemble. The most constant high score of the ensemble model will be chosen to simulate the precipitation change caused by El Nino Modoki. Pearson correlation is added to this research to show the spatial connection between El Nino Modoki Index and Precipitation in Indonesia. The spatial correlation is calculated between monthly EMI and monthly Indonesian precipitation during 1984-2009. This is shown in equation (6) :
To determine the quality of the model, each model is tested using Mean Squared Error Skill Score (MSESS). This is a deterministic method to measure the connection between forecast/model and observation. MSESS is a simple skill score which does not need adjustment of error from average value (Tippett, Barnston, & Li, 2011). To get the MSESS, first calculate the Squared Error Skill Score (SESS), then composite the value of SESS.
r _ ∑(χj-χ×yi-y)
√∑(χi-χ)2∑(yi-y)2"
……………………………..(6)
MSESS and SESS are formulated in equation (2) and (3):
SESS1+SESS2+....+SESSn n
……………………(2)
MSE
MSEcItm
(3)
(4)
Where:
r = Pearson Correlation coffecient
xi = value of EMI model every month
yi = value of EMI JEMSTEC every month
X = mean of the values of the EMI model
y = mean of the values of the EMI JAMSTEC
To see the changing precipitation, we composite the precipitation in the all year compare with composite precipitation in the El Nino Modoki year only, which is 1986, 1990, 1991, 1992, 1994, 2002 and 2004. The percentage of precipitation change is calculated in equation (7):
Percentage of Precipitation Change = M°^“”Mlli x 100%......(7)
Where:
Com.Modoki = Composite of precipitation in El Nino
Modoki year (1986, 1990, 1991, 1992, 1994, 2002 and 2004)
Com.Total = Composite of precipitation in all year
during 1981-2009
As validation, the same method to see precipitation change is applied in observational data. Here, the satelit-gauge combination dataset from Global Precipitation Climatology Project (GPCP) V3.1 (Huffman, et al., 2020) is chosen as a comparison.
-
A. Skill Score of Single Model and Ensemble Model
Each single model, POAMA-P24A, POAMA-P24B, POAMA-P24C, CCCma-CanCM3, CCCma-CanCM4, ECMWF and MIROC5, is evaluated on this section. All of them provide a simulation of SST on east pacific. These single model SST are formulated to get the EMI. Then, they are plotted with EMI from Jamstec in timeseries to see the pattern of each single model. The Figure 2 show monthly the time-series from 1984-2009 of calculated EMI from all single model.
(a)Time Series El Nino Modoki Index
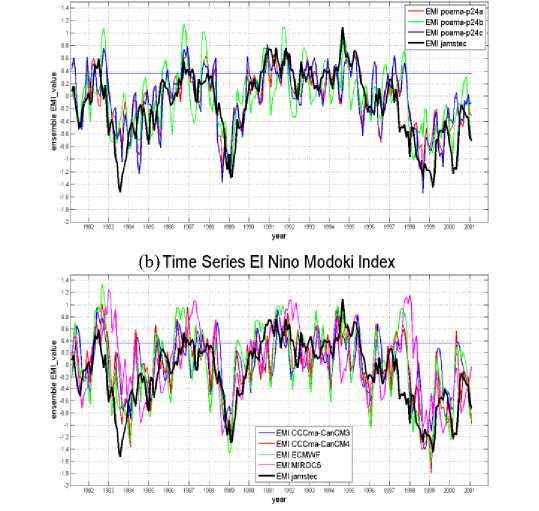
Figure 2. Time series of monthly EMI during 1981-2001 (a) ensemble mean member model POAMA-P24A, POAMA-P24B, POAMA-P24C (b) ensemble mean member model CCCma-CanCM3, CCCma-CanCM4, ECMWF, MIROC5. The black line is EMI from JAMSTEC as reference. The straight blue line is threshold of El Nino Modoki event (0.364) based on JAMSTEC.
in several years/months make an over-forecast and/or underforecast in simulating EMI. By generating the time-series, the skill of each single model can not be obtained clearly.
Thus, introducing MSESS in this model is able to quantify the skill of the model, so it can be compared. We define a high performance model is the model with 0.6 or higher score in 3 months, it can determine members for our ensemble model scenario. The 0.6 is chosen as it is more than half of the SESS maximum score. Boreal summer is the main period of El Nino Modoki, this occurs between June-September. From Figure. 3, there are 4 of 7 single models that have high performance during boreal summer. They are MIROC5, CCCma-CanCM4, POAMA-P24C and ECMWF.
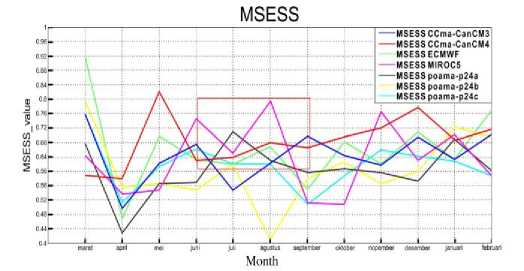
Figure 3 Time series of monthly MSESS from each single model. Red box is boreal summer (June-September), while blue box is boreal winter (Desember-January). High performance model is defined as MSESS 0.6 or higher.
These 4 single models are chosen as a model to build ensemble model scenarios. However, to make a comparison, we also build two other ensembles. Second ensemble is based on models with high performance in boreal winter. These are CCCma-CanCM3, CCCma-CanCM4 and ECMWF. Third ensemble includes all the 7 single models.
-
B. Ensemble Model
To check the skill of the ensemble model, the same criteria is applied. It should be higher than 0.6 of MSESS at least 3 months in boreal summer. Here in Figure 4, all ensembles are capable of passing the criteria. All ensemble skill scores are over 0.6 (or at least same as 0.6) for all months in boreal summer. Interestingly, the lowest score is shown by the ensemble of all single models. Its score decreased in August, almost 0.6, while other ensemble models increased. This is because single model members in ensembles all eliminate each other. The decrease in August is mainly affected by POAMA-p24b model which has the lowest score in August. In 3 scenarios of Ensemble Model, only ensembles all that include POAMA-p24b as members.
In general, all single models illustrate the same pattern with the validation, EMI from JAMSTEC. The straight blue line is the threshold for EMI. If EMI is higher than the blue line, El Nino Modoki occurs. However, as shown on Figure 2, some models
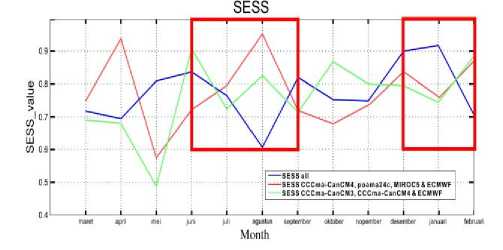
Figure 4. Time series monthly SESS from 3 scheme of multimodel. Red boxes are boreal summer and boreal winter. SESS 0.6 is the threshold of high performance multimodel.
Our scenario ensemble model boreal summer (red line) has a consistent high score in every month of El Nino Modoki (boreal summer and boreal winter season). It always gets a score higher than 0.7. Moreover, it reaches the highest skill score, more than 0.9 over all scenarios. Then, this scenario is evaluated by Pearson correlation (Storch & Zwiers, 1999) to see the spatial connection of EMI and precipitation from GPCP over Indonesia. It can be seen in the figure 5.
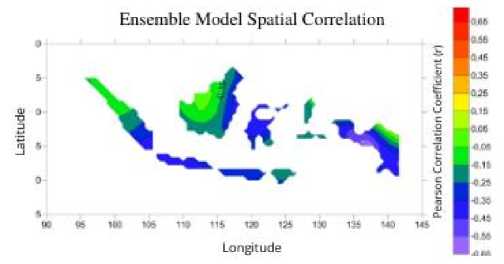
Figure 5. Pearson Correlation of EMI and Indonesian
precipitation durung 1984-2009.
In general, most of Indonesian areas have a negative correlation with EMI. This means precipitation is decreasing if EMI is stronger. The highest correlation is in Papua Island, it reaches -0.65. This strong relation might occur as Papua close to Pacific Ocean and get direct impact. Some areas have very low correlation between 0 to – 0.25. They are North part of Sumatra, West Part of Borneo and Maluku Islands. This low correlation might be occur because this region is highly affected by many factor such as ITCZ (Intertropical Convergence Zone), SPCZ (South Pacific Convergence Zone) and Topography (Waliser & Gautier, 1993; Love, Matthews, & Lister, 2011; Mori, et al., 2004) While other regions have moderate correlation(-0.35 to -0.65), Sulawesi, Jawa, Bali and Nusa Tenggara. Previous research (Tristania, 2013) explained the correlation of El Nino Modoki and Indonesian Precipitation is stronger between June-August and September-November. It can reduce 20-40% of its rainfall. This correlation is confirmed in the recent study (As-Syakur, et al., 2016), partial analysis correlation showed that El Nino Modoki influence rainfall variability, strongly in September-November months.
-
C. Precipitation Change
This map (Figure 6) is a composite ensemble model precipitation of Indonesia in El Nino Modoki year. That is 1986, 1990, 1991, 1992, 1994, 2002 and 2004. Then, calculating precipitation change in the period of 1984-2009. In general, many regions have lower precipitation during the El Nino Modoki year. Jawa, Bali, Nusa Tenggara, Sulawesi and the southern part of Papua have 8-16% lower precipitation. Other area is 8% lower. However, some have shown positive changes, higher rain in El Nino Modoki year. They are central Borneo, west part of Sumatra and north part of Papua.
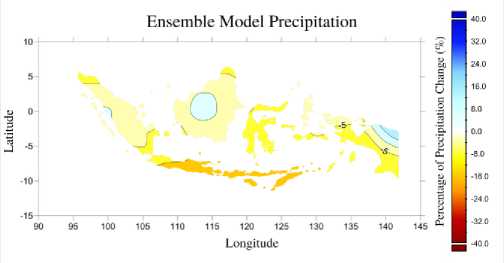
Figure 6. Precipitation Change of El Nino Modoki Ensemble model 1986, 1990, 1991, 1992, 1994, 2001, 2002, 2004 (%).
The information from figure 6 is not sufficient to explain the capability of our ensemble model to simulate the precipitation change over Indonesia. It needs to be compared with observation data. Here, our verification is a satellite-gauge dataset from Global Precipitation Climate Project (GPCP). It is shown in Figure 7.
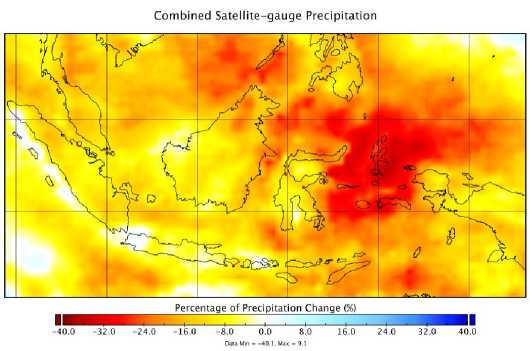
Figure 7. Precipitation Change of El Nino Modoki Satelite-gauge 1986, 1990, 1991, 1992, 1994, 2001, 2002, 2004 (%).
Figure 7 is the precipitation change over Indonesia by satellitegauge GPCP. Almost all regions are decreasing. Most parts have decreased between 8-16 %. Except for the Maluku Island region, this area has decreased from 24 to 32%. Compared with the ensemble model result, the model has failed to simulate the precipitation change in some regions such as Maluku, Kalimantan and the north part of Sumatra. Models show zero change and slight increase in these regions, while GPCP show decrease. Related to figure 5, the region where ensemble models fail to simulate is also the area with very low correlation.
The other region such as Jawa, Bali, Nusa Tenggara, Sulawesi and the west part of Papua, the ensemble is capable of illustrating the precipitation decrease in the same range of magnitude between 8-16 %.
5. Conclusionn
Ensemble models and observation show decreasing precipitation in many regions of Indonesia as impact of El Nino Modoki. Unfortunately, the ensemble model has failed to illustrate the changing precipitation in areas with low correlation, such as the north part of Sumatra, central of Borneo and north part of Papua. The worst part is over Maluku islands. The model shows a slight decrease, while it should be a massive reduction of precipitation.
In general, during the period 1981-2009, El Nino Modoki has decreased precipitation in most parts of Indonesia. This is based on a composite of precipitation in the El Nino Modoki year (1986, 1990, 1991, 1992, 1992, 1994, 2002, 2004). The decrease is between 0 to minus 24% of precipitation. The most impacted part is Maluku Islands. Unfortunately, this region also has one of the lowest correlation. So, the model failed to predict the precipitation change in this area.
There are some potential improvement that might be developed for next research. First, adding stochastic calculation to improve the ensemble scenario. As this research only use deterministic method. Second, try to forecast the phenomenon. It can use another product of CHFP, such as CMIP5 or CMIP6 (Coupled Model Intercomparison Project).
References
Pramuwardani, I. (2012). Kajian El Nino Modoki Terhadap Kejadian Siklon Tropis di Samudera Pasifik Barat Laut . Fakultas Matematika dan Ilmu Pengetahuan Alam. Depok: Universitas Indonesia.
Tippett, M., Barnston, A., & Li, S. (2011). Performance of Recent Multimodel ENSO Forecast. Journal of Applied Meteorology and Climatology(51), 637-654.
Weng, H., Ashok, K., Behera, S., Suryachandra, A., Rao, S., & Yamagata, T. (2007). Impacts of recent El Nino Modoki on dry/wet conditions in the Pacific rim during boreal summer. Journal of Geophysical Research, C11, 112.
Windari, E. H., Faqih, A., & Hermawan, E. (2012). El Nino Modoki dan Pengaruhnya Terhadap Perilaku Curah Hujan Monsunal di Indonesia. Jurnal Meteorologi dan Geofisika, 13(3), 130.
Ashok, K., Behera, S. K., Rao, S. A., Weng, H., & Yamagata, T. (2007). El Nino Modoki and its possible teleconnection. Journal of Geophysical Research, 112(C11).
Stockdale, T., Alves, O., Boer, G., Deque, M., Ding, Y., Kumar, A., . . . Yun, W. (2010). Understanding and Predicting Seasonal-to-Interannual Climate Variability - The Producer Perspective. Procedia Environmental Sciences, 1, 55-80.
Storch, H. v., & Zwiers, F. W. (1999). Statistical Analysis in Climate Research. Cambridge, United Kingdom: Cambridge University Press.
Weng, H., Ashok, K., Behera, S., Suryachandra, A., Rao, S. A., & Yamagata, T. (2007). Impacts of recent El Nino Modoki on dry/wet condition in the Pacific rim during boreal summer. Journal of Geophysical Research, C11, 112.
Tristania, S. (2013). Pengaruh El Nino Modoki Terhadap Curah Hujan di Indonesia. Bandung: Institut Teknologi Bandung.
As-Syakur, A., Osawa, T., Miura, F., Nuarsa, I. W., Ekayanti, N. W., Dharma, I. G., . . . Tanaka, T. (2016). Maritime Continent rainfall variability during TRMM era: The role of monsoon, topography and El Nino Modoki. Dynamics of Atmosphere and Oceans, 75, 58-77.
Cai, W., Santoso, A., Wang, G., Yeh, S., An, S.-I., Cobb, K., . . . Wu, L. (2015). ENSO and greenhouse warming. Nature Climate Change, 5(9), 849-859.
Rauniyar, S., & Walsh, K. (2013). Influence of ENSO on the Diurnal Cycle of Rainfall over the Maritime Continent and Australia. Journal of Climate, 26(4), 1304-1321.
Wang, G., & Hendon, H. (2007). Sensitivity of Australian rainfall to inter-El Nino variations. Journal of Climate, 20(16), 4211-4226.
As-Syakur, A., Adnyana, I., Mahendra, M., Arthana, I., Merit, I., Kasa, I., . . . Sunarta, I. (2014). Observation of spatial patterns on the rainfall response to ENSO and IOD over Indonesia using TRMM Multistelite Precipitation Analysis (TMPA). International Journal of Climatology, 34(15), 3825-3839.
Gutman, G., Csiszar, I., & Romanov, P. (2000). Using NOAA/AVHRR products to monitor El Nino impacts: Focus on Indonesia in 1997-98. Bulletin of the American Meteorological Society, 81(6), 1189-1205.
Glantz, M. (2001). Currents of change: impacts of El Nino and La Nina on climate and society. Cambridge: Cambridge University Press.
Juneng, L., & Tangang, F. (2005). Evolution of ENSO-related rainfall anomalies in Southeast Asia region and its relationship with atmosphere-ocean variations in Indo-Pacific sector. Climate Dynamics, 25(4), 337-350.
Liao, X., Ma, J., & Zhan, H. (2012). Effect of different types of El Nino on primary productivity in the South China Sea. Aquatic Ecosystem Health and Management, 15(2), 135-143.
Xu, K., Zhu, C., & He, J. (2013). Two types of El Nino-related Southern Oscillation and their different impacts on global land precipitation. Advances in Atmospheric Sciences, 30, 17431757.
Salimun, E., Tangang, F., Juneng, L., Behera, S., & Yu, W. (2014). Differential impacts of conventional El Nino versus El Nino Modoki on Malaysian rainfall anomaly during winter monsoon. International Journal of Climatology, 34(8), 2763-2774.
Huffman, G., Behrangi, A., Bolvin, D., & Nelkin, E. (2020, Oktober). GPCP Version 3.1 Satelite-Gauge (SG) Combined Precipitation Data Set. Greenbelt, Maryland, USA.
Waliser, D., & Gautier, C. (1993). A satelite-deryed climatology og the ITCZ. Journal of Climate, 2162-2174.
Love, B., Matthews, A., & Lister, G. (2011). The diurnal cycle of precipitation over the Maritime Continent in a high-resolution atmospheric model. Quaterly Journal of the Royal Meteorological Society, 934-947.
Mori, S., Hamada, J.-I., Tauhid, Y., Yamanaka, M., Okamoto, N., Murata, F., . . . Sribimawati, T. (2004). Diurnal land-sea rainfall peak migration over Sumatera Island, Indonesian maritime continent, observed by TRMM satelite and intensive rawinsonde soundings. Monthly weather review, 2021-2039.
Anderson, B. T., Perez, R. C., & Karspeck, A. (2013). Triggering of El Nino onset thorugh trade wind-induced charging of the equatorial Pacific. Geophysical Research Letter, 1212-1216.
Trenberth, K. E., & Shea, D. J. (1987). On the evolution of the Southern Oscillation. Monthly Weather Review, 3078-3096.
Philander, S. (1983). El Nino Southern Oscillation phenomena. Nature, 295301.
76
Discussion and feedback