New Brand Ride-Hailing Apps Continuance Intention of Gen Z: the Role of Personal Innovativeness in Information Technology
on
Agung Maulana, New Brand Ride-Hailing Apps’ Continuance … 15

P-ISSN: 1978-2853
E-ISSN: 2302-8890
MATRIK: JURNAL MANAJEMEN, STRATEGI BISNIS DAN KEWIRAUSAHAAN
Homepage: https://ojs.unud.ac.id/index.php/jmbk/index
Vol. 17 No.1, Februari (2023), 15-33
New Brand Ride-Hailing Apps Continuance Intention of Gen Z: the Role of Personal Innovativeness in Information Technology
Agung Maulana1), Arny Lattu2), Bagja Rahma Putra3),
1,2,3 Universitas Nusa Putra
Email: agung.maulana@nusaputra.ac.id

SINTA 2
DOI : https://doi.org/10.24843/MATRIK:JMBK.2023.v17.i01.p02
ABSTRACT
The tight competition in the ride-hailing service industry has made Super App digital companies in Indonesia vie to attract public interest to become their regular customers. As new players, Super App Maxim and/or InDriver companies need insight into what factors can make their applications accepted by Generation Z as the largest consumers in Indonesia. So, this study aims to investigate the role of performance and expectations of effort and social influence on continuing intentions to use new online transportation applications through the mediating role of personal innovation in information technology (PIIT). This study used the SEM technique with the SMART PLS 3.3.0 application, with 553 respondents using Maxim and/or InDriver. The study results show that performance, effort expectations, and social influence significantly affect the intention to use online transportation applications. Expected effort is the most significant factor affecting PIIT and intention to continue, followed by social influence and performance expectations.
Keywords: Continuance Intentions; Generation Z; Personal Innovativeness In Information Technology; RideHailing Apps, UTAUT
INTRODUCTION
The ride-hailing industry in Indonesia began with the establishment of a shuttle service call center by GO-JEK in 2010 (Salim et al., 2021). In 2014, an American company, Uber, introduced a mobile-based ride-hailing service in Indonesia. GO-JEK followed this step by establishing a mobile application that supports its benefits in Jakarta in 2015 (Almunawar et al., 2021). Ride-hailing services continue to be a fast-growing business in Indonesia in line with the growth of the young population and the growing number of smartphone users (Fauzi, 2018).
Based on data from research by Google, TEMASEK, & Bain & Company in 2019, it is estimated that Indonesia's internet economy will reach around $40 billion in 2019, where Indonesia has four leading sectors that have a significant impact on the growth of the internet economy. One is ride-hailing, which is at a percentage of 57% after e-commerce.
Indonesia Internet economy (GMV. $B)
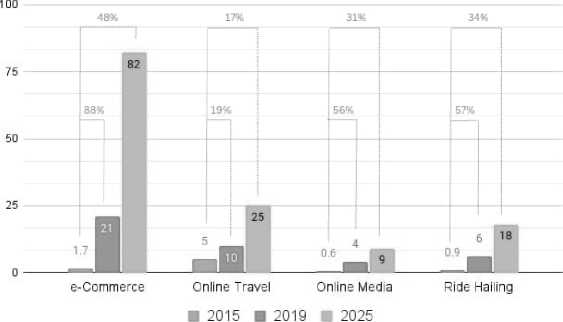
Figure 1. Indonesia Internet Economy
Source: Kumala (2019)
In the first phase of this industry (see table 1), more than 15 ride-hailing service providers competed for market share in big cities in Indonesia. Unfortunately, until 2022, only five to six ride-hailing service providers operate their businesses in many cities in Indonesia, one of which is Maxim and InDriver. The intense competition in the ride-hailing industry in Indonesia was increasingly felt with the closure of the ride-hailing giant start-up Uber business activity in Indonesia in 2018. There are complex reasons behind the closure of Uber's business activities and other ride-hailing service providers in Indonesia. It is common knowledge that people in Indonesia have more than one ride-hailing application for daily use. It is due to the perfectly competitive market (winner takes all) of the ride-hailing industry, which creates very rational consumer behavior. Defeating the two significant dominances of Gojek and Grab is very difficult, given their extraordinary power to provide travel subsidies through promotions to customers as a strategy to take advantage of market rationality. The challengers to these two big start-ups must be able to design the right plan to be accepted by ride-hailing users in Indonesia (Alananto & Wahyudi, 2021).
Table 1. List of Ride-Hailing Applications in Indonesia (Continue)
|
Category |
Early Phase 2010-2018 |
2019-2020 |
Ride-Hailing Application (2022) |
New Competitors (2021-2022 |
|
Market Leader |
Uber, Grab, Gojek |
Grab, Gojek |
Grab, Gojek | |
|
Market Followers |
BajajApp, Transjek, Wheel Line, Bangjek, Ojek Syar’I, Bluejek, Call Jack, Ojekkoe, Topjek, OjekArgo, Taxi Motor, Ladyjek, Smartjek, Ojek Kampung, Pro-Jek |
BajajApp, Transjek, Wheel Line, Ojek Syar’I, Ojek Kampung, Pro-Jek |
BajajApp, Transjek, Wheel Line, Ojek Syar’I, Ojek Kampung, Projek |
Go Bitcar, Maxim, Anterin, Bonceng, Asia Trans, FastGo, Via, InDriver, Air Asia |
Source: Fauzi & Sheng (2021)
Previous studies have been investigating continuance intentions in many technological apps and products. One of the essential factors is personal innovativeness in information
technology. Fauzi & Sheng (2021) observed the link between personal innovativeness, perceived value, and continuance intentions in ride-hailing applications and the disparities in customer behavior between metro and non-metro consumers. Sair & Danish (2018) scrutinized relationships between performance expectancy, effort expectancy, personal innovativeness, and behavioral intentions in the Pakistani consumer market. They also observed how personal innovativeness mediates the relationship between performance, effort expectancy, and behavioral intentions. In addition, Lu (2014) presented findings from research that looked at the impact of personal innovativeness in information technology (PIIT) and social influence on user retention intentions for mobile commerce (m-commerce) in the United States.
To our best knowledge, the research talks about the specific market object in terms of generation, especially the Z generation in ride-hailing app continuance intentions are still very rare. Z generation is known for its open nature, daring to try new things, and being very rational about choices. They are very open to change. Z generation also has the largest market share in the ride-hailing industry. They have a great sense of innovativeness and are close to the revolution of technology usage (Petro, 2020). Attracting the attention and interest of the Z generation to try to use and grow their awareness to continue using the application is very important for the continued expansion of the ride-hailing application business.
Based on Gen Z's characters above, the research proposed that performance and effort expectancy, as well as a social influence, would be a significant predictor of PIIT and continuance intentions. Therefore, this research aims to examine whether personal innovativeness in information technology can influence the continuance intentions to use a new ride-hailing app of the Z generation. This research also examines what factors can affect and generate the sense of innovativeness of the Z generation to try and continue to use a new brand.
The ease to use and perceived usefulness are alleged to become the most consideration for young users as they want everything to be simple, compact, easy to use, and useable. As they live in the internet era, they are passionate about technology and are adept at using it. They are intelligent and swiftly capture information. The surroundings readily impact them regarding good products and value freedom and opportunity to grow. Hence, social influence will be a very significant factor in generating their sense of innovation.
Knowing what factors encourage passengers to try and continue using new brand applications is very important, especially for new ride-hailing companies in Indonesia, so that they can be accepted by the market and get a good first impression from application users. Previous studies on this issue focused on giant existing ride-hailing apps such as Gojek, Grab, Uber, or Didi Chuxing. This research tried to fill the gap by observing gen Z's continuance intentions and behavior toward a new brand of the ride-hailing app. MAXIM and InDriver apps have been chosen as the research subject in this study.
These two Russian-originated super app companies have been severe competitors for Gojek and Grab as the existing players in the ride-hailing industry in Indonesia for the last three years. In short, this research will answer the question, "Does personal innovativeness in information technology of Gen Z will affect continuance intention to use a new brand of ride-hailing app? Will effort, performance expectancy, and social influence generate or affect personal innovativeness and continuance intentions?"
The ride-hailing application is a platform that makes it easy for drivers and passengers to communicate efficiently by involving three parties. Among them are passengers, drivers, and application service providers, where requests from passengers and driver availability can be met and provided by online transportation service providers (He & Shen, 2015; Pham et al., 2017). A survey conducted in the United States in 2016 stated that one of the most users of ride-hailing services is the millennial and Z generation as the primary
users of super apps in developing and developed countries (Davis & Neves, 2021). Nowadays, ride-hailing services provide alternative transportation for students and young professionals in urban areas where ride-hailing applications are trendy (Bomey, 2016).
Attracting the attention and interest of the Z generation to continue using the application is very important for the continued expansion of the ride-hailing services companies. In the literature, the desire to try new technologies, concepts, or products can be called personal innovativeness in information technology. Personal innovativeness can be interpreted as an individual's enthusiasm to try new technologies and tendency to accept innovations earlier than others (Yusra & Agus, 2019; Simarmata & Jaya Hia, 2020). When a user attempts a new ride-hailing app, the user's perception will be created from various points of view. Starting from perceived performance expectancy, social influence, and perceived effort expectancy on the system used are some examples of perceptions that will arise (Achiriani & Hasbi, 2021; Chen et al., 2019). In the end, these formed perceptions will encourage them to continue using new brand applications or, in the literature, continuance intention (Fauzi & Sheng, 2021).
Conversely, (S. Sair & Danish (2018) showed in their research that PIIT is a consequence, not a precedent factor. When users have experienced the benefits, convenience, and performance of a digital app or product both from others and themselves, their sense of innovativeness and curiosity will emerge to use it. When they have experienced it, they will be interested in becoming regular customers of the new brand of a new digital app or product. Therefore, literature has shown that personal innovativeness, effort, and performance expectancy have a reciprocal relationship.
Meanwhile, continuance intention to use is when users of information systems are satisfied with the information system used so that they intend to use it continuously (Kordina et al., 2019). The variety of innovations in ride-hailing services will undoubtedly impact customers' behavior in the future. Customers will consider continuing to use existing ridehailing services or trying new brands that have just emerged. Previous research has tried to observe consumer behavior by building a model to explain the factors that encourage people to continue using ride-hailing applications. From an economic, geographic, financial, and psychological, it has been proven to influence people's intentions and habits to continue using ride-hailing applications (Ma et al., 2019; Nguyen-Phuoc et al., 2021; Ofori et al., 2021).
This research contributes by explaining how PIIT significantly influences continuance intentions to use a new brand of the ride-hailing app among Gen Z. The Z generation is known for their open nature, daring to try new things, and very rational choices. They are very open to change and always curious about the latest technology that appears in the market (Petro, 2020). In this study, the extended model of UTAUT has been used. UTAUT is a framework for explaining user behavior to information technology. Four primary intention and usage determinants: performance expectancy, effort expectancy, social influence, and facilitating conditions: make up the foundation of UTAUT. However, by including personal innovativeness as a mediating component in the model, this study will expand the UTAUT framework.
The research object is the ride-hailing application of MAXIM and or InDriver. These Russian-generated ride-hailing apps started operating in Indonesia in 2018 (Maxim) and 2019 (InDriver) (Setyaningsih et al., 2019). In Indonesia, Maxim and InDriver are widely found in big cities such as Jakarta, Pekanbaru, Batam, Bandar Lampung, Yogyakarta, and Solo. Maxim and InDriver develop their applications and create hardware and software
systems that allow partners to connect to the company's services, process millions daily to monitor the quality of work and services, and analyze their business.
There are three determinant factors of continuance intentions, including effort and performance expectancy, and social influence. Effort Expectancy is the comfort, and convenience feeling associated with using a system (Venkatesh & Smith, 2003) Technology Accepted Model (TAM) explains that a person's intention to use a system is primarily determined by the effort expended to use it. The more accessible a system is to use, the more users are believed to be interested and love in accepting the plan. This statement is supported by research from Palau-Saumell et al. (2019), which examines the factors that influence continuance intention in restaurant reservation applications. They concluded a positive relationship between effort expectancy and continuance intentions. Research conducted by Indrawati & Putri (2018) concluded that effort expectancy positively affects the intention to continue using the Go-Pay app. Thus, the proposed hypothesis is as follows:
H1a: Perceived effort expectancy of Gen Z affects the continuance intention to use a new brand of ride-hailing app significantly
As explained earlier, effort expectancy talks about how comfortable and easy it is when using a system. It is, of course, very closely related to the role of personal innovativeness in technology, considering that it talks about the enthusiasm of individuals to try new technologies and the tendency of individuals to accept innovations earlier than others (Yusra & Agus, 2019). Research conducted by S. Sair & Danish (2018) concluded that there is a positive influence between effort expectancy on personal innovativeness in technology. So that the proposed hypothesis is as follows:
H1b: Perceived effort expectancy affects personal innovativeness in information technology of Gen Z significantly
While the Performance expectancy variable means the extent to which, if individuals use the system, the system can increase their performance (Venkatesh et al., 2003). Palau-Saumell et al. (2019) found a significant positive relationship between performance expectancy and continuance intentions. Then the research (Indrawati & Putri, 2018) also concluded that performance expectancy positively affected continuance intention. A previous study by S. A. Sair & Danish (2018a) concluded that the t performance expectation variable significantly affected the personal innovation variable in technology. Thus, the proposed hypothesis is as follows:
H2a: Perceived performance expectancy of Gen Z affects the continuance intention to use a new brand of ride-hailing app significantly
H2b: Perceived performance expectancy affects the personal innovativeness in information technology of Gen Z significantly
Aside from effort and performance expectancy, social influence has also proven to be an essential driving factor of continuance intention and personal innovativeness in information technology. Social influence can be defined as the extent to which consumers feel their closest people (family and friends) believe they should use the technology (Venkatesh & Smith, 2003). Research conducted by Chauhan et al. (2021) concluded that there is a positive relationship between social influence on personal innovativeness in information technology in the case of purchasing green products online. Furthermore, social influence has been proven to significantly affect continuance intention to use online-to-offline delivery services (Roh & Park, 2019) and shopping applications (Chopdar & Sivakumar, 2019). Thus, the proposed hypothesis is as follows:
H3a: Social influence positively affects personal innovativeness in information technology of Gen Z significantly
H3b: Social influence affects the continuance intentions of Gen Z to use a new brand of ride-hailing app significantly
A study by Thakur & Srivastava (2014) showed that personal innovativeness in IT significantly influences continuance intention in adopting mobile payments in India. When consumers are encouraged to test and embrace a digital app or product, it affects their desire to continue using it since they have experienced both the positive and negative aspects. So based on the research above, the proposed hypothesis is:
H4: Personal innovativeness in information technology of Gen Z affects continuance intention in using a new brand of ride-hailing app
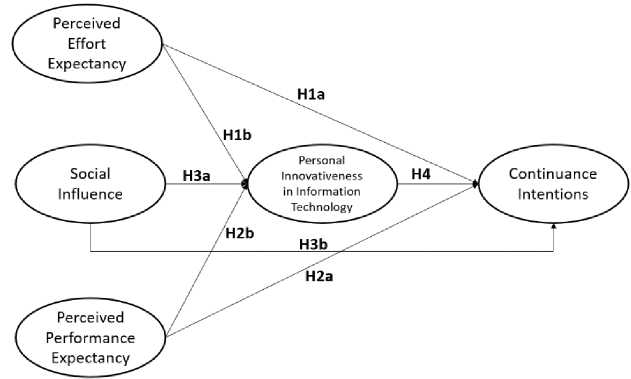
Figure 2. Proposed Model
METHODS
This study is based on primary data collected via online self-reported questionnaires. The surveys were distributed in Bahasa Indonesia for two weeks (12 - 26 August 2022), and 553 answers from generation Z respondents were gathered. Google forms are used to make the survey easier. The writers wrote the questions in a concise, straightforward, and transparent manner. Respondents were instructed to use initials rather than their full names to guarantee anonymity and that they felt comfortable completing the questionnaire correctly. This study used purposeful sampling, creating essential criteria to support the study aims (Gozali, 2018). The following are the respondents' selection criteria: 1) Born between 1996-2010 (12-26 years old), 2) have a personal cell phone, 3) have / are using the MAXIM or InDriver application, 4) have/often used online ride-hailing services in the MAXIM or InDriver application.
The UTAUT framework was utilized and modified in this study. As noted in the research gap, this study incorporated PIIT as a new variable. The authors did not include enabling circumstances and user behavior in their suggested model, instead replacing them with continuation intents. In doing so, the authors closely followed earlier studies (Fauzi & Sheng, 2021; S. Sair & Danish, 2018). A systematic questionnaire was developed to measure respondents' opinions and attitudes on the construct indicators (Gozali, 2018). Before the
release of the official questionnaire, a pilot study was conducted by distributing questionnaires to colleagues with Ph.D. degrees in management and behavioral economics who have considerable research skills to peer-review each indicator item. The conclusions of the peer review were then used as corrective material to improve the redaction of the questions for each indicator.
All variable indicators were assessed on a Likert scale of one to five, with one indicating strong disagreement and five indicating strong agreement. There are five latent variables which consist of exogenous (PPE, PEE, and SI), endogenous (CI), and mediating variable (PIIT). Those variables are adopted from previous studies. Perceived performance and effort expectancy variables are adopted from research conducted by (Ghalandari, 2012a; Onaolapo & Oyewole, 2018; Rahi et al., 2019; S. Sair & Danish, 2018). PIIT and CI were adopted from the research conducted by (Fauzi & Sheng, 2021; Hwang, 2014; Yusra & Agus, 2019) While SI was adopted from the study conducted by (Ghalandari, 2012a; Lu, 2014).
A mix of partial least squares and structural equation modeling was used to examine the data (PLS-SEM). SMART PLS 3.3.0 is used to perform the PLS-SEM analysis. The Confirmatory Factor Analysis (CFA) approach was used in this study since each latent variable's developed model and indicators were founded on a solid theoretical foundation in previous investigations. The PLS-SEM analysis is divided into two steps: the outer / measurement model and the inner/structural model test. Two approaches were used to establish the instrument's validity in the outer model test: convergent and discriminant validity. The Average Variance Extracted (AVE) value must be greater than 0.50 to determine convergence validity (Gozali, 2018). Instrument reliability was determined using the Composite Reliability (CR) and Cronbach's alpha (CA) scores. In the CFA approach, each latent variable with a CR and CA value larger than 0.70 is considered trustworthy. The discriminant validity was determined using the Heterotrait-Monotrait (HTMT) value. For an instrument to be legitimate, the HTMT ratio must be less than 0.90. The HTMT ratio, according to Henseler, Ringle, and Sinkovics (Henseler et al., 2009), is more reliable in determining discriminant validity in PLS-SEM analysis.
The inner model underwent four measurement assessments. The R2 value is calculated to test the coefficient determination. Second, the bootstrapping method was employed with a subsample of 5000 to determine the importance of the direct and indirect route coefficients. The t-statistical value or p-value is examined, which must be less than 0.05/0.10 for a path connection between latent variables to be pronounced significant. Third, as a complement, model fit analysis (goodness of fit) and the multicollinearity assumptions were tested. The SRMR, NFI, and Chi-Square ratios were calculated to determine the goodness of fit. The inner VIF test result is used to assess the multicollinearity assumption. Fourth, predictive relevance is determined by a blindfolding method based on cross-validated redundancy (J. F. Hair et al., 2018; Henseler et al., 2009).
RESULT AND DISCUSSION
Table 2 summarizes the profile of the respondents. Male and female respondents were equally represented in this survey. The gender split was 24.4:75.6, with 135 males and 418 females. 84.60% of respondents are undergraduate students, and 11.90% possess a diploma/bachelor's degree and are pursuing master's degrees. Meanwhile, 2.20% of respondents graduated from junior high school, while 0.4% are pursuing a doctoral degree. As the subject of this study was Z generations and pursuing a bachelor's degree, most respondents (72.90%) have a monthly expense budget of 500,000 – 1,000,000 rupiah. A hundred and twenty respondents (21.70%) have a monthly expense of 1,500,000 – 3,000,000
rupiah. It is referred to as the "students" budget. While 28 respondents have a monthly expense of 3,500,000 – 10,000,000 rupiah, only two have an expense budget of more than 10,000,000.
Table 2. Respondent Profile
|
Profile |
Frequency |
Percentage (%) |
Profile |
Frequency |
Percentage (%) |
|
Expenses per Month (in Rupiah) |
Gender | ||||
|
500,000 – 1,000,000 |
4 0 |
72.9% |
Male |
135 |
24.4% |
|
1,500,000 – 3,000,000 |
3 1 2 0 |
21.7% |
Female |
418 |
75.6% |
|
Experience Using Ride-Hailing App | |||||
|
3,500,000 – 10,000,000 |
28 |
5.1% |
1 – 2 years |
272 |
73.68% |
|
>10,000,000 |
2 |
0.4% |
3 – 4 years |
181 |
17.01% |
|
Education |
4 – 5 | ||||
|
years |
58 |
5.26% | |||
|
Junior High School |
11 |
2.20% |
> 5 years |
42 |
3.95% |
|
Senior High School College Student |
/ 46 8 |
Vehicle Ownership | |||
|
84.60% |
Yes |
321 |
58% | ||
|
No |
232 |
42% | |||
|
Diploma/ Bachelor |
66 |
11.90% |
The Number of Ride-Hailing Apps Used | ||
|
Master – Doctor |
7 |
1.30% |
Only 1 > 1 |
160 393 |
28.9% 71.1% |
Source: The result of data analysis
In addition, 393 respondents (71.1%) have more than one ride-hailing app. At the same time, 160 respondents (28.90%) have only one app. Besides, 321 respondents have their vehicle or belonging to the parent (guardian) whose use rights are handed over to them. At the same time, 232 respondents are not having a private vehicle (42%). Most respondents (73.68%) have been using ride-hailing apps for 1-2 years. One hundred eighty-one respondents (17.01%) used for 3-4 years, and the rest have been using ride-hailing apps for more than four years. According to the respondents' profiles, it can be concluded that all characteristics of Z generations are accommodated in the research survey.
SEM-PLS has at least two requirements. SEM-PLS testing requires the absence of missing values and outliers (J. Hair et al., 2017). Out of 553 completed surveys, none of them are missing values. Following the screening procedure, the final sample size for this study is still 553 respondents. The 553 samples utilized in this investigation follow the suggestion of (J. Hair et al., 2017), who said that the number of samples appropriate for data analysis using the SEM-PLS technique should be 5-10 times the number of indicators. There are 28
indicators from five variables in which the minimal sample is 160 - 280. As a result, the overall sample size of this study met the requirement.
Second, SEM-PLS necessitates that the construct variables and indicators be multicollinearity. This requirement may be satisfied by utilizing the PLS technique to calculate the value of the inner VIF. If the Variance Inflation Factor (VIF) value is more than 3, it is assumed that the indicators are multicollinear (J. Hair et al., 2017). The inner VIF value among the variables and indicators is less than three, as shown in Table 3. As a result, this study finds that there is no multicollinearity assumption.
Table 3. Inner V.I.F. Test Result
|
Continuance Intentions |
Personal Innovativeness in Information Technology | |
|
Continuance Intentions to Use a New Brand | ||
|
Perceived Effort Expectancy |
2.448 |
2.387 |
|
Personal Innovativeness in Information Technology |
1.390 | |
|
Perceived Performance Expectancy |
2.329 |
2.418 |
|
Socia Inf uence |
1.462 |
Source: The result of data analysis
Third, the model fit evaluation should assess the combined performance of the outer/measurement and structural/inner models (J. F. Hair et al., 2018). The SMART PLS official website describes the different threshold value requirements. It specified that the RMS (Root Mean Square) Theta value should be less than 0.102, the SRMR (Standardized Root Mean Square) value should be less than 0.10 or 0.08, and the NFI value should be more than 0.9 or close to one (Henseler et al., 2014). The calculated model's NFI value is 0.8710 (near 1), and the SRMR value is 0.0580 (<0.10), as shown in Table 4. Consequently, the model constructed in this study satisfied the Goodness of Fit (GoF) assumption.
Table 4. Model Fit Test Result
Saturated Model Estimated Model
|
SRMR |
0.0540 |
0.0580 |
|
d_ULS |
1.2000 |
1.3670 |
|
d_G |
0.3600 |
0.3700 |
|
Chi-Square |
1097.1180 |
1120.3270 |
|
NFI |
0.8740 |
0.8710 |
Source: The result of data analysis
The CA, CR, AVE, and HTMT scores should be used to analyze instrument reliability, convergent validity, and discriminant validity. Table 5 shows that all of the indicator items in this study have an outer loading value of more than 0.70, indicating that all indicators included accurately characterize the construct. According to the table, the CR and CA values for each latent variable in this study are more than 0.70. Each hidden variable
|
has an AVE value greater than 0.50. The results above imply that the instrument built from these latent variables and indicators is trustworthy and valid. Table 5. Convergent Validity and Reliability | |||||
|
Variable |
Code |
Outer Loading |
Cronbach's Alpha |
Composite Reliability |
AVE |
|
CI 1 |
0.862 | ||||
|
CI 2 |
0.858 |
0.902 |
0.928 |
0.719 | |
|
Continuance | |||||
|
Intentions to Use |
CI 3 |
0.844 | |||
|
New Brand | |||||
|
CI 4 |
0.817 | ||||
|
CI 5 |
0.858 | ||||
|
PEE 1 |
0.783 | ||||
|
PEE 2 |
0.838 | ||||
|
PEE 3 |
0.859 | ||||
|
Perceived Effort | |||||
|
PEE 4 |
0.827 |
0.91 |
0.928 |
0.650 | |
|
Expectancy | |||||
|
PEE 6 |
0.769 | ||||
|
PEE 7 |
0.742 | ||||
|
PEE 8 |
0.820 | ||||
|
PIIT 2 |
0.729 | ||||
|
PIIT 3 |
0.762 | ||||
|
Personal | |||||
|
Innovativeness in |
PIIT 4 |
0.812 |
0.87 |
0.902 |
0.602 |
|
Information |
PIIT 5 |
0.764 | |||
|
Technology | |||||
|
PIIT 6 |
0.801 | ||||
|
PIIT 7 |
0.797 | ||||
|
PPE 1 |
0.800 | ||||
|
PPE 2 |
0.763 | ||||
|
Perceived |
PPE 3 |
0.762 |
0.863 |
0.897 |
0.593 |
|
Performance | |||||
|
Expectancy |
PPE 4 |
0.775 | |||
|
PPE 5 |
0.770 | ||||
|
PPE 7 |
0.748 | ||||
Source: The result of data analysis
Table 5. Convergent Validity and Reliability (Continue)
|
Variable |
Code |
Outer Loading |
Cronbach's Alpha |
Composite Reliability |
AVE |
|
SI 1 |
0.794 | ||||
|
SI 2 |
0.811 | ||||
|
Social Influence |
SI 3 |
0.824 |
0.801 |
0.869 |
0.624 |
|
SI 4 |
0.726 |
Source: The result of data analysis
On the other hand, the Heterotrait-Monotrait (HTMT) value was used to measure the instrument's discriminant validity. For a tool to be legitimate, the HTMT ratio must be less than 0.90 (Henseler et al., 2009). The total value of the HTMT ratio for each latent variable in Table 6 is less than 0.90, showing that this research instrument is adequate and valid for measuring the model constructed.
|
Table 6. Discriminant Validity (HTMT Ratio) | |||||
|
Continuance Intentions |
Perceived Effort Expectancy |
Personal Innovativeness in Information Technology |
Perceived Performance Expectancy |
Social Influence | |
|
Continuance Intention | |||||
|
Perceived Effort Expectancy |
0.680 | ||||
|
Personal Innovativeness in Information Technology |
0.485 |
0.566 | |||
|
Perceived Performace Expectancy |
0.655 |
0.838 |
0.533 | ||
|
Social Influence |
0.614 |
0.613 |
0.552 |
0.628 | |
|
Source: The result of data analysis | |||||
The initial stage of structural model analysis is determining the coefficients. The R2 value acquired by the PLS algorithm stages determines it. R2 values are divided into three categories: 0.75 (strong), 0.50 (moderate), and 0.25 (weak) (J. F. Hair et al., 2018). According to Table 7, the R2 values of continuance intentions (0.4320) and PIIT (0.3330) are weak since they are lesser than 0.50 but more significant than 0.25. As a result, independent factors have little role in explaining the dependent variable. It is understandable as the study on continuance intentions to use ride-hailing apps has a comprehensive explanation and driving factors. The R2 value of PIIT is 0.3330 means that SI, PPE, and PEE contributed 33.30% to influencing personal innovativeness in information technology. At the same time, the factors outside the model explain the rest (66.70%). At the same time, the R2 value of CI is 0.4320 means that SI, PPE, PEE, and PIIT contributed 43.20% to influence the behavioral intentions as endogenous variables. The factors outside the model explain the rest (56.80%).
Table 7. R2 Results
|
R Square |
R Square Adjusted | |
|
Continuance Intentions |
0.4320 |
0.4280 |
|
Personal Innovativeness in Information Technology |
0.3330 |
0.3290 |
Source: The result of data analysis
The inner model test evaluates the blindfolding outcome in the second part. Blindfolding is a method of determining the level of relevance of predictions from a construct model using the value of Q2. If Q2 is more than 0.05, we can conclude that a construct model is significant. Table 8 shows that the Q2 value of the two endogenous variables in this study is more than
0.05. (0.3040 & 0.194). Consequently, the exogenous variables employed in this study to anticipate endogenous variables are exact.
|
Table 8. Blindfolding Test Results | |||
|
SSO |
SSE |
Q² (=1-SSE/SSO) | |
|
Continuance Intentions |
2630 |
1831.504 |
0.304 |
|
Perceived Effort Expectancy |
3682 |
3682 | |
|
Personal Innovativeness in Information Technology |
3156 |
2545.24 |
0.194 |
|
Perceived Performance Expectancy |
3156 |
3156 | |
|
Social Influence |
2104 |
2104 | |
|
Source: Result Analysis Data (2022) | |||
The inner model analysis procedure concludes with hypothesis testing using the bootstrapping approach. The researcher used 5,000 sub-samples to check the data's stability level to assess the structural model's applicability (J. F. Hair et al., 2017). The significance threshold in this study was 10%. It is a frequently regarded degree of significance in economics and management sciences.
Table 9 displays the results of the direct connection. PEE positively and substantially affects PIIT and CI (β = 0.297, 0.397 p-value = 0.000, 0.000). Similarly, PPE significantly and positively influences PIIT and CI (β = 0.1180, 2740 p-value = 0.097, 0.000). A similar conclusion is obtained in social influence, which has a positive and significant effect on PIIT (β = 0.2770 p-value = 0.0000). SI impacts CI indirectly through the mediating effect of PIIT (β = 0.036, p-value = 0.0510). As a mediator variable, PIIT impacts continuation intentions positively and significantly in a direct connection (β = 0.128 p-value = 0.0150).
Table 9. Direct Effect Test Results
|
Hypothesis |
Path |
Original Sample |
Standard Deviation |
T Statistics |
P Values |
Decision |
|
H1a |
PEE → CI |
0.397 |
0.053 |
7.555 |
0.0000 |
Supported* |
|
H1b |
PEE → PIIT |
0.279 |
0.073 |
3.814 |
0.0000 |
Supported* |
|
H2a |
PPE → CI |
0.274 |
0.055 |
4.938 |
0.0000 |
Supported* |
|
H2b |
PPE → PIIT |
0.118 |
0.071 |
1.661 |
0.0970 |
Supported** |
|
H3a |
SI → PIIT |
0.277 |
0.047 |
5.865 |
0.0000 |
Supported* |
|
H3b |
SI → CI |
0.036 |
0.018 |
1.954 |
0.0510 |
Supported** |
|
H4 |
PIIT → CI |
0.128 |
0.052 |
2.439 |
0.0150 |
Supported* |
|
*5% significant level |
**10% significant level | |||||
The data suggest that the model's mediation relationship requirements have been satisfied. The independent variable must impact the mediator variable, and the mediator variable must affect the dependent variable concurrently for the intervening variable's mediating effect to operate (Hayes, 2018). As a result, PIIT likely mediates the interaction between PPE, PEE, and SI on continuance intentions to adopt a new brand of ride-hailing apps. To demonstrate this, we must examine the outcomes of the specific indirect effect.
Table 10 depicts the indirect relationship between latent variables. The table demonstrates that PIIT substantially mediated the link between SI and CI (β = 0.0360, p-
value = 0.0510). PIIT also mediates the connection between PEE and CI (β = 0.0360, p-value = 0.0320). PIIT, on the other hand, did not moderate the link between PPE and CI (β = 0.0150 p-value = 0.2010). It concludes that the PIIT (as a research gap) strongly mediates SI but not PEE. All hypotheses (H1a, H1b, H2a, H2b, H3a, H3b, and H4) are supported based on the results above. The research question of this study has also been answered.
|
Table 10. Indirect Effect Test Results | ||||
|
Path |
Original Sample |
Standard Deviation |
T Statistics |
P Values |
|
PEE→ PIIT→ CI |
0.036 |
0.017 |
2.141 |
0.032 |
|
PPE→PIIT→CI |
0.015 |
0.012 |
1.279 |
0.201 |
|
SI → PIIT →CI |
0.036 |
0.018 |
1.954 |
0.051 |
The finding shows that effort expectancy became the most significant factor in influencing continuance intentions to use a new brand of the ride-hailing app (β = 0.297, 0.397 p-value = 0.000, 0.000). This research has strongly supported previous findings. It revealed that effort expectancy indeed has a significant effect on behavioral intentions to adopt mobile commerce (S. Sair & Danish, 2018), mobile learning (Onaolapo & Oyewole, 2018), and ridehailing apps (Rahi et al., 2019). Like the previous studies, this research has also proven that effort expectancy has significantly affected the personal innovativeness of Gen Z to try to use a new brand of ride-hailing app. The finding supported the research from S. Sair & Danish (2018), who found the same result in the issue of mobile commerce adoption.
The flexibility, ease to use, and comfortability of MAXIM and InDriver have attracted Gen Z ride-hailing users to use their ride-hailing services. The more easily known an application is to be used, the more it makes Gen Z interested in trying to use the application. When they have experienced and confirmed that the application is indeed easy to use, they decide to continue using it. It validated the finding from the IBM study, as cited by Froehlich (2022), which stated that for Gen Z, apps on mobile devices should be simple to use even with one hand. Important buttons should be located near the bottom of the screen, where the user can quickly access them with one thumb. As a result, the first hypotheses (H1a and H1b) are fully validated since the behavioral intention to continue using ride-hailing apps is a function of ease of use, implying that PPE is a substantial predictor of personal innovativeness and continuance behavior.
The finding also revealed that performance expectancy had influenced continuance intentions to use a new ride-hailing mobile app. The positive coefficient value (β = 2740 p-value = 0.000) indicates a positive and significant relationship between performance expectancy on continuance intentions. This research has supported previous findings revealing that performance expectancy (perceived usefulness) significantly affects behavior intentions to use E-banking services (Ghalandari, 2012), fashion brand websites (Loureiro et al., 2018), and mobile commerce (S. Sair & Danish, 2018).
This research has provided additional evidence in the case of the ride-hailing app industry. Conversely, this research has also rejected the study from Verkijika (2018), who revealed that performance expectancy has no significant direct relationship with consumers' behavioral intentions. This research also found that performance expectancy has significantly affected the personal innovativeness of Gen Z to use MAXIM / InDriver as a new ride-hailing app. As a result, the first hypotheses (H1a and H1b) are fully validated.
The special features offered by MAXIM / InDriver have been affecting Gen Z users to continue to use their ride-hailing apps. MAXIM offers a reservation feature where users can order drivers' services before the departure time. MAXIM also provides a feature where users can give tip money to get them faster. While InDriver offers a feature where users can
pick and choose their drivers and bid the tariff. It is something that has never been provided by ride-hailing services before. Those unique features have encouraged gen Z users to continue to use the ride-hailing service from MAXIM / InDriver. It is concluded that a unique feature that gives additional function and value to users will be a significant factor for users to use a new brand of digital app. As a result, the first hypotheses (H2a and H2b) are fully supported.
The same result has been found in the case of social influence. It is proven in this research to influence continuance intentions significantly and the personal innovativeness of gen Z. Social factors significantly impact cognition and information processing, which in turn affects the development of cognitive personality traits. Users of ride-hailing apps communicate essential information and impressions on social networks. Feedback from others on whether to utilize specific new or updated services and brands eventually influences the level of confidence and readiness to cope with changes in the mobile setting (Lu, 2014).
The intense information from social networks, both real life and online social network, will generate the personal innovativeness of Gen Z users to use a new brand of ridehailing app. Combined with positive performance and effort expectancy, they finally decide to continue using it. These findings theoretically have supported the previous research from Ghalandari (2012) and Lu (2014), who found the same result in the context of mobile commerce and E-banking services. As a result, the first hypotheses (H3a and H3b) are fully validated.
The last, personal innovativeness, has been found to substantially mediate the relationship between social influence and effort expectancy on continuance intentions in table 10. In a direct connection, the personal innovativeness of Gen Z influences their continuance intentions to use MAXIM / InDriver. This research has supported previous research (Fauzi & Sheng, 2021; Lu, 2014; Yusra & Agus, 2019). As a result, the first hypotheses (H4) are fully supported. Generating a sense of innovativeness in Gen Z is one of the fundamental ways and a first step to making them continue to use a new ride-hailing app. Youngsters will immediately know the drawbacks and excesses of the new app when they have experienced a new digital app. They will decide to continue using the app. In this study, social influence and performance, and effort expectancy are the triggering factors of Gen Z to innovatively dare to try and use a new brand of ride-hailing app (personal innovativeness).
CONCLUSION
The intense competition between super app companies in providing online motorcycle taxi services in Indonesia has prompted many researchers to investigate what factors make users want to become loyal customers of an application. The investigation findings in this issue are beneficial in practice for digital companies providing online motorcycle taxi services. For new companies, knowing the factors driving the use of new brand applications allows them to develop effective marketing and market penetration strategies to be accepted by the public. Existing companies can strategize from the research findings on how to keep their regular customers from switching to new brands.
This study specifically examines the role of personal innovativeness in information technology in mediating the relationship between social influence and perceived performance and effort expectancy on continuance intentions to use MAXIM / InDriver
application among Z generations in Indonesia. The results have answered the research questions by showing that the three predictor variables (SI, PPE, and PEE) positively and significantly influenced continuance intention to use the new ride-hailing app via the mediating role of PIIT (except PPE). The ease of using the application perceived by users is the most substantial factor in influencing their desire to try and innovate (PIIT) to use and become regular customers of new branded online motorcycle taxi applications, followed by social influence and perceived benefits and performance expectations of the application.
When the surrounding environment influences users, and they have experienced the benefits, convenience, and performance of the new online motorcycle taxi application both from others and themselves, their innovative and curious souls will emerge to use it. When they have experienced it, they will be interested in becoming regular customers of the new brand of online motorcycle taxis. This research contributes to the theory building that has been built by explaining how personal innovativeness is a significant influence in explaining continuance intentions to use a new brand of the ride-hailing app.
Although this study effectively addressed the challenges and aims, it still has shortcomings requiring additional investigation. First, the driving factors of continuance intentions to use ride-hailing apps vary. This research only investigates the role of personal innovativeness in information technology with three exogenous variables (SI, PEE, and PPE). Future studies must explore other essential factors by utilizing other theoretical frameworks, such as expectation-confirmation theory (ECM) and the or even integrated model (UTAUT X ECM). Second, this research specifically observed the behavioral continuance intentions to use the new brand of the ride-hailing app of the Z generation. Future studies must investigate other generational groups or geographical-segmented consumers.
REFERENCES
Achiriani, M., & Hasbi, I. (2021). Pengaruh Performance Expectancy, Effort Expectancy, Social Influence, Perceived Risk, Perceived Cost Terhadap Behavioral Intention Pada Pengguna Dompet Digital Dana Di Indonesia. E-Proceeding of Management, 376–388.
Alananto, D., & Wahyudi, T. (2021). Determinants of Consumer Preference on Ride-Hailing
Platforms in Southeast Asia JMSAB 199. 4(1), 207–216.
https://doi.org/10.36407/jmsab.v4i1.380
Almunawar, M. N., Anshari, M., & Ariff Lim, S. (2020). Customer acceptance of ride-hailing in Indonesia. Journal of Science and Technology Policy Management, 12(3), 443–462. https://doi.org/10.1108/JSTPM-09-2019-0082
Almunawar, M. N., Anshari, M., & Ariff Lim, S. (2021). Customer acceptance of ride-hailing in Indonesia. Journal of Science and Technology Policy Management, 12(3), 443–462. https://doi.org/10.1108/JSTPM-09-2019-0082
Amoroso, D. L., & Chen, Y. (2017). Constructs Affecting Continuance intention in consumers with mobile financial apps: a dual-factor approach. Journal of Information Technology Management, 28(3), 1–24.
Bomey, N. (2016, December 19). Millennials spurn driver's licenses, study finds. USA TODAY. https://www.usatoday.com/story/money/cars/2016/01/19/drivers-licenses-uber-lyft/78994526/
Chauhan, H., Pandey, A., Mishra, S., & Rai, S. (2021). Modeling the predictors of consumers' online purchase intention of green products: the role of personal innovativeness and environmental drive. Environment, Development and Sustainability, 23(11), 16769– 16785. https://doi.org/10.1007/s10668-021-01337-9
Chen, C.-C., Liao, C.-C., Chen, H.-H., Wang, H.-W. M., & Zhuo, W.-X. (2019). The Effect of Personal Innovativeness on Mobile Payment to Behavioral Intentions Perceived Enjoyment as a Moderator. 2019 IEEE International Conference on Consumer Electronics - Taiwan (ICCE-TW), 1–2. https://doi.org/10.1109/ICCE-
TW46550.2019.8992013
Chopdar, P., & Sivakumar, V. J. (2019). Understanding continuance usage of mobile shopping applications in India: the role of espoused cultural values and perceived risk. Behavior & Information Technology, 38(1), 42–64. https://doi.org/10.1080/0144929X.2018.1513563
Fauzi, A. A. (2018). Electronic Service Quality On Mobile Application Of Online Transportation Services. 13–27.
Fauzi, A. A., & Sheng, M. L. (2020). Ride-hailing apps' continuance intention among different consumer groups in Indonesia: the role of personal innovativeness and perceived utilitarian and hedonic value. Asia Pacific Journal of Marketing and Logistics, 33(5), 1195–1219. https://doi.org/10.1108/APJML-05-2019-0332
Fauzi, A. A., & Sheng, M. L. (2021). Ride-hailing apps' continuance intention among different consumer groups in Indonesia: the role of personal innovativeness and perceived utilitarian and hedonic value. Asia Pacific Journal of Marketing and Logistics, 33(5), 1195–1219. https://doi.org/10.1108/APJML-05-2019-0332
Froehlich, N. (2022, January 12). Understanding The Differences In Mobile App Use Across Generations. Forbes.
Ghalandari, K. (2012a). The Effect of Performance Expectancy, Effort Expectancy, Social Influence and Facilitating Conditions on Acceptance of E-Banking Services in Iran: the Moderating Role of Age and Gender. Middle-East Journal of Scientific Research, 12(6), 801–807. https://doi.org/10.5829/idosi.mejsr.2012.12.6.2536
Ghalandari, K. (2012b). The Effect of Performance Expectancy, Effort Expectancy, Social Influence and Facilitating Conditions on Acceptance of E-Banking Services in Iran: the Moderating Role of Age and Gender. Middle-East Journal of Scientific Research, 12(6), 801–807. https://doi.org/10.5829/idosi.mejsr.2012.12.6.2536
Gozali, I. (2018). Aplikasi analisis multivariate dengan program IBM SPSS 25 (9th ed.). Badan Penerbit Universitas Diponegoro.
Hair, J. F., Matthews, L. M., Matthews, R. L., & Sarstedt, M. (2017). PLS-SEM or CB-SEM: updated guidelines on which method to use "PLS-SEM or CB-SEM: updated guidelines on which method to use." In Organizational Research Methods, MIS Quarterly, and International Journal (Vol. 1, Issue 2).
Hair, J. F., Risher, J. J., Sarstedt, M., & Ringle, C. M. (2018). The Result pf PLS-SEM. Eur.Bus.Rev, 31(1), 2–24.
Hair, J., Hollingsworth, C. L., Randolph, A. B., & Chong, A. Y. L. (2017). An updated and expanded assessment of PLS-SEM in information systems research. Industrial Management and Data Systems, 117(3), 442–458. https://doi.org/10.1108/IMDS-04-2016-0130
He, F., & Shen, Z.-J. M. (2015). Modeling taxi services with smartphone-based e-hailing applications. Transportation Research Part C: Emerging Technologies, 58, 93–106. https://doi.org/https://doi.org/10.1016/j.trc.2015.06.023
Henseler, J., Dijkstra, T. K., Sarstedt, M., Ringle, C. M., Diamantopoulos, A., Straub, D. W., Ketchen, D. J., Hair, J. F., Hult, G. T. M., & Calantone, R. J. (2014). Common Beliefs and Reality About PLS: Comments on Rönkkö and Evermann (2013). Organizational Research Methods, 17(2), 182–209. https://doi.org/10.1177/1094428114526928
Henseler, J., Ringle, C. M., & Sinkovics, R. R. (2009). The use of partial least squares path modeling in international marketing. Advances in International Marketing, 20, 277–319. https://doi.org/10.1108/S1474-7979(2009)0000020014
Hwang, Y. (2014). User experience and personal innovativeness: An empirical study on the Enterprise Resource Planning systems. Computers in Human Behavior, 34, 227–234. https://doi.org/10.1016/j.chb.2014.02.002
Indrawati, & Putri, D. (2018a). Analyzing factors influencing continuance intention of Epayment adoption using modified UTAUT 2 Model: (A case study of Go-Pay from Indonesia). 2018 6th International Conference on Information and Communication Technology, ICoICT 2018, 167–173. https://doi.org/10.1109/ICoICT.2018.8528748
Indrawati, & Putri, D. A. (2018b). Analyzing factors influencing continuance intention of Epayment adoption using modified UTAUT 2 Model: (A case study of Go-Pay from Indonesia). 2018 6th International Conference on Information and Communication Technology, ICoICT 2018, December, 167–173.
https://doi.org/10.1109/ICoICT.2018.8528748
Kordina, L., Hayuhardhika, W., & Herlambang, A. (2019). Evaluasi Keadaan Continuance Intention to Use dan Citizen Support pada Implementasi Layanan Website Pusat Pelayanan Pengaduan Masyarakat (P3M) Kabupaten Sidoarjo. Jurnal Pengembangan Teknologi Informasi Dan Ilmu Komputer, 3(5), 2548–2964. http://j-ptiik.ub.ac.id
Kumala, A. (2019). Indonesia is poised to become a Southeast Asian giant in the digital economy. Antara News. https://en.antaranews.com/news/135802/indonesia-poised-to-become-southeast-asian-giant-in-digital-economy
Loureiro, S. M. C., Cavallero, L., & Miranda, F. J. (2018). Fashion brands on retail websites: Customer performance expectancy and e-word-of-mouth. Journal of Retailing and Consumer Services, 41, 131–141. https://doi.org/10.1016/j.jretconser.2017.12.005
Lu, J. (2014). Are personal innovativeness and social influence critical to continue with mobile commerce? Internet Research, 24(2), 134–159. https://doi.org/10.1108/IntR-05-2012-0100
Onaolapo, S. A., & Oyewole, O. K. (2018). Performance Expectancy, Effort Expectancy, and Facilitating Conditions as Factors Influencing Smart Phones Use for Mobile Learning by
Postgraduate Students of the University of Ibadan, Nigeria. Interdisciplinary Journal of E-Skills and Lifelong Learning, 14, 95–115.
Palau-Saumell, R., Forgas-Coll, S., Sánchez-García, J., & Robres, E. (2019a). User Acceptance of Mobile Apps for Restaurants: An Expanded and Extended UTAUT-2. Sustainability, 11(4), 1210. https://doi.org/10.3390/su11041210
Palau-Saumell, R., Forgas-Coll, S., Sánchez-García, J., & Robres, E. (2019b). User Acceptance of Mobile Apps for Restaurants: An Expanded and Extended UTAUT-2. Sustainability, 11(4), 1210. https://doi.org/10.3390/su11041210
Pham, A., Dacosta, I., Jacot-Guillarmod, B., Huguenin, K., Hajar, T., Tramèr, F., Gligor, V., & Hubaux, J.-P. (2017). Proceedings on Privacy Enhancing Technologies; ():1-19 PrivateRide: A Privacy-Enhanced Ride-Hailing Service. Proceeding on Privacy Enhancing Technologies, 1–19.
Rahi, S., Othman Mansour, M. M., Alghizzawi, M., & Alnaser, F. M. (2019). Integration of UTAUT model in internet banking adoption context: The mediating role of performance expectancy and effort expectancy. Journal of Research in Interactive Marketing, 13(3), 411–435. https://doi.org/10.1108/JRIM-02-2018-0032
Roh, M., & Park, K. (2019). Adoption of O2O food delivery services in South Korea: The moderating role of moral obligation in meal preparation. International Journal of Information Management, 47, 262–273.
https://doi.org/https://doi.org/10.1016/j.ijinfomgt.2018.09.017
Sair, S. A., & Danish, R. Q. (2018a). Effect of performance expectancy and effort expectancy on the mobile commerce adoption intention through personal innovativeness among Pakistani consumers. Pakistan Journal of Commerce and Social Science, 12(2), 501–520.
Sair, S. A., & Danish, R. Q. (2018b). Effect of performance expectancy and effort expectancy on the mobile commerce adoption intention through personal innovativeness among Pakistani consumers. Pakistan Journal of Commerce and Social Science, 12(2), 501–520.
Sair, S., & Danish, R. (2018). Effect of Performance Expectancy and Effort Expectancy on the Mobile Commerce Adoption Intention through Personal Innovativeness among Pakistani Consumers. Pakistan Journal of Commerce and Social Sciences, 12(2), 501–520.
Salim, I., Ricardo, R., MZ, S. B., & Marisa, T. (2021). Faktor Yang Mempengaruhi Kepuasan Pelanggan Dalam Layanan Ride Hailing Di Indonesia. Jurnal Aplikasi Bisnis Dan Manajemen. https://doi.org/10.17358/jabm.7.1.135
Setyaningsih, E., Ismawan, E., & HIdayat, T. (2019). Analisa Tingkat Kepuasan Pelanggan Transportasi Online Maxim di Balikpapan. Jurnal Sistem Informasi, 3(1).
Simarmata, M. T. A., & Jaya Hia, I. (2020). The Role Of Personal Innovativeness On Behavioral Intention Of Information Technology. Journal of Economics and Business, 01(02), 18–29.
Tam, C., Santos, D., & Oliveira, T. (2020). Exploring the influential factors of continuance intention to use mobile Apps: Extending the expectation confirmation model. Information Systems Frontiers, 22(1), 243–257. https://doi.org/10.1007/s10796-018-9864-5
Thakur, R., & Srivastava, M. (2014). Adoption readiness, personal innovativeness, perceived risk, and usage intention across customer groups for mobile payment services in India. Internet Research, 24(3), 369–392. https://doi.org/10.1108/IntR-12-2012-0244
Venkatesh, V., Morris G., M., Davis, G. B., & Davis, F. D. (2003). USER ACCEPTANCE OF INFORMATION TECHNOLOGY: TOWARD A UNIFIED VIEW. MIS Quarterly: Management Information Systems, 27(3), 425–478.
https://doi.org/10.1201/9780849375477.ch230
Venkatesh, V., & Smith, R. (2003). User Acceptance Of Information Technology: Toward a Unified View. MIS Quarterly, 27(3), 425–478.
Verkijika, S. F. (2018). Factors influencing the adoption of mobile commerce applications in Cameroon. Telematics and Informatics, 35(6), 1665–1674.
https://doi.org/10.1016/j.tele.2018.04.012
Yusra, Y., & Agus, A. (2019). The Influence of Online Food Delivery Service Quality on Customer Satisfaction and Customer Loyalty: The Role of Personal Innovativeness. Journal of Environmental Treatment Techniques, 8(1), 6–12.
Discussion and feedback