Price Discovery Pada Pasar Obligasi Pemerintah Indonesia
on
Buddi Wibowo, Price Discovery Pada Pasar Obligasi Pemerintah Indonesia …

MATRIK: JURNAL MANAJEMEN, STRATEGI BISNIS DAN KEWIRAUSAHAAN
Homepage: https://ojs.unud.ac.id/index.php/jmbk/index
Vol. 15 No. 1, Agustus (2021), 177-187
Price Discovery in Indonesia Government Bond Market
Buddi Wibowo
1,2) Faculty of Economics and Business, Universitas Airlangga, Surabaya, Indonesia
-
3) Faculty of Economics and Business, STIESIA, Surabaya, Indonesia
email: dewi_hanggraeni@yahoo.com


SINTA 2
DOI : https://doi.org/10.24843/MATRIK:JMBK.2021.v15.i02.p02
ABSTRACT
The study investigate price discovery in Indonesia government bond market. Understanding price discovery is a must to identify relevant factor affecting price of the asset. This research examines two market types, interdealer market and customer market. Using dealer and customer order flow, the study identifies which order flow influences price formation in government bond market. The results show the short-term dealer order flow and short-term customer order flow have role in price discovery process. Customer flow order regression coefficient is larger than the dealer order flow. Customers trade not only trade based on liquidity but also have information in making decisions or making investment portfolios (informed customers). At the group dealer order flow, dealers have a heterogeneous role and have different segments.
Keyword: price discovery, order flow, government bond
Price Discovery Pada Pasar Obligasi Pemerintah Indonesia
ABSTRAK
Penelitian ini bertujuan untuk menjelaskan peran berbagai pelaku pasar yang berbeda dalam proses price discovery di pasar obligasi pemerintah. Memahami price discovery sangat penting dalam mengidentifikasi faktor-faktor yang mempengaruhi terciptanya harga. Penelitian ini akan mencakup dua jenis pasar. Jenis pertama adalah pasar interdealer dan kedua adalah pasar pelanggan. Hasil analisis menyimpulkan bahwa pada pasar obligasi pemerintah Indonesia terdapat perbedaan jenis order flow dari pelaku pasar yang mempengaruhi harga yaitu order flow dealer berpengaruh dalam jangka pendek dan order flow dari customer untuk jangka Panjang dan menengah. Dalam perdagangan obligasi pemerintah Indonesia, kelompok customer terbukti tidak hanya melakukan perdagangan berdasarkan pertimbangan likuiditas saja namun memiliki informasi dalam mengambil keputusan atau membuat portofolio investasi dengan memanfaatkan informasi yang bersifat atau berdampak jangka pendek. Hal ini terlihat dari hanya order flow jangka pendek dari customer yang mempengaruhi perubahan yield obligasi berjangka waktu Panjang dan menengah. Hasil penelitian juga menunjukkan peran dealer secara individual, bahwa dealer memiliki peran secara heterogen dan memiliki segmen pasar yang berbeda pula.
Kata kunci: price discovery, order flow, obligasi pemerintah
INTRODUCTION
Price discovery in financial market is an important issue, especially in market microstructure research. Czech et al., (2021) state that price discovery is one of two main functions of financial markets, where the first function is to provide liquidity for all market participants and the second function is price discovery, which is a medium for creating prices of financial securities.
Market microstructure literature defines various concepts of price discovery, including: "the process of finding the equilibrium price"(Czech et al., 2021), "collection and interpretation of news"(Banerjee & Pradhan, 2021), “the process of incorporating information implicit in investor trading into market prices” (Balcilar et al., 2021), “mechanisms for yield curve changes that are heterogeneous incorporation of private information and/or interpretation of public information through trading in the bond market” (Wang & Hu, 2021), and “integration of information in a timely manner into market prices” (Guidolin et al., 2021). From above definitions, it can be concluded that price discovery is a dynamic process that occurs naturally in which the process of creating market prices through rapid price adjustments driven by the presence of a series of information.
For market practitioners, it is very crucial and urgent to understand price discovery because it is basic information to forecast future price and make an fund allocation among securities. Investment strategy necessarily is based on information of market mechanism in absorbing new information (Czech et al., 2021).
Previous research on price discovery, e.g Czech et al. (2021); Balcilar et al., (2021), Wang & Hu, (2021), show contemporary order flows has significant impact on daily price changes. It reflects net buy pressure, differences of seller intiated trade and buyer-initiated trades.
(Banerjee & Pradhan, 2021) define private information as information which is not known to all parties, except for few market participant who have better analytical skills and can obtain important information by paying a certain amount of money or having special connections with special sources of information so that they can forecast price movement better than average investors who only rely on public information. Periodic price adjustments implies that prices do not fully reflect all the information at that time and indicate that there is asymmetric information from market participants.
Valseth (2013) divides private information into two aspects as follows:
-
1) The first aspect is heterogeneous interpretation of macroeconomic indicators
-
2) The second aspect is special source of information which market participants may take an advantage in determining their trading strategy such as customers trading data which reflect market sentiment that drive price to specific direction.
Dealer power, according to Valseth (2013), Czech et al., (2021) dan El-Shagi & Schweinitz, (2018) is the ability to make an effective trading strategy from public and private information. If the information in the dealer order flow reflects only or exactly matches the information contained in the customer's order flow so it indicates that the dealer have no private information and are only function as passive mediator who help customer to bid some orders. On the other hand, if dealers order flow contain more information than the customer order flow, dealers contribute more to price discovery than customers and have superior information.
Valseth (2013) shows large dealer order flow impacts price significantly. More larger dealer order flow of government bonds with different maturities has more significant impact on price. Some dealers focus on several type of bond and several bond tenor.
Valseth (2013), Czech et al., (2021) dan El-Shagi & Schweinitz, (2018) find various correlations of customer order flow and interdealer order flow which are strong indication of heterogenous dealer belief and capacity to interpret customer oreder flow and use it as trading
strategy base. However, they also found that customer order flow does not always correlate with order flow in the inter-dealer market for several dealers whose trading activities also have a large effect on prices. This indicates that some dealers have additional information learned from their customer order flows as well as other private information that they collect themselves. The findings indicate that dealers influence price discovery process.
The specific objectives of this research are:
-
1) to test empirically which level of market participants play the most role in price discovery, whether the interdealer market or the customer market
-
2) to test empirically role of dealers in the price discovery process whether each type of government bonds has same or different impact, for many different tenors.
METHOD
The data for this research is obtained from transaction data of government bond from Ministry of Finance of the Republic of Indonesia. Changes in bond yields are obtained from the Indonesian government bond index data obtained from Datastream Thomson-Reuters. This research data is from January 2010 to 2019
Model (1) is used to empirically test of impact aggregate interdealer order flow and aggregate customer order flow on bond yield in the Indonesia government bond market:
-
. dYti = c + β1OFts + β2OFtu + β30⅛ + β4COFt + β3COF*1 + βbCOF[ + et ...... (1)
Where dYt is yield change of bond i from t - 1 to t and i = 3, 5 and 10 years which is remain year until maturity date, O Fβ , OF™ and OFt are short term aggregate interdealer order flow (S), medium term (M) and long term (L). COFβ , COF™ and COFt are aggregate customer order flow short term (S), medium term (M) and long term (L). Separately, the models for the three categories of bond maturity are as follows:
dYt3 = c + βιOFt + β2OF*1 + β3OFt + β4COFts + β-COFF + β6COFt + et (2)
dYt5 = c + βιOFt + β2OFtu + β3OFt + β4COFt + β3COF*1 + β6COFt + et (3)
dYt10 = c + βιOFt + β2OFtu + β3OFt + β4COFt + β3COFtu + β6COFt + et(4)
Regression coefficients in above equations measure impact of each order flow types on daily changes of yields of 3-year, 5-year and 10-year government bond. Short-term order flows are bonds with remaining 12-48 months to maturity. Medium-term order flows are bonds with remaining 49-85 months to maturity. Medium-term order flow are bonds with 86-130 months to maturity. The three types of order flow interdealer maturity are labeled with OFS, OFM and OFL, and the customer order flow are labeled COFS, COFM and COFL.
RESULTS AND DISCUSSION
Table 1 shows that long-term customer order flow (CFOL) has the largest average among all categories of government bond order flow which strengthens the indication of high trading on bonds with long remaining tenors as can be found in Table 1. Order flow from dealers is also the most expensive. there is a lot of long-term order flow (OFL). However, the highest maximum value actually occurs in the short-term customer order flow. This indicates that in bonds with the shortest tenor, there is a large transaction from one customer.
Some bond investors do focus on bond transactions that are nearing maturity because they are targeting payment of principal debt at maturity and supported by stable bond prices towards maturity.
Table 1. Statistic Descriptive of Order flow
|
OFS |
OFM |
OFL |
COFS |
COFM |
COFL | |
|
Mean |
4,093 |
7,689 |
10,704 |
15,299 |
19,828 |
27,459 |
|
Median |
2,000 |
5,000 |
5,000 |
13,000 |
16,000 |
19,000 |
|
Maximum |
42,000 |
84,000 |
161,000 |
641,000 |
180,000 |
259,000 |
|
Minimum |
0,000 |
0,000 |
0,000 |
0,000 |
0,000 |
0,000 |
|
Std. Dev. |
5,213 |
9,220 |
15,534 |
21,693 |
15,882 |
28,257 |
|
Skewness |
2,231 |
2,818 |
3,223 |
20,232 |
2,395 |
2,616 |
|
Kurtosis |
10,376 |
15,119 |
19,349 |
537,673 |
15,188 |
14,132 |
|
Jarque-Bera |
4541,64 |
10920,77 |
18877,74 |
7.574.216 |
10482,37 |
9248,07 |
|
Prob. |
0,000 |
0,000 |
0,000 |
0,000 |
0,000 |
0,000 |
|
Observations |
1467 |
1467 |
1467 |
1467 |
1467 |
1467 |
Source: DJPPR Kemenkeu
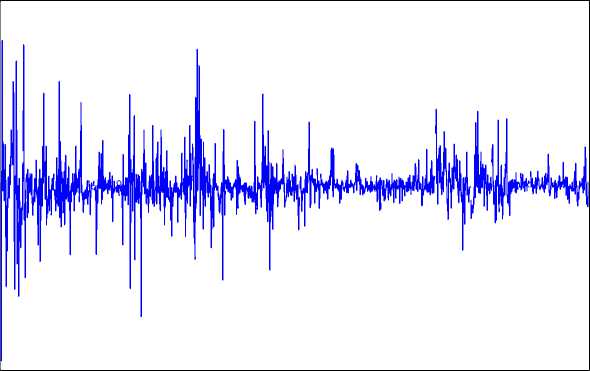
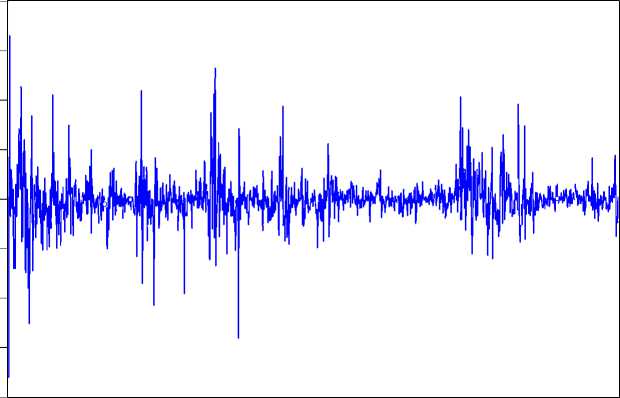
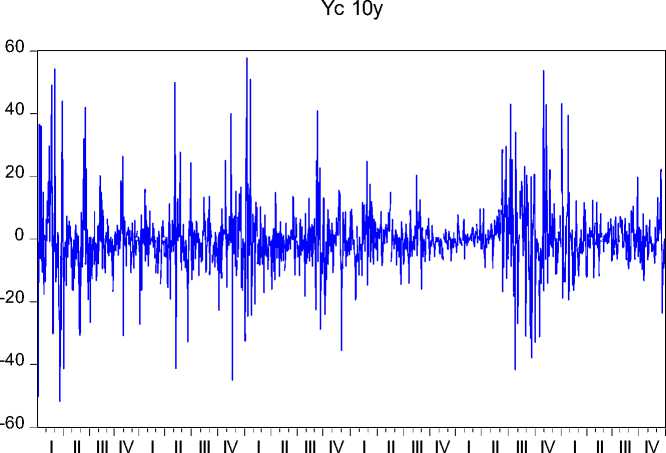
Figure 1, Figure 2 and Figure 3 below show movement of bond yield with 3 year maturity, 5 year maturity, 10 year maturity, respectively.
Yc 3y
80
60
40
20
0
-20
-40
-60
-80
I I I I I I I I I I I I I I I I I I I I I I I I I I I I I I I I I I I I I I I I I I 1 I Il
I II III IV I II III IV I II III IV I II III IV I II III IV I II III IV
2009 2010 2011 2012 2013
2014
Figure 1. 3-year Yield Changes
Based on Figure 1, we can see that in the 3-year yield changes, there was volatility between 2009 and 2011 while after that it was seen to be lower. If we compare it with the 5-year yield change in Figure 2, the volatility is less but there are some points that are almost the same, namely the first month to the second month of 2009, the first month to the second month of 2010, the first month to the second month of 2011 and 2013, but 2013 is relatively more low. In the 10-year yield changes shown in Figure 3, we can see that the volatility is higher than the two categories of shorter maturity periods, however, the highest and lowest
volatility point is the 3-year yield change in 2009. In mid-2013 Until the beginning of 2014 the 10-year bonds were more volatile than other categories of bonds.
Yc 5y
80
60
40
20
0
-
- 20
-
- 40
-
- 60
-
- 80
1 1 I 1 1 I 1 1
I II III IV I II III IV I II III IV I II III IV I II III IV I II III IV
2009 2010 2011
2012 2013
2014
Figure 2. 5-year Yield Changes
2009 2010 2011
2012 2013
2014
Figure 1. 10-year Yield Changes
Short-Term Bond Regression Analysis
Government bonds included in the regression equation in Table 2 below are government bonds with short-term maturities which are bonds with maturities ranging from one year to three years.
Based on the results of the regression analysis presented in Table 3, we can see that OFS only has a significant t statistic (5%) on yield of bond with maturity 3 year (YC-3Y) and other variables have no significant effect. Only short-term dealer order flows from intra dealer trading. However, the probability value (F-Statistic) of 0.002 is smaller than 1%, which means that all order flows, both dealers and customers at all maturities, simultaneously have a significant impact on changes in short-term bond market yields. The regression coefficient show that an increase of 1 unit of dealer order flow will increase the daily yield of short-term government bonds by 01,38 bps. These results indicate that dealers have a significant role in the price discovery process of short term government bond. These results are similar to Czech et al., (2021) and El-Shagi & Schweinitz, (2018).
Table 2. Short-Term Bond Regression Analysis
dY? = c + β1OFts + β2OF^ + β3OF{ + β4 COFts + β5 COFtM + β6 COFtL + et
|
Variable |
Coefficient |
Standard Error |
t-Stat |
Prob. |
|
OFS |
0.138 |
0.072 |
2.295 |
0.022 |
|
OFM |
-0.077 |
0.071 |
-1.091 |
0.276 |
|
OFL |
-0.119 |
0.079 |
-1.483 |
0.139 |
|
COFS |
0.060 |
0.113 |
0.536 |
0.593 |
|
COFM |
0.069 |
0.099 |
0.689 |
0.491 |
|
COFL |
-0.168 |
0.107 |
-1.565 |
0.119 |
|
C |
1.462 |
0.398 |
3.673 |
0.001 |
|
R2 |
0.057 | |||
|
Adjusted R2 |
0.040 | |||
|
F-stat |
3.431 | |||
|
Prob (F-stat) |
0.003 |
Trading in government bonds nearing maturity proved to be driven primarily by dealers. Market prices are influenced by transactions in the interdealer market, even though the value of trading transactions carried out by other groups of investors outside the dealer (which is customer) is much higher than in the interdealer market. This clearly shows that dealers have an advantage of private information over their customers.
Medium Term Bond Regression Analysis
Government bonds that are included in the regression equation in Table 3 below are government bonds with medium-term maturities, namely bonds with maturities ranging from above three years to five years.
Based on regression analysis presented in Table 3, we find only COFS has a significant t stat (5%) on YC_5Y and other variables have no significant effect on changes in bond yields with a medium-term remaining tenor (YC_5Y). This means that only short-term customer order flows contribute to daily yield changes. Simultaneously the probability value (F-Statistic) of 0.189 is greater than which means that both the order flow of dealers and the order flow of short-term customers simultaneously have no effect on changes in the market yield of medium-term bonds. The regression coefficient can show that an increase of 1 customer order flow will increase 0.234 bps daily yield of short-term government bonds. These results show that customers influence price discovery process in the bond market. These results are not
similar to Czech et al., (2021) and El-Shagi & Schweinitz, (2018) who found that the order flow of dealers, not customers, had a significant effect on price discovery of medium term government bond. However, this shows that in the Indonesian government bond market with medium-term maturities, there is a unique empirical fact where customers who trade are informed customers or investors who have short-term private information which is much better than dealers to buy/trade bonds. the government.
Table 3. Medium Term Bond Regression Analysis dY = c + Λ10Fts + HuF- + β30⅛ + β4COFts + ∕⅞ COFtM + β6 COFf + et
|
Standard | |
|
Variable |
Coefficient Error t-Stat Prob. |
|
OFS OFM OFL COFS COFM COFL C |
0.138 0.079 0.879 0.380 0.016 0.076 0.205 0.838 0.044 0.080 0.543 0.588 0.234 0.108 2.179 0.030 -0.089 0.105 -0.849 0.396 -0.173 0.108 -1.602 0.110 1.017 0.430 2.366 0.019 |
|
R2 Adjusted R2 Fstat Prob(Fstat) |
0.025 0.008 1.464 0.189 |
Long-Term Bond Regression Analysis
Government bonds included in the regression equation in Table 4 below are government bonds with long-term maturities, namely bonds with current maturities of more than five years to five and ten years.
Table 4. Long-Term Bond Regression Analysis
dY?0 = c + βι 0Fts + P2OF- + β3 0FtL + β4 COFts + β5COF- + β6COFβ + et
|
Variable |
Coefficient |
Standard Error |
t-Stat |
Prob. |
|
OFS |
-0.114117 |
0.086892 |
-1.313321 |
0.1900 |
|
OFM |
0.084094 |
0.075502 |
1.113796 |
0.2661 |
|
OFL |
0.065218 |
0.078910 |
0.826484 |
0.4091 |
|
COFS |
0.338473 |
0.107806 |
3.139652 |
0.0018 |
|
COFM |
-0.117179 |
0.113117 |
-1.035910 |
0.3010 |
|
COFL |
-0.078122 |
0.105011 |
-0.743941 |
0.4574 |
|
C |
0.713172 |
0.452307 |
1.576745 |
0.1158 |
|
R2 |
0.028279 | |||
|
Adjusted R2 |
0.011331 | |||
|
Fstat |
1.868525 | |||
|
P(Fstat) |
0.107830 |
Table 4 shows only COFS has a significant value (5%) on YC_10Y and other variables have no significant effect on YC_10Y. These results show that only short-term customer order flows contribute to changes in daily yields. Simultaneously the probability value (F-Statistic) of 0.128 is greater than 1% which means that the order flow of dealers and order flows of 185
customers simultaneously affects the change in the yield of the long-term bond market at a level of error slightly above 10%. The regression coefficient shows that an increase of 1 customer order flow will increase the daily yield of short-term government bonds 0.33847 bps.
These results show that customers influence bond price discovery process, but the superiority of customer information is only on short-term information so that only short-term order flows are significant. This result is not in line with Czech et al., (2021), El-Shagi & Schweinitz, (2018) and Valseth (2013) that dealer order flows of government bond market with long-term maturities has a significant impact in price discovery. This shows that in the Indonesia government bond market, for bond with medium and long term maturities, customers have an information advantage over dealers. Customers make transactions for short-term interests only so that short-term order flows are significant. Customers execute short-term transactions in the bond market to exploit their better information of the transitory market liquidity conditions or driven by the incidental needs of cash so that prices change only in short periods. This is in accordance with the condition of the Indonesian government bond market which is relatively less liquid.
The results of the empirical test obtained in this study need to be studied further, whether factors such as herding behavior in the Indonesian government securities market have a significant impact so that investor behavior in the short term has a different pattern than when observed in the longer term. as discovered by Wang & Hu, (2021). The seasonal pattern or seasonality of Indonesian government bond yields needs to be further identified and its influence on the findings of this study because several studies have shown a fairly strong seasonality pattern in the government bond market in several countries, for example Zaremba, (2019), Zaremba & Schabek (2017), and Zaremba & Czapkiewicz (2017). Faktor risiko politik yang mempengaruhi sentimen investor terhadap obligasi pemerintah (Duyvesteyn et al., 2016) and changes in rating due to changing country risk are also important factors that are thought to influence the behavior of dealers and consumers in the Indonesian government bond market which need to be investigated more closely in further research.
CONCLUSION
Order flow simultaneously affects changes in short-term bond yields. Simultaneous order flow has no effect on changes in medium-term bond yields. Simultaneous order flow also has no effect on changes in long-term bond yields.
We conclude that in the Indonesia government bond market, all type of order flow data have significant impact on price formation, where strongest impact come from the short-term dealer order flow and the short-term customer order flow. The regression coefficient of the short-term customer order flow is more influential on price formation than the medium and long-term order flow, this shows that there are informed customers in bond trading. This finding is different from Czech et al., (2021), El-Shagi & Schweinitz, (2018), and (Valseth, 2013) who found dealer order flow over all time frames influenced price. This indicates that in Indonesia government bond market, customers do not only trade based on liquidity considerations but have better information in making decisions or making investment portfolios, especially in the short term.
The Indonesia government bond market, which is relatively less liquid than the bond market in developed countries, has a unique empirical fact, that short-term dealer order flow affects changes in short-term bond yields. This means that dealers have an effect on the formation of short-term bond prices, while on medium-term and long-term bonds are more influenced by customer order flow. This also shows that customers prefer or like to trade or
invest in bonds that have relatively long maturities as long-term investment instruments with a buy and hold strategy.
REFERENCES
Balcilar, M., Usman, O., Gungor, H., Roubaud, D., & Wohar, M. E. (2021). Role of Global, Regional, and Advanced Market Economic Policy Uncertainty on Bond Spreads in Emerging Markets. Economic Modelling, 105576.
https://doi.org/10.1016/j.econmod.2021.105576
Banerjee, A. K., & Pradhan, H. . (2021). Intraday Analysis of Macroeconomic News Surprises, and Asymmetries in Indian Benchmark Bond. Finance Research Letters, February 2020, 102135. https://doi.org/10.1016/j.frl.2021.102135
Czech, R., Huang, S., Lou, D., & Wang, T. (2021). Informed Trading in Government Bond
Markets. Journal of Financial Economics, xxxx.
https://doi.org/10.1016/j.jfineco.2021.05.049
Duyvesteyn, J., Martens, M., & Verwijmeren, P. (2016). Political risk and expected government bond returns. Journal of Empirical Finance, 38(Part A), 498–512. https://doi.org/10.1016/j.jempfin.2016.01.016
El-Shagi, M., & Schweinitz, G. von. (2018). The joint dynamics of sovereign ratings and government bond yields. Journal of Banking and Finance, 97, 198–218.
https://doi.org/10.1016/j.jbankfin.2018.09.004
Guidolin, M., Pedio, M., & Tosi, A. (2021). Time-varying price discovery in sovereign credit markets. Finance Research Letters, 38(November 2019), 101388.
https://doi.org/10.1016/j.frl.2019.101388
Valseth, S. (2013). Price discovery in government bond markets. Journal of Financial
Markets. https://doi.org/10.1016/j.finmar.2012.04.005
Wang, H., & Hu, D. (2021). Heterogeneous beliefs with herding behaviors and asset pricing in two goods world. North American Journal of Economics and Finance, 57(July 2020), 101434. https://doi.org/10.1016/j.najef.2021.101434
Zaremba, A. (2019). Cross-sectional seasonalities in international government bond returns.
Journal of Banking and Finance, 98, 80–94.
https://doi.org/10.1016/j.jbankfin.2018.11.004
Zaremba, A., & Czapkiewicz, A. (2017). The cross section of international government bond returns. Economic Modelling, 66(March), 171–183.
https://doi.org/10.1016/j.econmod.2017.06.011
Zaremba, A., & Schabek, T. (2017). Seasonality in government bond returns and factor premia. Research in International Business and Finance, 41(April), 292–302. https://doi.org/10.1016/j.ribaf.2017.04.036
187
Discussion and feedback