Motivational Factors to Adopt Social Media Technology in Small Medium Enterprises
on
10 Matrik : Jurnal Manajemen, Strategi Bisnis dan Kewirausahaan Vol. 14, No. 1, Februari 2020

P-ISSN : 1978-2853
E-ISSN : 2302-8890
MATRIK: JURNAL MANAJEMEN, STRATEGI BISNIS DAN KEWIRAUSAHAAN
Homepage: https://ojs.unud.ac.id/index.php/jmbk/index
Vol. 14 No. 1, Februari 2020, 10 - 21
Motivational Factors to Adopt Social Media Technology in Small Medium Enterprises
Nuning Setyowati Sumarjo1), Heru Irianto2)
-
1,2 Program Studi Agribisnis, Fakultas Pertanian, Universitas Sebelas Maret, Surakarta, Jawa Tengah
email: noenk_setyo@yahoo.com
MA TRIK : J U RNA L MA NAJ EMEN, S

SINTA 2
DOI : https://doi.org/10.24843/MATRIK:JMBK.2020.v14.i01.p02
ABSTRACT
Social media technologies have become part of the community’s needs, not only as a means to socialize but also to support business operations. In the Asean Economic Society (MEA) era, the demands of the market expansion of business networks become mandatory for employers, including for SMEs. This study aims to analyze the motivational factors of SMEs to use social media technologies to support business activities. This study used survey technique and analysis of Structural Equation Modeling with PLS analysis tools. The results showed that perceived enjoyment has a positive effect on the perceived ease of use of the social media technology, Perceived ease of use has a positive effect toward the perceived usefulness, perceived enjoyment and perceived ease of use have positive effects to attitudes towards the use of social media technology, Perceived usefulness and attitude towards the use of social media technology have positive effects toward the intention of using social media technology.
Keywords: Motivational factor, small medium enterprises, social media technology, technology acceptancemodel
Faktor-Faktor Motivasi yang Mengadopsi Teknologi Media Sosial pada Usaha Kecil dan Menengah
ABSTRAK
Teknologi media social telah menjadi bagian dari kebutuhan hidup masyarakat, tidak hanya sebagai sarana bersosialisasi namun telah merambah sebagai sarana yang efektif dan efisien dalam mendukung operasional bisnis. Memasuki era Masyarakat Ekonomi ASEAN (MEA), tuntutan penetrasi pasar dan perluasan jejaring usaha menjadi sebuah kewajiban bagi pengusaha termasuk bagi Usaha Mikro Kecil Menengah (UMKM). Penelitian ini bertujuan untuk menganalisis faktor motivasional yang memengaruhi UMKM untuk menggunakan teknologi media sosial dalam mendukung kegiatan usahanya. Penelitian ini menggunakan metode survei dan metode analisis Structural Equation Modeling dengan alat analisis Partial Least Square (PLS). Hasil penelitian menunjukkan bahwa: Persepsi kenyamanan berpengaruh positif pada persepsi kemudahan menggunakan teknologi media sosial, Persepsi kemudahan berpengaruh positif pada persepsi kegunaan, Persepsi kenyamanan dan persepsi kemudahan berpengaruh positif pada sikap terhadap penggunaan teknologi sosial media, Persepsi kegunaan berpengaruh positif pada niat menggunakan teknologi sosial media dan Sikap terhadap penggunaan teknologi sosial media berpengaruh positif pada niat menggunakan teknologi sosial media.
Kata kunci: Faktor motivasional, UMKM, teknologi sosial Media, technology acceptance model
INTRODUCTION
Businesses are increasingly using the internet for commercial activities. The ubiquitous nature of the internet and it’s wide global access have made it an extremely effective mode of communication between businesses and customers (Rowley, 2001). Mobile marketing is a set of marketing practices that use wireless mobile technologies and networks to create personalized and interactive communication betweenanorganizationand its target audience, resulting in value creation for both parties (Maduku, 2016).
Internet research becomes an increasingly important tool during the purchasing process; more marketers are seeing the advantages too. It can effectively reach the target customers, faster and less expensive to conduct direct marketing campaigns, measurable, which means that successes are identifiable and repeatable, open 24-hours a day and cost-effective, in the long run (Ruckman, 2012).
Social media is an internet service that supports the effectiveness and efficiency of the business. Social media is a place where consumers can learn
more about their favorite companies and the products they sell. Marketers and retailers are utilizing these sites as another way to reach consumers and provide a new way to shop. “Technology-related developments such as the rise of powerful search engines, advanced mobile devices and interfaces, peer-to-peer communication vehicles, and online social networks have extended marketers’ ability to reach shoppers through new touchpoints” (Shankar et al, 2011).
Strategically, social media is an excellent method to build brand loyalty, establish barriers for competitors and facilitate the dissemination of marketing through consumer testimonials. The key to success is the use of social media to engage consumers in determining personal needs and give consumers the opportunity to enthusiastically participate and listen to the desires of consumers (Assaad and Gomez, 2011).
In Indonesia, the use of technology as social media marketing tools is growing quite rapidly, but the biggest trend of internet utilization is still dominated by large companies. However, the actual use of e-business can also be done by Micro, Small & Medium Enterprises (SMEs) (Agustine, 2007). Kota Surakarta is one area in Central Java, which has great potential for SMEs. Small Medium Enterprises in Surakarta recorded as many as 3710 units with centers among others in District Jebres (940), Kliwon Market (1047), Serengan (594), Banjar Sari (957) and Laweyan (172). Its existence can’t be denied has contributed to reducing unemployment and improving the welfare of society and to support the efforts of empowering communities of Surakarta. However, the facts show that SMEs are still entangled in many problems that arerooted in a lack of competence. The accumulation of problems and inappropriate handlings cause many SMEs to experience adversity. One of them is the mastery of technology-related issues, both in terms of looking for business relationships, marketing (promotion) and the backwardness of the external environment information
Small Medium Enterprises in Surakarta have used social media technologies, although not as much as 56.67% for different types of services. The use of social media at most is for the promotion or advertising of products. Small Medium Enterprises have high perception of the usefulness of social media technologies among others, ability to reach out customers, shorten the distribution chain marketing, reduce paper-based information, and enhance interaction with the consumer and for the sake of promotion. Small Medium Enterprises in
Surakarta perceive constraints in the use of SMT (Social Media Technology) low associated costs and time to access the internet. That is, SMEs consider the actual cost is affordable and internet access time is relatively fast. Another constraint is that SMEs are still not fullyresorting to onlineshopping, and sometimes still choosingto transact physically (Setyowati et al, 2014). Considering this condition, it is necessary to follow up to the level of technology adoption of social media is getting higher, which means that more and more SMEs are adopting social media technologies to support effective business operations.
Information system development is determined by a combination of user acceptance and technological progress. Technology Acceptance Model (TAM) by Davis (1989) is one model that is able to explain and predict user acceptance of information technology. Perceived usefulness and perceived ease of use are two important factors that influence individuals in adopting information technology. The researcher defines Perceived Usefulness as a level where individuals believe that using certain information technology will improve performance. Perceived ease of use is defined as the level at which individuals believe that using certain information technology will be easy and efficient.
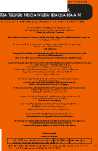
The TAM model has been used to test the acceptance of technology by many researchers and in many different cases. TAM is proven to be valid and reliable in explaining individual attitudes and the use of management information systems (Tero et al, 2004). This study modifies previous research by adding variables perceived enjoymentand perceived the number of users to predict motivational factors of SMEs in Surakarta to adopt social media technology. A perceived number of users can influence the acceptance of technology bychanging the perceived ease of use. The number of users is likely to encourage users to learn about the features or functions of the system to gain direct experience or ask others to guide him. The more time devoted to exchange information, users will feel that it is not difficult to learn to use the technology, and even they will be exchanged with other user perceptions (Luo & Strong, 2000). Based on the results of these studies, this study takes the following hypothesis: H1: Perceived number of users has a direct positive effect on perceived ease of use
Generally, a person engages in an activity because the activity is comfortable and pleasant. Davis et al., (1992) state that Perceived Enjoyment is a condition in which users feel comfortable
intrinsically in the activities of the use of technology. Previous studies revealed significant effects of intrinsic and extrinsic motivation on the intention of using technology (Davis et al., 1992). Intrinsic motivation can be defined as pleasure and satisfaction derived from an activity (Venkatesh, 1999) and extrinsic motivation associated with factors that determine a person to perform a behavior to an end (Venkatesh 2000). Perceived enjoyment reflect intrinsic motivation in the use of technology, prefer the pleasure and satisfaction in doing an activity. Previous studies test the effect on the perceived ease the perceived enjoyment (Yi and Hwang, 2003). The new technology is considered convenient to use, users will find it easy to use. Based on these arguments, the hypothesis is taken as follows: H : Perceived enjoyment has a positive effect on
the perceived ease of use in using socialmedia technology
There is a causal relationship between perceived enjoyment and attitude. When the user feels comfortable using technology then this will be the emergence of pleasure stimuli that would increase the positive perception of the technology. Venkatesh (2000) found that perceived enjoyment indirectly affects users in adopting technology. Other studies have shown that pleasure and satisfaction born of the experience of comfort in using technology Yu et al., (2005). These findings indicate that the convenience of having a strong correlation with a positive attitude technology users. Based on the results of these studies, this study takes the following hypothesis:
H : Comfort perception has a positive influence on theattitudeof MSMEs to socialmedia technology.
Users will assume an increasing usefulness of the technology is happened if the user is getting easier to use (Brown and Licker, 2003; Bruner and Kumar, 2005). Based on the results of these studies, the authors take the hypothesis as follows:
H : Perceived ease of use has a positive effect on the perceived usefulness of social mediatechnology
The simpler (easier) and useful technology for users will increase the intention to use. The greater intention of using it will increase the behavior of the use. Venkatesh and Morris (2000) support the finding that convenience is the determinant of the intention to use the technology. This argument is based on that convenience is more important in determining satisfaction in using the technology. Based on the findingsabove, theauthors takethehypothesis as follows:
H : Perceived enjoyment has a positive effect on the attitude of SMEs to the use of socialmedia technology
Effect of perceived usefulness on the intention to use a technology is associated with instrumental behavior (Davis et al, 1989). Usefulness represents an extrinsic motivation based on the achievement of goals as the primary motivation of individual conduct or use of technology. Attitudes toward the use of a technology predicts an overall evaluation of the tendency for users to adopt the technology (Dabholkar and Bagozzi, 2002). Intention to use influenced by the perception of usefulness and attitude. This relationship has been tested and supported by many previous findings such as Hu et al., (1999); Venkatesh and Davis (2000). Based on the results of these studies, the authors take the hypothesis as follows:
H : Perceived Usefulness has a positive effect on the attitude of SMEs to the use of socialmedia technology
H : Perceived Usefulness has a positive effect on the intention to use social media technology
H : the attitude of SMEs to the use of social media has a positive effect on the intention to use social media technology
This study aims to identify motivational factors that affect SMEs in adopting TSM. identifying the motivating factors to adopt social mediatechnology is necessary so the SMEs in Surakarta are expected to be able to utilize TSM to increase the effectiveness and efficiency of their business activities.
METHODS
BASIC RESEARCH METHODS
This research uses descriptive-analytical method. The descriptive analytical method associated with the collection of data to provide an overview or affirmation of a concept or phenomenon also answer questions regarding the status of the object, such as attitudes or opinions of individuals, organizations and so on. The descriptive analytical method aims to describe systematically and accurately the facts and characteristics of the population or a particular field (Wirartha, 2006)
This study was conducted by surveying respondents, namely the measurement technique used to collect information in a highly structured interview (Cooper and Schindler, 2006), the instrument used was a questionnaire.
Research Location
The method to take the area for research is purposive, ie taking into account the research area with the known reason for the research area. The research area is Surakarta consedering that Surakarta has a considerableamount of SMEs, which are located in 5 sub-centers districts of Jebres (940 SMEs), Market Kliwon (1047 SMEs), Serengan (594 SMEs), Banjar Sari (957 SMEs) and Laweyan (172 SMEs) (Bank Indonesia, 2010).
The Potential of SMEs can be further developed through the increasing adoption of information technology (social media technology) that is expected to increase performance efficiency and the expansion of business networks both to supportthe supply of raw materials, production, and to market SMEs products.
Types and Sources of Data
The data in this study are primary data obtained directly from the source of research (Cooper and Schindller, 2006). Primary data used include the data of motivational factor in adopting social media technologies and data from relevant stakeholders for the research, among others are BAPPEDA
Surakarta, Department of Industry, Trade and SMEs, also SMEs owner representatives in Surakarta. Secondary data were used as the research support in the form of database Surakarta SMEs and the Strategic Plan of Surakarta.
Sampling Method
The population in this study is SMEs in Surakarta. Samples were taken from five districts that becomecenters of SMEs that are Jebres subdistrict, Pasar Kliwon, Serengan, Banjarsari, and Laweyan. The sampling technique used was quota sampling. Quota sampling is a purposive sampling that takes a percentage of the sample in accordance with the percentage of the number in the population (Hartono, 2007). In thisstudysampling(SMEs) adjusted proportion to the number of SMEs per district.
The determination of the number of samples are using a ratio (variable: sample) of 1:20. The number of variables in this study is six variables so that the number of samples taken are as many as 120 samples. This ratio is expected to have met the statistical power of 80 percent (Ghozali, 2006). The proportion of the total sample is presented in Table 1 as follows:
Table 1. Determination of sample number
|
No |
Districts |
Total of SME (units) |
Sample Total (units) |
|
1 |
Banjarsari |
957 |
30 |
|
2 |
Serengan |
594 |
20 |
|
3 |
Laweyan |
172 |
6 |
|
4 |
Pasar kliwon |
1047 |
34 |
|
5 |
Jebres |
940 |
30 |
|
Total |
3710 |
120 |
Source: BPS Surakarta
Data analysis method
This study examined several variables expected to affect the intention of Small Medium Enterprises
to adopt summarized in the research model adopted from (Huang et al) 2006. The research model is presented in Figure 1 as follow :
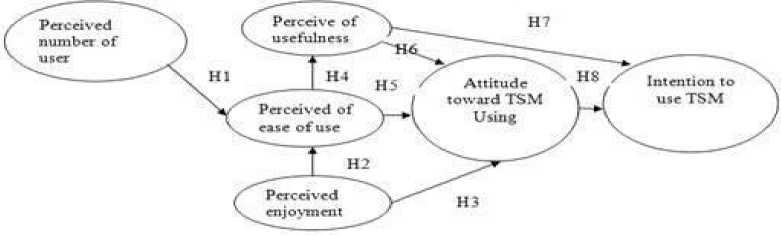
Figure 1: Research model
Operational Definition and Measurement of
Variables
The variables of Perception of User’s adoption (Luo & Strong, 2000) was measured with three items
of questions. The measurement of the perception of usefulness constructs were adopted from Davis (1989) with four items of question. The variable of Perceived Ease measured uses four items adapted
from Davis (1989). Variable Perception Leisure is measured using five items of questions adopted from Tero et al (2004). The variable of Attitudes Toward Using Social Media Technology was measured by four items of questions adapted from Davis (1989 ) and the variable of intention to use Social Media
Technology was measured by four items of questions adapted from Davis (1989). The measurement of variables use a Likert scale where 1 = strongly disagree and 5 = strongly agree.
The operational definition and measurement of variables are presented in Table 2 as follow :
Table 2. Operational Definition and Measurement of Variables In Research
|
Variable |
Definition |
Measurement |
Source |
|
Perceived |
SME perception of a large |
1. Many SMEs’ actors use social media |
(Luo & Strong, |
|
number of Users |
number of SMEs who already use social media technologies that are expected to facilitate SMEs to learn how to use social media technologies |
technology to support the business.
|
2000) |
|
Perceived Usefulness |
SME perception of the usefulness or benefits derived from the use of social media technology |
|
Davis (1989) |
|
Perceived Ease of use |
Perceived ease in using social media technology |
|
Davis (1989) |
|
Perceived |
Feeling comfortable and |
1. I feel happy using social media technology in |
Tero et al |
|
enjoyment |
happy in using social media technology |
business
|
(2004) |
|
Attitude toward Social Media Technology Using |
Positive or negative feelings from SMEs to the behavior of the use of social media technology |
|
Davis (1989) |
|
Intention to Use Social Media Technology |
SMEs desire or intention to u social media technology |
|
Davis (1989) |
Source: Study of literature
Reliability and validity test
Validity test is done associated with convergent validity and discriminant validity. The validity of the questionnaire in this study was measured with Structural Equation Modelling using Partial Least Squares (PLS). The indicator used is the Average Variance Extracted (AVE). The average variance is a measure of the distribution of variance between a construct and indicators, better known as convergent validity. Convergent validity refers to the existence of different instruments that measure the same construct. Convergent validity is met if the constructs have the AVE with a minimumthreshold of 0.5 (Hair et al., 2006).
Reliability is defined as a condition variable that is consistent with what should be measured. The difference with the validity is that the reliability is not related to what should be measured, but how a construct is measured (Hair et al., 2006). This study measures the internal consistency which is a measure of the correlation between items. Internal consistency implies the number of items that measure a construct and interdependence one item to another. Measurement of reliability tests was conducted by using PLS and the indicators used are the composite reliability with a minimum threshold of 0,7. Hair et al., (2006) also stated that constructs reliability should ³ 0.7 to indicate a sufficient convergence or consistency. Partial Least Square (PLS) is used to test the research model. PLS as a model of SEM-based variant is a powerful method of analysis because it is not based on many assumptions and data used should not normally distribute. PLS has the ability to handle the relatively small sample size so that the right choice to test the research model (Ko et al, 2005). PLS also can be used to analyze the good constructs formed with reflective and formative indicators (Ghozali, 2006). PLS recognizes two kinds of components in a causal model, namely:
Measurement Model, the model consists of relationships between the items variable that can be observed with latent constructs measured with these items (Hartono, 2007). To test the measurement model, the testing conducted in stages, ie testing (1) the charge of individual items (item loading), (2) internal consistency (measurement reliability), (3) the construct validity.
Structural Model consisting of latent constructs that can not be observed with ties theory. This test includes estimating path coefficients that identify the strengths of the relationship between
the independent and dependent variables. Testing a structural model is to generate significant value relationship paths between the latent variables using bootstrapping functions.
RESULTS AND DISCUSSION
Validity test
A validity test aims to determine the ability of a measuring instrument in doing measuring function (Sekaran, 2006). In this case, testing the validityof the items in the questionnaire question aims to determine whether the items actually measure the concepts referred to in this research appropriately. In a test of the validity of the provisions of eachitem in question must have a loading factor of ≥ 0, 50 (Santoso, 2012). Factor loading ≥ 0, 50 to be met because it is one of the requirements to be able to analyze the model using PLS. The value of the loading factor is seen from the standardized regression weights. The result of the validity test is presented as Table 3.
Table 3 describes the result of the validity test with some of the items in question. Each item has a loading factor of ≥ 0, 5. Item number 1 perceived number of the user (PJP1) is not included because it has a loading factor ≤ 0, 50.
ReliabilityTest
The reliability test aims to measure the reliability or the internal consistency of a research instrument. The reliability test in PLS was done by using Cronbach Alpha. Ghozali (2011) states that the value of Cronbach Alpha can be said to be reliable if the value ≥ 0, 60. Sekaran (2006) divides the levels of reliability with alpha or r count criteria: 0.8-1.0 (good reliability), 0.6 to 0.799 (acceptable reliability) and ≤ 0,6 (unacceptable reliability).
Of the 120 respondents who tested the validity of the test item only questions that have factor loading ≥ 0,50 tested on reliability test so that the item in the variable of perceived number of users 1 (PJP1) is not included in subsequent analysis. The reliability test results on the model are presented in Table 4.
The reliability test results in table 4 show that the variable of perceived number of users has acceptable reliability because of Cronbach Alpha value of 0. 627. The variable perception of usefulness has good reliability for the Cronbach Alpha value of 0.886. Variable perceived ease had good reliability for the Cronbach Alpha value of 0, 849. The variable
Table 3. The Result of Validity Test
|
Indicator |
Variable |
Estimate | |
|
PJP3 |
<-- |
Perceived Number of Users |
.746 |
|
PJP2 |
<-- |
Perceived Number of Users |
.619 |
|
PKTSM1 |
<-- |
Perceived Usefulness |
.789 |
|
PKTSM2 |
<-- |
Perceived Usefulness |
.826 |
|
PKTSM3 |
<-- |
Perceived Usefulness |
.808 |
|
PKTSM4 |
<-- |
Perceived Usefulness |
.768 |
|
PKTSM5 |
<-- |
Perceived Usefulness |
.731 |
|
PKPTSM5 |
<-- |
Perceived Ease of Use |
.718 |
|
PKPTSM4 |
<-- |
Perceived Ease of Use |
.751 |
|
PKPTSM3 |
<-- |
Perceived Ease of Use |
.651 |
|
PKPTSM2 |
<-- |
Perceived Ease of Use |
.736 |
|
PKPTSM1 |
<-- |
Perceived Ease of Use |
.738 |
|
PK4 |
<-- |
Perceived Enjoyment |
.837 |
|
PK3 |
<-- |
Perceived Enjoyment |
.864 |
|
PK2 |
<-- |
Perceived Enjoyment |
.891 |
|
PK1 |
<-- |
Perceived Enjoyment |
.842 |
|
SPTSM1 |
<-- |
The attitude of Use |
.725 |
|
SPTSM2 |
<-- |
The attitude of Use |
.814 |
|
SPTSM3 |
<-- |
The attitude of Use |
.882 |
|
SPTSM4 |
<-- |
The attitude of Use |
.716 |
|
NMTSM1 |
<-- |
Intention to Use |
.835 |
|
NMTSM2 |
<-- |
Intention to Use |
.851 |
|
NMTSM3 |
<-- |
Intention to Use |
.886 |
|
NMTSM4 |
<-- |
Intention to Use |
.724 |
Source: Primary Data Analysis
perceived enjoyment has good reliability for the Cronbach Alpha value of 0. 918. Variable attitude towards users had good reliability for the Cronbach Alpha value of 0. 856. Variable intention to usehas
good reliability for the Cronbach Alpha value of 0. 895. Overall indicators on each of the variables in the model are good.
Table 4. The Result of Reliability Test
|
Variable |
Cronbach Alpha |
Information |
|
Perceived Number of Users |
0,627 |
acceptable |
|
Perceived Usefullness |
0,886 |
good |
|
Perceived Ease of Use |
0,849 |
good |
|
Perceived Enjoyment |
0,918 |
good |
|
The attitude of Use |
0,856 |
good |
|
Intention to Use |
0,895 |
good |
Source: Primary Data Analysis
Goodness-of-fit Test
According to Wijaya (2009), Index of Goodness of fit is used to measure the degree of conformity between the hypothesized model and the data presented, or in other words a measure of the truth of proposed model. According to Wijaya (2009). Index Goodness of fit is used to measure the degree of conformity between the hypothesized model with the data presented or in other words a measure of truth proposed model. Structural model in PLS is categorized as a good fit if it meet the following requirements:
-
a. Chi-Square Statistic (X2)
The low chi-square value of the degree of freedom shows that the correlation observed with predicted did not differ significantly (real). The expected value is small, and the value of chi-square (x2) is very sensitive to the sample size and is only suitable for sample sizes between 100-200. If more than 200, the chisquare (x2) should be accompanied by other test tools.
-
b. Significance Probability
Minimum Rate required probability level is 0.1 or 0.2 but the probability level of 0.05 is still allowed.
-
c. Normed Chi-Square (CMIN/DF)
CMIN / DF is the allowed values of the distribution of the chi-square value of the degree of freedom. This index measures the relationship of goodness - of- fit model by the number of estimated coefficients are expected to reach the level of conformity. The expected value is less than 2 or 3.
-
d. Root Mean Square Error of Approximation (RMSEA)
RMSEA value less than or equal to 0.08 is an index for the inadmissibility of the models showing a close fit of the model was based on degree of freedom. RMSEA is an index measurement that is not affected by the size of the sample so that the index is used to measure the fit model on a large number of samples
-
e. The goodness of Fit Index (GFI)
This index reflects the overall level of fitness model calculated from the predicted residual
quadratic models compared to actual data. GFI is said to be a good with the value of ≥ 0, 90.
-
f. Adjusted GFI (AGFI)
AGFI is a development of GFI adjusted for the degree of freedom provided fatherly welcome to test whether the model. The acceptance rate is recommended when having a value equal to or greater than 0.90.
-
g. Tucker-Lewis Index (TLI)
TLI is an alternative incremental fit index that compares a model that is tested against a baseline model. The recommended value as a reference for the adoption of a model is greater than or equal to 0.9
-
h. Comparative Fit Index (CFI)
CFI is incremental suitability indices which also compared to the models tested with null models. This index is said to be good to gauge the suitability of a model because it is not affected by sample size. The recommended value as a reference for the adoption of a model is greater than or equal to 0. 9. The
Comparative Fit Index is presented in Table5:
Table 5. Comparative Fit Index
|
No |
Index |
Reference Value |
Result | |
|
1 |
X2 chi-square |
expected to be small |
584,739 |
……. |
|
2 |
Prob |
≥0,05 |
0,000 |
Bad |
|
3 |
RMSEA |
≤0,08 |
0,097 |
Moderate |
|
4 |
GFI |
≥0,90 |
0,752 |
Moderate |
|
5 |
AGFI |
≥0,90 |
0,694 |
Moderate |
|
6 |
CMIN/DF |
≤2,0/≤3,0 |
2,406 |
Good |
|
7 |
TLI |
≥0,95 |
0,842 |
Moderate |
|
8 |
CFI |
≥0,95 |
0,861 |
Moderate |
Source: Primary Data Analysis
Table 5 explains that the chi-square was worth 584.739 and the probability is 0,000 less than 0.05, the indications are bad. Thus there is a difference between empirical data obtained with the theory that has been built. Value RMSEA (Root Mean Aquate the Error of Approximation) amounted to 0.097 indicating of moderate value. Value of GFI (Goodness-of-fit index) of 0.752 Indicating of moderate value. Value AGFI (Adjusted Goodness-of-fit index) of 0.694 indications are moderate. Value CMIN / DF of 2.406 show a good indication. Value TLI (Trucker Lewis Index) of 0.842 indications are moderate and the value of CFI (Comparative Fit Index) of 0.861 showing the indicationof moderate. The overall measurement of the goodness-of-fit, indicates that the model proposed in the study of
Technology Utilization of Social Media in Supporting Development of E-business in SMEs in Surakarta can not fully describe the existing situation in the field because many criteria for goodness-of-fit is unfulfilled
HYPOTHESIS TEST
After the test of criteria of goodness-of-fit are estimated, the next step is an analysis of the structural relationships model (hypothesis testing). A relation between variables in the hypothesis is indicated by the regressions weights.
The Results of Regression Weights in PLS is presented in Picture 1 and Table 6 :
Picture 1. Result of PLS Analysis
Table 6. Results of Regression Weights Using PLS
|
Variable |
P | ||
|
Perceived of Ease |
<-- |
Perceived of the number of users |
.168 |
|
Perceived of Ease |
<-- |
Perceived enjoyment |
*** |
|
The attitude of Use |
<-- |
Perceived enjoyment |
*** |
|
Perceived of usefulness |
<-- |
Perceived of Ease |
*** |
|
The attitude of Usefulness |
<-- |
Perceived of Ease |
*** |
|
The attitude of Usefulness |
<-- |
Perceived usefulness |
.247 |
|
Intention to Usefulness |
<-- |
Perceived usefulness |
*** |
|
Intention to Usefulness |
<-- |
Attitude of Usefulness |
*** |
Source: Primary Data Analysis
Description: *** significant at the 1% level
The relationship between the Perceived of the number of users toward the perceived ease of use
Results of PLS analysis showed there is a positive influence of perceived of the number of users toward the perceived ease of use at the significant level of 0.168 so hypotheses 1 is accepted.
This study proved that the number of users of social media technologies in SMEs Surakarta might encourage others to learn about the features or functions of the system to gain direct experience or ask another user to guide him. The more time devoted to exchange information users will increasingly feel that it is not difficult to learn to use the technology and even the Perceived they would exchange with other users (Luo and Strong, 2000).
Relations of the Perceived enjoyment toward Perceived ease of use
The results of the analysis show that there is a positive effect between perceivedenjoyment toward the perceived ease of use of social technologies at a significant level of 1% (α = 0.01) so that the second hypothesis is accepted.
Generally, a personwill engageinanactivitybecause the activity is comfortable and enjoyable. The SME’s Surakarta feels comfortable in using social media technologies made possible by social media technology offers many features that help in improving the performance and provides many benefits for the wearer. According to Davis et al. (1992), perceived enjoyment is a conditioninwhichtheuser feelscomfortable intrinsically in the activities of the use of technology.
Relations of the Perceived enjoyment toward attitudes toward the use of social media technology Results of PLS analysis show that there is a positive influence between Perceived enjoyment toward the attitude toward social media technology using at a significant level of 1% (α = 0.01) so that the third hypothesis is accepted.
The businesses of SMEs Surakarta consider that there is a sense of comfort in using social media technologies that will affect the attitude of the business actors. When the user feels comfortable using social media technology, this will be the emergence of pleasure stimuli that would increase the positive Perceived of the technology. Venkatesh (2000), found that the Perceived enjoyment indirectly affects users in the adoption of technology.
Relations of the Perceived ease of use toward the Perceived usefulness
Results of the analysis showed there is positive influence between the Perceived ease of use toward perceived of the usefulness of social media technology at a significant level of 1% (α = 0.01), so the hypothesis 4 is accepted.
The businesses of SMEs Surakarta consider that technology will be more useful/helpful if users are increasingly easy to use. Moreover, the perpetrators of MSME Surakarta assume that the convenience of using social media technology will increase the intensity in the use for business purposes so that it indirectly will increase profits in the SMEs business actors.
Relations between Perceived Ease of Use to attitudes toward technology social media use Results of the analysis show that there is a positive influence between Perceived ease of use to the attitude toward technology social media using at a significant level of 1% (α = 0.01) so that the five hypotheses are accepted.
There is a positive and significant influence between perceived ease with attitudes towards the use of social media technologies shows that the perpetrators of SME Surakarta consider that the ease of use of social media technologies influences the attitudes of businesses in using social media technologies to support business activity in the SMEs. This is consistent with the theory developed by Davis (1989) that the perceived ease will affect the attitude of use. Technology social media has now become the media used by businesses as a means to expand the marketing network so that the ease of use of social media technologies will affect the
positive attitude of the businesses in using social media technology.
Relations of perceived usefulness toward the attitudes toward social media technology using Results of PLS analysis showed that there is a negative influence between perceived usefulness to attitudes toward social media technology using at a significant level of 0.247, so hypothesis 6 is not acceptable.
The negative influence between perceptions of the user against the attitude of the use of social media technology means that the perception of usefulness is inversely proportional to the attitude of the use of social media technology. Perceptions of business operators increasingly high against the use of social media technologies will increase the attitude of businesses in using social media technology.
Relations of perceived usefulness toward intention to use social media technology
Results of PLS analysis showed that there is a positive influence between perceived usefulness toward intention to use social media technology at a significant level of 1% ( α = 0.01), so the hypothesis 7 is received.
The benefit or usefulness of social media technology make the business of SMEs of Surakarta want to adopt social media technologies in their business activities such as marketing products, facilitate sales transactions, just looking for information or to promote products. This is consistent with the theory of technology acceptance model (TAM) in which intention to use a system or technology that is influenced by perceptions of the usefulness and attitude. This relationship has been tested by Venkatesh and Davis (2000).
Relations of attitude towards the intention to use social media technology
Results of PLS analysis showed that there is a positive influence between attitudes toward intention to use social media technology at a significant level of 1% (α = 0.01), so the hypothesis 8 is received.
The positive influence between the attitudes of using technology social media against the intention to use : is consistent with the research conducted by Gardner and Amoroso (2004). The businesses of SMEs Surakarta consider that the attitude of the business actors in assessing the use of technology is directly proportional to the decision in using social media technology for business purposes.
CONCLUSIONS
The results of the study support several hypotheses, among others: perceived of the number of users has a positive effect on the perceived ease of use. Perceived enjoyment has a positive effect on the perceived ease of use. Perceived ease of use has a positive effect on perceived usefulness. Perceived enjoyment has a positive effect on the attitude Toward the use of social media technology. Perceived ease of use has a positive effect on the attitude toward the use of technology social media. perceived usefulness toward intention to use social media technology. Attitudes toward intention to use social media technology. The results of this research did not support the hypothesis that perceived usefulness influences the attitudes toward social media technology use.
Recommendations for strategies to increase the motivation of SMEs in Surakarta in adopting TSM include: Improving the Quality of SMEs Products to increase self-confidence in competing on the online market, increasing IT capabilities for SMEs, facilitating infrastructure (internet access/hotspots), facilitating the legal status of SMEs, developing business center as a medium for sharing information and experience in implementing business online and building partnerships with banks/online transaction or security guarantor institutions.
REFERENCES
Agustine Eva M.S. 2007. Perception Application Usage Internet Marketing For Small and Medium Enterprises. National Seminar on Information Technology Application 2007 (SNATI 2007) ISSN: 1907-5022. Yogyakarta, 16 Juni 2007.
Assaad, Waad and Gomez, J.Marx. 2011. International Journal of Managing Public Sector Information and Communication Technologies (IJMPICT). (2) 1, September 2011.
Brown, I. and Licker, P. 2003. “Exploring differences in internet adoption and usage between historically advantaged and disadvantaged groups in South Africa”. Journal of Global Information Technology Management, (6) 4:6-26.
Bruner, G.C. II, and Kumar, A. 2005. “Explaining consumer acceptance of handheld internet devices”, Journal of Business Research, (58) 5:553-8.
Cooper, Donald R. dan Schindler, P. (2006). Business Research Methods. 9th ed. Singapore: McGraw-Hill.
Dabholkar, P.A. and Bagozzi, R.P. 2002. “An attitudinal model of technology-based selfservice: moderating effects of consumer traits and situational factors”. Journal of the Academy of Marketing Science, (30)3:184-201.
Davis, F.D. 1989. Perceived Usefulness, Perceived Ease of Use, and User Acceptance of Information Technology. MIS Quarterly, 13(5):319-339.
Davis, F.D., Bagozzi, R.P. and Warshaw, P.R. 1992. “Extrinsic and intrinsic motivation to use computers in the workplace”. Journal of Applied Social Psychology, (22)14:1111-32.
Ghozali, I. (2006). Analisis Multivariate Dengan program SPSS,3th ed, Semarang, Badan Penerbit Universitas Diponegoro.
Hair, et al., (2006), Multivariate Data Analysis: Six Edition, Pearson International Edition.
Hartono, J.M. (2007). Behaviour Information Sistem. Yogyakarta: Andi Offset.
Hu, L. and Bentler, P.M. 1999. “Cutoff criteria for ût indexes in covariance structure analysis: conventional criteria versus new alternatives”. Structural Equation Modeling, (6)1: 1-55.
Huang, Jen-Hung; Lin, Yu-Ru and Chuang, Shu-Ting, 2006. Elucidating user behavior of mobile learning Aperspective of the extended technology acceptance model. The Electronic Library, (25) 5:585-598
Rowley, J. 2001. “Remodelingmarketingcommunications in an Internet environment”. Internet Research, Electronic Networking: Applications and Policy,(11) 3:203-212.
Ko, D.G, Laurie J. Kirsch, William R. King. 2005. Antecedents Of Knowledge Transfer From Consultants To Clients In Enterprise System Implementations. MIS Quarterly, (29:1). 59-e5
Lou, H., Luo, W., and Strong. 2001. Perceived critical mass effect on groupware acceptance. European Journal of Information Sistem,(9) 2:91-103
Maduku, D. K. (2016). Determinant of mobile marketing adoption among South African SMEs unpublished doctoral thesis. Johannesburg: University of Johannesburg.
R. R. Ruckman. http:// www. imgrind. com/ 10-advantages-of-internet-marketing/10Advantages Of Internet Marketing, (2012) January 19.
Santoso, S. (2012). Panduan Lengkap SPSS Versi 20. Jakarta: PT Alex Media Komputindo.
Sekaran, U. (2006). Research Methods for Business, Edisi 4, Buku 2, Jakarta: Salemba Empat.
Setyowati, N., Sulistyo, M.E . 2014. Study on the Implementation of E-Business Measures for
Micro and Small Medium Enterpheses. Jurnal Bisnis & manajemen, (15) 1:43-49 UNPAD. 2442 – 4617.
Shankar, V., Murali M., Jeffrey I., Eileen K., Ross R., 2011. Innovations in Shopper Marketing: Current Insights and Future Research Issues. Journal of Retailing 87(1): 29-42.
Tero Pikkarainen, Kari Pikkarainen, Heikki Karjaluoto and Seppo Pahnila. 2004. Consumer acceptance of online banking: An extension of the technology acceptance model. Internet Research (14)3:224–235.
Venkatesh, V. 1999. Creatingfavorableuser perceptions: Exploring the role of intrinsic motivation. MIS Quarterly, (23)2:239-260.
Venkatesh, V. 2000. “Determinants of perceived ease of use: integrating control, intrinsicmotivation, and emotion into the technology acceptance model”. Information Systems Research, (11) 4:342-65.
Venkatesh, V dan Morris, M.G. 2000. Why don’t men ever stop to ask for direction; gender, social influence and their role in technology acceptance and usage behavior? MIS Quarterly, (24)1:115-139.
Wijaya, Tony. (2009). Analisis Data Penelitian menggunakan SPSS. Yogyakarta: Universitas Atmajaya.
Wirartha, M. (2006). Economic Socio Research Method. Andi Offset. Yogyakarta.
Yi, M.Y. and Hwang, Y. 2003. “Predicting the use of web-based information systems: self-efûcacy, enjoyment, learning goal orientation, and the technology acceptance model”. International Journal of Human-Computer Studies, (59)
431-49.
Yu, J., Ha, I., Choi, M. and Rho, J. (2005). “Extending the TAM for a t-commerce”. Information & Management, (42) 7:965-76.
Discussion and feedback