The Determinants of Customers’ Loyalities of Smartphone
on
Jurnal Matematika Vol. 5 No.2, Desember 2015. ISSN: 1693-1394
The Determinants of Customers’ Loyalities of Smartphone
I Putu Eka N. Kencana
Tourism Research Consortium – Ministry of Research, Technology, and Higher Education Republic of Indonesia e-mail: i.putu.enk@gmail.com
Gede Satria Suputra
Department of Mathematics, Faculty of Mathematics and Natural Sciences, Udayana University e-mail: satriasuputra10@gmail.com
Abstract: This research aimed to study the effect of brand image, users’ expectation, and users’ satisfaction as the determinants for users’ loyalties of Samsung Smartphone by applying Partial Least Square–Structural Equation Modeling (PLS-SEM) method. Data gathered from 100 Samsung smartphone users at Denpasar, Indonesia were collected using questionnaires with 5 Likert’s scales during February–May 2015. The results showed users’ loyalties was significantly affected by image of Samsung and users’ expectation. The path coefficients for these causal relationships were 0.533 and -0.230 respectively, demonstrated images’ effect very dominant in forming users’ loyalties. In addition, products’ image significantly affect users’ satisfaction, but user’s satisfaction did not significantly affect users’ loyalties. The final model had Goodness-of-Fit (GoF) index as much as 0.495 shows the model was sufficient to use for elaborating the relationship between contracts.
Keywords: customers survey, PLS-SEM, smartphone, structural model.
Users’ satisfaction and loyalty are two important concepts in marketing and management practice. Producers of products and/or services have to understand their customers in order to gain advantages over their competitors. In common, customer satisfaction index (CSI) model is used to know the user’s perception regarding products or services had been consumed. According to Fornell [4], the CSI model is based on well-established theories in consumer behavior, customer satisfaction, and quality of products and/or services. This model has been applied in many countries for years although some minor modifications had been made according to national cultures differences. In our research, we applied modified European Customer Satisfaction
Index (ECSI) to model determinant factors of Samsung Smartphone’s users that affect users’ loyalties.
In accordance with revolutionary information and communication technology development, Internet and its infrastructure has been positioned as ‘a must technology’ for most countries around the world to support their national development. Very recently, the development of social media infrastructure had significant effect in changing the way of people to communicate. Very current research that is aimed to predict the average allocation time of young people in Indonesia in using social media such as Facebook, WhatApp, etc. to communicate, showed they used about 3 – 4 hours daily to make social relationship.
In order to know the causal relationship between users’ satisfaction as exogenous latent variable toward users’ loyalties as endogenous latent is a difficult task. This is caused by both variables are latent which cannot measured directly. Latent variables can be measured only by observing their indicator’s values. This work is aimed to study the relationship between products’ image and users’ satisfaction were positioned as exogenous latent variables and users’ loyalties as endogenous latent. This causal relationship is mediated and moderated by users’ satisfaction.
There are many models were developed to explain customer satisfaction in marketing discussion. One of these models is European Customer Satisfaction Index (ECSI). According to Bayol et al. [1], ECSI is an economic indicator that measure user’ satisfaction, and it is an adaptation of the Swedish Customer Satisfaction Barometer (Fornell [4]) and also is compatible with ACSI or American Customer Satisfaction Index.
ECSI model basically consists of two sub-model (Bayol et al. [1]), i.e. a core model that utilize the traditional latent variables such as perceived quality and value, user expectation, satisfaction, and loyalty; and an additional (optional) model that can be added by national committee such as products/service image and complaint constructs. Because of one cannot directly measures each of latent variables in ECSI model, a set of indicator have to develop for each of constructs? An ECSI model can be depicted as below:
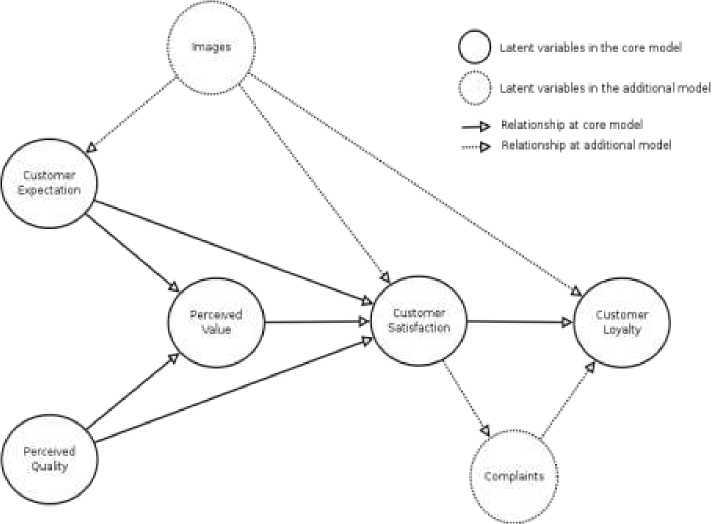
Figure 1. Complete ECSI Model Adapted from Bayol et al. [1]
Structural Equation Modeling (SEM) can be grouped into multivariate statistical analysis which is defined by Hair et al. ([7], p.2) as “the application of statistical methods that simultaneously analyze multiple variables”. Contrary to the first-generation techniques that are often used by social scientists before 1980s (Fornell [5]), SEM is belonged to second-generation techniques. The first-generation techniques applied multidimensional scaling, cluster analysis, exploratory factor analysis, logistic and multiple regression, and analysis of variance, and second-generation techniques applied confirmatory factor analysis and SEM.
Refers to Hox and Bechger [10], SEM is a very general statistical modeling technique and widely used in behavioral sciences. SEM can be viewed as a combination of classical factor analysis with regression or path analysis. In recent years, application of SEM in many disciplines, especially in marketing and behavioral researches, are very intensive. Its popularity arises from SEM’s capabilities to test concepts and theories, completely (Ringdon [14]). Basically, SEM has two sub-models, i.e. (a) outer or measurement model, and (b) inner or structural model. In outer model researcher has opportunity to assess the relationships between latent and its respective items or indicators, while in inner model it is possible to test relationships between latent variables on theoretical level (Hair et al. [9])
In accordance with two sub-models in SEM, researcher tends to focus more on inner model and less attention on outer or measurement model. According to Petter et al., ([13], p.624) researcher tends undifferentiated formative construct with reflective construct and assume both types should be treated alike regardless of construct’s type. Unlike reflective construct where a change in the construct will affects its indicators, formative construct works in a different way: a change in constructs’ indicators will affect the underlying construct (Jarvis et al. [11]). In brief, determining correctly measurement model as well as estimation on inner model parameters is crucial in applying SEM.
Regarding to its approach, SEM is divided into two types namely covariancebased SEM (CB-SEM) and variance-based or partial least squares SEM (PLS-SEM). CB-SEM is primarily used to confirm (or reject) the underlying theories by determining how well a theoretical model can estimate the covariance of data matrix. In contrary, PLS-SEM is primarily concerned with development of theories by focusing on explaining the variance when of the model. For instance, Linear Structure Relationship (LISREL) and Analysis of Moment Structure (AMOS) are well-known statistical software classified for analyzing CB-SEM while SmartPLS is an example to analyze PLS-SEM.
As an emerge technique to analyze the relationships between latent variables, four critical issues have to considered while applying PLS-SEM (Chin [2]; Hair et al. [9]; Hair et al.[7]) i.e.: (a) the data; (b) properties of model; (c) PLS-SEM algorithm; and (d) evaluation issues. The readers who are interested in these issues are suggested to read more on work by Hair et al. [8]. Contrary to CB-SEM, PLS-SEM works efficiently with small sample size, complex model including hierarchical constructs, and no assumptions about underlying data distribution. Despite of these advantages of PLS-SEM, this technique also has some limitations (Hair et al. [7], p.18; Hair et al. [6]), namely:
-
a) PLS-SEM cannot be used when structural models involve correlational relationships between latent variables. PLS-SEM only handle non-recursive structural models, and;
-
b) Noting this technique is classified in non-parametrical method, PLS-SEM does not have adequate goodness-of-fit (GoF) measure.
In accordance with research’s aims, an instrument was developed by referring previous works to identify items for each of latent variables involved in the structural model. Prior to use for data collecting, a pilot study was conducted to know the reliability of each construct and validities of its indicators. The instrument is design by implementing five level Likert’s scales where 1 represents the most negative and 5 represent the most positive respondent’s perception.
During February–May 2015, 100 people who bought Samsung smartphone at some cellular shops at Denpasar were randomly chosen as respondents of this work. The buyer’s criteria so that he/she could be included as respondents are: (a) his/her ages at least 18 years olds; (b) he/she has been using smartphone for at least 1 year; and (c) he/she agrees to participate in this work.
We applied quantitative approach in this work. To answer research questions, we built structural model based-on the ECSI model. The conceptual model can be illustrated as depicted on Fig.1 with research hypotheses are:
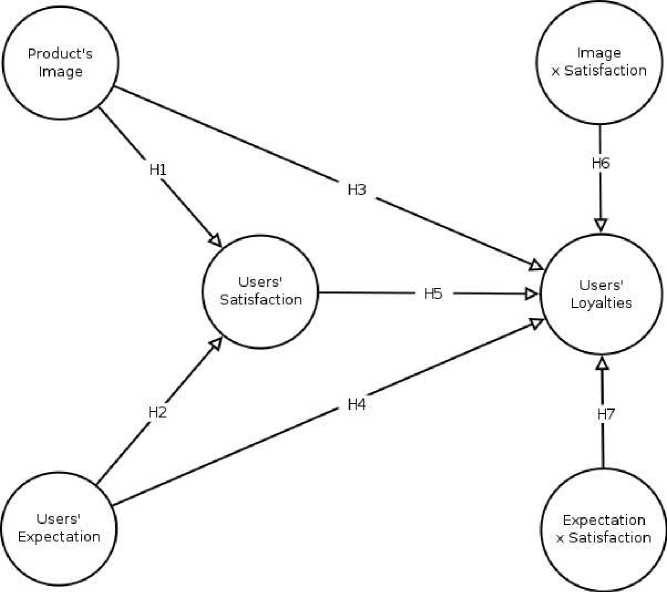
Figure 2. Conceptual Research Model
H1 : image of Samsung smartphone affects users’ satisfaction;
H2 : users’ expectation affects user’ satisfaction;
H3 : image of Samsung smartphone directly affects users’ loyalties;
H4 : users’ expectation directly affects users’ loyalties;
H5 : users’ satisfaction affects users’ loyalties;
H6: users’ satisfaction moderates product’s image to affects users’ loyalties, and;
H7 : users’ satisfaction moderates expectation to affects users’ loyalties.
Constructs’ reliability and corresponding items’ validities were assessed by observing Cronbach’s alpha coefficients (α) and total-item correlations (Corr). An item or indicator is assumed valid to reflect its construct if its Corr is greater than 0.3 (Churchill [3]). In addition, α’s has to be greater than 0.6 as suggested by Hair et al. [6]. Table 1 shows these values resulted from our pilot study:
Table 1. Quality Measurement for Instrument
|
Latent Variable |
Item |
Corr |
|
PIM1 |
Design of Samsung smartphone |
0.728 | |
|
Product’ |
PIM2 |
Samsung’s features meet user’s need |
0.620 |
|
Image |
PIM3 |
Affordable price |
0.483 |
|
α = 0.766 |
PIM4 |
Product is up-to-date |
0.080 |
|
PIM5 |
Samsung is first brand to mention |
0.779 | |
|
Users’ Expectation α = 0.716 |
EXP1 |
Better customer support |
0.645 |
|
EXP2 |
Operating system can be upgraded easily |
0.550 | |
|
EXP3 |
Trust to producer |
0.467 |
|
Latent Variable |
Item |
Corr |
|
Users’ |
SAT1 Satisfied for its quality |
0.493 |
|
Satisfaction |
SAT2 Satisfied for its |
0.461 |
|
α = 0.691 |
popularity | |
|
SAT3 Pride to use |
0.589 | |
|
Users’ Loyalty α = 0.781 |
LOY1 Loyalty to buy |
0.843 |
|
LOY2 Loyalty to use |
0.580 | |
|
LOY3 Intention to |
0.481 | |
|
recommend | ||
|
Source: Primary data (2016) | ||
Observing the values are listed on Table 1, one out from five items in product’ image latent variable has total-item correlation below 0.3 as the threshold value. Noting by elimination of this item as an indicator for this latent will increase the alpha coefficient
from 0.766 to 0.824; we decided to remove PM4 in subsequent analysis. For another three latent variables, all of the alpha coefficients are greater than 0.6 and none of their respective indicators has correlation value below the threshold. Referring to these results, we conclude our instrument reliable to use for data collecting.
The instrument that was proven reliable is administered. From 105 questionnaires were distributed, we found five questionnaires did not completely fulfilled and were dropped from the analysis. The remaining data showed 64 percent respondents are male; 45 percent were aged between 18 and 30 years old, 32 percent of respondents’ age between 31 and 40 years old, and the rest have ages over 40 years old. In addition, we found 35 percent of respondents are high school or undergraduate students while most of the respondents are employees (self-employee or public employee).
To validate the hypotheses, we applied PLS-SEM in this research and SmartPLS 3.0 (Ringle et al. [15]) is used as modeling software. The final operational model in our research can be drawn as depicted on Fig. 3. Before the relationships between latent variables are analyzed, measurement quality at indicator level has to be done. According to Hair et al. [6] and Hox & Bechger [10], outer model analysis is conducted to assess latent variables in terms of their indicators. Typically, at the construct level its convergent validity is assessed by examining the average variance extracted (AVE) values and at the indicator level is assessed by evaluating its outer loading (for reflective indicator) or its outer weight (for formative indicator). A latent variable achieves convergent validity if its AVE greater than 0.50 (Peng & Lai [12]) and an item has outer (loading or weight) greater than 0.60 (Hair et al. [6]) and significant (Peng & Lai [12]). Table 2 lists outer loadings, p-values, AVEs, and composite reliabilities (CRs) for latent variables in the model:
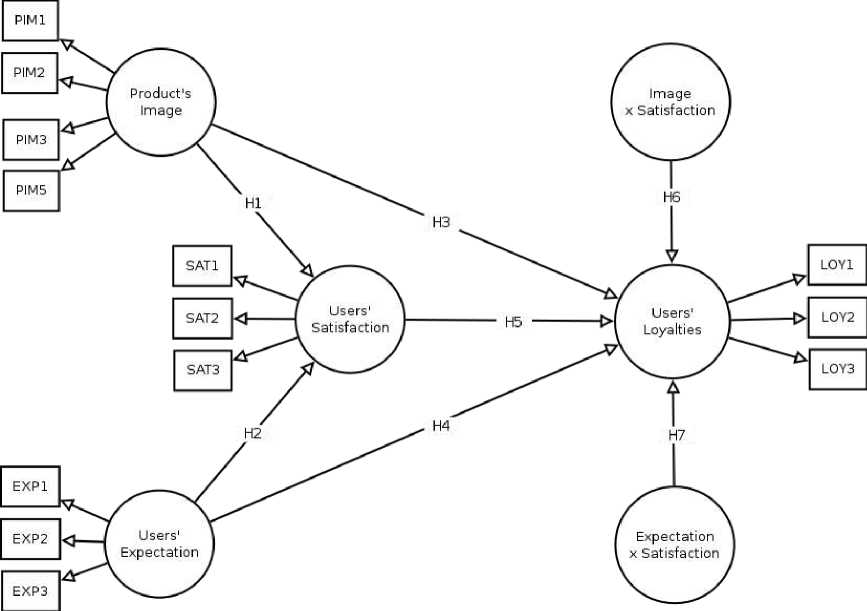
Figure 3. Final Operational Model
Table 2. Quality Measurement for Outer Model
|
Latent Variable |
AVE |
Outer | |||
|
CR |
Item |
Loadin g |
p-value | ||
|
PIM1 |
0.398 |
0.000 | |||
|
Product’ Images |
0.430 |
0.735 |
PIM2 PIM3 |
0.640 0.573 |
0.000 0.000 |
|
PIM5 |
0.907 |
0.000 | |||
|
Users’ |
EXP1 |
0.699 |
0.000 | ||
|
Expec- |
0.496 |
0.695 |
EXP2 |
0.985 |
0.000 |
|
tation |
EXP3 |
0.173 |
0.613ns | ||
|
Latent Variable |
AVE |
CR |
Item |
Outer Loading |
p-value |
|
Users’ |
SAT1 |
0.748 |
0.000 | ||
|
Satis- |
0.547 |
0.784 |
SAT2 |
0.733 |
0.000 |
|
faction |
SAT3 |
0.738 |
0.000 | ||
|
LOY1 |
0.911 |
0.000 | |||
|
Users’ Loyalty |
0.690 |
0.869 |
LOY2 |
0.715 |
0.000 |
|
LOY3 |
0.855 |
0.000 |
Source: Analyzed from primary data (2016)
The outer measurement for product’ images shows PIM1 (design of Samsung smartphone is nice) has outer loading values far beyond threshold value 0.60 although it was significant. Same condition applies for EXP3 (trust to producer) as an indicator for users’ expectation. In addition, both latent have AVEs less than 0.50 as suggested. Noting these findings, we decided to exclude PIM1 and EXP3, and model with
remaining indicators is re-analyzed. Quality measurement for final outer model is listed on Table 3:
Table 3. Quality Measurement for Final Outer Model
|
Latent Variable |
AVE |
CR |
Item |
Outer Loading |
p-value |
Latent Variable |
AVE |
CR |
Item |
Outer Loading |
p-value |
|
Product’ Images |
PIM2 |
0.703 |
0.000 |
Users’ |
SAT1 |
0.762 |
0.000 | ||||
|
0.532 |
0.766 |
PIM3 |
0.537 |
0.000 |
Satis- |
0.547 |
0.783 |
SAT2 |
0.720 |
0.000 | |
|
PIM5 |
0.902 |
0.000 |
faction |
SAT3 |
0.736 |
0.000 | |||||
|
Users’ |
0.724 |
0.835 |
EXP1 |
0.684 |
0.000 |
LOY1 |
0.909 |
0.000 | |||
|
Expectation |
EXP2 |
0.990 |
0.000 |
Users’ Loyalty |
0.691 |
0.869 |
LOY2 |
0.724 |
0.000 | ||
|
Source: Analyzed from primary data (2016) |
LOY3 |
0.850 |
0.000 | ||||||||
Although the analysis showed PIM3 has loading values slightly less than 0.6 as suggested, noting this p-value is significant and the AVE’s value for product’ images is greater than 0.50 then we concluded this latent variable achieves good convergent validity at the item level. In addition, CR’s value for this construct as much as 0.766 is greater than 0.60 proves it has good internal consistency (Peng & Lai [12]). The same facts also found on the other latent variables; none of its indicator insignificant and all of the AVEs and CRs are greater than 0.50 and 0.60, respectively. From these findings, we concluded our model has sufficient convergent validity and construct reliability and an inner model analysis is worth to be conducted.
As mentioned by Hair et al. [6], the goal of inner model analysis is to assess the relationships between latent variables. We represented these relationships through hypotheses as described above. Due to free-distribution of variance assumption in PLS-SEM, non-parametric technique is applied to assess the inner model. In doing this, we applied bootstrapping procedure in SmartPLS and set this to run with 500 subsamples and no sign changed in resamples as the recommended choice when running bootstrap procedure (Ringle et al. [15]). To assess the inner model, we follow guideline from Hair et al. [9] who stated to check the R2s of each endogenous latent, the goodness-of-fit, and the significance of path values. Table 4 listed the R2s values, AVEs, and number of indicators of users’ satisfaction and loyalties as two endogenous latent in our model.
|
Table 4. Quality Measurement for Inner Model | |||
|
Endogenous Latent |
Number of items |
R2 |
AVE |
|
Users’ satisfaction |
3 |
0.121 |
0.547 |
|
Users’ loyalty |
3 |
0.672 |
0.691 |
|
Averagea |
0.379 |
0.619 | |
|
a Weighted average with weight the is number of items | |||
In assessing the R2 of endogenous latent, Wynne W. Chin stated R2 values less than 0.19 as very weak; between 0.19 and 0.33 as weak; between 0.33 and 0.67 as moderate; and more than 0.67 as substantial in representing amount of construct’s variance (Chin [2]). Refer to this criteria, we found users’ satisfaction and their loyalties are very weak and substantial constructs, respectively. Furthermore, although PLS-SEM does not have adequate goodness-of-fit (GoF) measure, a formula by Tenenhaus et al.[16] can be used as proxy for global GoF, as follow:
G̃oF = √̅̅̅̅̅̅.̅̅̅̅ (1)
In Eq. 1, ̅̅̅̅̅̅ and represent their weighted average with weight is the number of items for each of constructs. Applying this formula, we got GoF as much as 0.495 and we believe this value as a proxy for inner measurement model is acceptable although model interpretation has to be carefully done. Our final inner model with path coefficients and their p-values is depicted on Fig. 4.
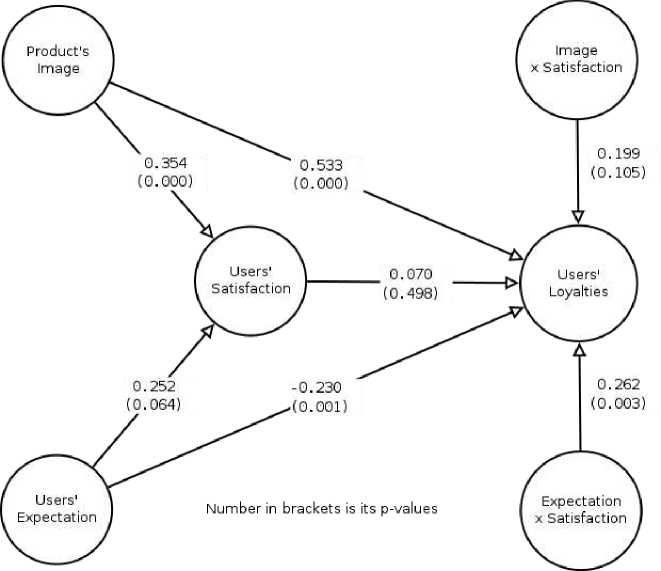
Figure 4. Inner Model Measurement Result
From above figure we found four, one, and two out of seven path coefficients representing the direct effect of exogenous latent to associative endogenous are significant, quasi significant, and insignificant; respectively. The significance of causal relationships were listed on Table 5:
Table 5. Significance of Causal Relationship and the Hypotheses
|
Hypothesis |
Latent Variables |
Path Values |
p-values |
Significance |
Remark | |
|
Exogenous |
Endogenous | |||||
|
H1 |
Product’ Images |
Users’ Satisfaction |
0.354 |
0.000 |
Significant |
Accepted |
|
H2 |
Users’ Expectation |
Users’ Satisfaction |
0.252 |
0.064 |
Quasi Signif. |
Accepted |
|
H3 |
Product’ Images |
Users’ Loyalties |
0.533 |
0.000 |
Significant |
Accepted |
|
H4 |
Users’ Expectation |
Users’ Loyalties |
-0.230 |
0.001 |
Significant |
Accepted |
|
H5 |
Users’ Satisfaction |
Users’ Loyalties |
0.070 |
0.498 |
Insignificant |
Rejected |
|
H6 |
Image x Satisfaction |
Users’ Loyalties |
0.199 |
0.105 |
Insignificant |
Rejected |
|
H7 |
Expectation x Satisfaction |
Users’ Loyalties |
0.262 |
0.003 |
Significant |
Accepted |
Refers to Table 5, we proved product’ images significantly affects users’ satisfaction and loyalties with path values are 0.354 and 0.533, respectively. Images have bigger effect on users’ loyalties than on users’ satisfaction. These finding is inline with similar work’s results by Bayol et al. [1], whom found image effect on loyalty as much as 0.212 is bigger than its effect on customer satisfaction as much as 0.153. Besides of these agreements, we also found some differences between our results and Bayol’s work. We found users’ satisfaction has not significant effect on users’ loyalties while Bayol et al. found this causal relationship is significant with path value was 0.466. We found satisfaction that moderated the effect arose from users’ expectation, changing the causal relationship from negatively significant (-0.230) becomes positively significant (0.262).
Users’ loyalty is very important concept in business domain. Our research justified images and users’ satisfaction are two significant determinant for building users’ loyalty although both effects work in different ways. The better images were perceived by users will increase users’ loyalties. However, the increasing of users’ expectation will cause the less for their loyalties. The causal characteristic between satisfaction and loyalties where the direction is opposing each other’s can be changed through moderation effect of users’ satisfaction.
Regarding the finding about insignificant causal relationship between users’ satisfaction to loyalties, we suggest to try and/or add another reflective indicators for satisfaction latent variable. We think small value for satisfaction’s R2 arise from insufficient number of indicators as measurement set for this latent. In addition, because of PLS-SEM is a non-parametrical technique that is not to tight about fulfillment of distribution assumption, we suggest to try CB-SEM to analyze the data.
Acknowledgment
We wish to express our high appreciation to Agung S. Wiranatha, Ph.D, head of Tourism Research Consortium, for partial funding on this works. Same remark was conveyed to Prof. Linda Darmajanti at Department of Sociology, University of Indonesia, which has prompted and challenged the authors to examine the phenomenon of sociology and humanities from a quantitative perspective.
References
-
[1] Bayol, M.-P., Foye, A.d.l., Tellier, C. & Tenenhaus, M., 2000. Use of PLS Path Modelling to estimate the European Consumer Satisfaction Index (ECSI) model. Statistica Applicata, 12(3), pp.361-75.
-
[2] Chin, W.W., 1998. The partial least squares approach to structural equation modeling. In G.A. Marcoulides, ed. Modern Methods for Business Research. Mahwah, NJ: Lawrence Erlbaum Associates. pp.295-358.
-
[3] Churchill, G.A., 1979. A Paradigm for Developing Better Measures of Marketing Constructs. Journal of Marketing Research, 16(1), pp.64-73.
-
[4] Fornell, C., 1992. A National Customer Satisfaction Barometer, the Swedish Experience. Journal of Marketing, 52(1), pp.6-21.
-
[5] Fornell, C.G., 1982. A second generation of multivariate analysis: An overview. In C. Fornell, ed. A second generation of multivariate analysis. New York: Praeger. pp.1-21.
-
[6] Hair, J.F., Anderson, R.E., Tatham, R.L. & Black, W.C., 1995. Multivariate Data Analysis with Readings. 4th ed. New Jersey: Prentice-Hall, Inc.
-
[7] Hair, J.F., Hult, G.T.M., Ringle, C.M. & Sarstedt, M., 2013. A Primer on Partial Least Square Structural Equation Modeling. New York: SAGE.
-
[8] Hair, J.F., Ringle, C.M. & Sarstedt, M., 2011. PLS-SEM: Indeed a silver bullet. Journal of Marketing Theory and Practice, 19(2), pp.139-51.
-
[9] Hair, J.F., Sarstedt, M., Ringle, C.M. & Mena, J.A., 2012. An assessment of the use of partial least squares structural equation modeling in marketing research. Journal of Academic Marketing Science, 40, pp.414-33.
-
[10] Hox, J.J. & Bechger, T.M., 1998. An Introduction to Structural Equation
Modeling. Family Science Review, 11, pp.354-73.
-
[11] Jarvis, C.B., Mackenzie, S.B. & Podsakoff, P.M., 2003. A Critical Review of Construct Indicators and Measurement Model Misspecification in Marketing and Consumer Research. Journal of Consumer Research, 30, pp.199-218.
-
[12] Peng, D.X. & Lai, F., 2012. Using partial least squares in operations management research: A practical guideline and summary of past research. Journal of Operation Management, 30, pp.467-80.
-
[13] Petter, S., Straub, D. & Rai, A., 2007. Specifying Formative Constructs in Information Systems Research. MIS Quarterly 31 (4), pp.623-56.
-
[14] Rigdon, E.E., 1998. Structural equation modeling. In G.A. Marcoulides, ed. Modern methods for business research. Marwah: Erlbaum. pp.251-94.
-
[15] Ringle, C.M., Wende, S. & Will, A., 2014. SmartPLS 3.0. [Online] Available at: http://www.smartpls.de [Accessed 12 October 2015].
-
[16] Tenenhaus, M., Vinzi, V.E., Chatelin, Y.-M. & Lauro, C., 2005. PLS path modeling. Computational Statistics & Data Analysis, 48, pp.159-205.
104
Discussion and feedback