Identification of Dominant Shark Fins Landed at The Port of Benoa, Bali Based on CO1 Gene
on
Journal of Marine and Aquatic Sciences 8 2), 221-229 2022)
Identification of Dominant Shark Fins Landed at The Port of Benoa, Bali Based on CO1 Gene
Yuni Debora Prasicilia Sitorus a*, Pande Gde Sasmita Julyantoro a, Ayu Putu Wiweka Krisna Dewi a
a Department of Aquatic Resources Management, Faculty of Marine and Fisheries, Udayana University, Badung, Bali - Indonesia
* Correspondent author. Tel.: +6285-858-575-828
E-mail address: yuniprasicilia@gmail.com
Diterima (received) 28 Juni 2018; disetujui (accepted) 15 November 2022; tersedia secara online (available online) 1 Desember 2022
Abstract
Indonesia is one of the world's most shark-catching countries. One of the fishery ports that has a by-product of sharks is the Port of Benoa. The purpose of this study was to determine the species and phylogenetic relationship of sharks from dominant fin samples landed at the Port of Benoa, Bali based on the results of morphological identification and DNA barcoding techniques. The study was conducted from January to February 2018 at the Pengawasan Sumberdaya Kelautan dan Perikanan Base (PSDKP) Benoa. This research uses exploration method with survey technique. The data used in this research is primary data of dominant shark fin samples in research location area and secondary data of location where shark caught by fisherman based on PSDKP database. The results showed that by-catch sharks from dominant fin samples at the Port of Benoa, Bali based on morphological identification and DNA barcoding technique were Prionace glauca (Blue Shark) species. The results of phylogenetic analysis of by-catch shark species from dominant fin samples landed at the Port of Benoa, Bali have close relation with Carcharhinidae family. Prionace glauca shark species have an amplified nucleotide base length of 600 pb with similarity reaching 99 values with species present in GenBank.
Keyword: shark; DNA; barcoding; phylogenetic; family
Abstrak
Indonesia termasuk salah satu negara di dunia yang paling banyak melakukan aktivitas penangkapan hiu. Salah satu pelabuhan perikanan yang memiliki hasil tangkapan sampingan hiu adalah Pelabuhan Benoa. Tujuan dari penelitian ini adalah untuk mengetahui spesies dan hubungan filogenetik ikan hiu dari sampel sirip dominan yang didaratkan di Pelabuhan Benoa, Bali berdasarkan hasil identifikasi morfologi dan teknik DNA barcoding. Penelitian dilaksanakan dari bulan Januari sampai Februari 2018 di Pangkalan Pengawasan Sumberdaya Kelautan dan Perikanan (PSDKP) Benoa. Penelitian ini menggunakan metode eksplorasi dengan teknik survei. Data yang digunakan dalam penelitian adalah data primer berupa sampel sirip ikan hiu dominan di wilayah lokasi penelitian dan data sekunder berupa lokasi dimana ikan hiu tertangkap oleh nelayan berdasarkan database PSDKP. Hasil penelitian menunjukkan ikan hiu hasil tangkapan sampingan (by-catch) dari sampel sirip dominan yang terdapat di Pelabuhan Benoa, Bali berdasarkan hasil identifikasi morfologi dan teknik DNA barcoding merupakan spesies Prionace glauca (Blue Shark). Hasil analisis filogenetik spesies ikan hiu hasil tangkapan sampingan (by-catch) dari sampel sirip dominan yang didaratkan di Pelabuhan Benoa, Bali memiliki hubungan kekerabatan yang dekat dengan famili Carcharhinidae. Ikan hiu spesies Prionace glauca memiliki panjang basa nukleotida yang teramplifikasi sebesar 600 pb dengan similaritas mencapai nilai 99 dengan spesies yang ada pada GenBank.
Kata Kunci: hiu; DNA; barcoding; filogenetik; famili
Indonesia is one of the world's most sharkcatching countries. This puts Indonesia at the top
of the list of 26 of the world's largest shark catchers although in fact most of the shark fishery products in Indonesia are 72% by-catch and 28% are target catches (Emiliya et al., 2017 . Conditions like this
can cause some species of shark to be extinct. More over what happens today is the catch of fishermen in the fishing ports not paying attention to protected or unprotected shark species. One of the fishery ports that has a by-product of sharks is the Port of Benoa.
Port of Benoa is in Denpasar City Bali Province. Port of Benoa has 5 zones, namely: terminal zone, fishery zone, maritime business office zone, tourism zone and public facility zone (Setyadji and Nugraha, 2012 . Regarding supervision of every zone related to marine and fishery resources, there is Technical Implementation Unit (UPT namely Pengawasan Sumberdaya Kelautan dan Perikanan Base (PSDKP Benoa. Base PSDKP Benoa performs regular fishery fish catches of fisheries companies including sharks. In the data, it is explained that generally sharks landed only in the form of fin or pieces of body parts that are not intact (Pereira et al., 2010 so difficult to be identified by morphology only.
Another way of identification is by barcoding DNA techniques that require little tissue from the shark. This technique is needed when traditional taxonomic techniques fail because they do not have enough morphological information (Steinke et al., 2017 . Holmes et al. (2009 introduced a barcoding DNA technique to identify all animal species. The DNA barcode is also one of complementary or complementary alternatives that can strengthen morphological identification rapidly and accurately (Holmes et al., 2009 . The ability of DNA barcodes to identify species depends on the degeneration of the genetic code. This is reinforced by Ward et al. (2008 , who analyzed DNA barcodes with the CO1 gene in 388 species of fish, including 61 Elasmobranchii. This study shows that DNA barcodes are able to discriminate up to 99.5% of the studied fish species. The advantage of using DNA barcoding in identification is that the sample used can be a small piece of tissue (Bineesh et al., 2016 . The use of barcoding DNA in this study was aimed at identifying sharks from dominant dominant samples that were hard to recognize based on the CO1 gene.
Therefore, it is necessary to study the identification of shark's fin from dominant fin samples through morphological observation by looking at the same shape, color and size that looks similar and then reinforced by genetic data through DNA analysis method in laboratory with
various stages such as extraction, PCR and electrophoresis to know the species and phylogenetic relationship of by-catch sharks landed at the Port of Benoa, Bali.
The study was conducted in January-February 2018. Sampling was conducted in January 2018 at Pengawasan Sumberdaya Kelautan dan Perikanan Base (PSDKP Benoa, Port of Benoa Street, South Denpasar District, Denpasar City, Bali Province. The sample data processing was conducted in February 2018 at the Laboratory of Biodiversity Indonesia Foundation (BIONESIA , West Denpasar District, Denpasar City, Bali Province. The sequencing is done at the University of California (UC Berkeley DNA Sequencing Facility, San Fransisco Bay United States. Location Base PSDKP Benoa based on Figure 1.
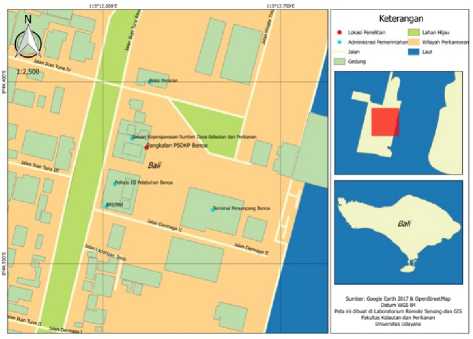
Figure 1. Location base PSDKP Benoa
The tools and materials used in the research are bunsen, dissecting set, ruler, heatingblock, vortex, digital scales, stationery, glove, microtube, PCR strip tube, tray, PCR machine, centrifuge, micro pipette, micro pipette, yellow tip, white tip, UV transluminator, mask, analytical balance, beaker, microwave, mold, comb, electrophoresis machine, camera, matches, parafilm paper, 96% ethanol, 10% chelex solution, shark fin, ddH2O solution, primer 1 (JGLCO , primer 2 (JGHCO , KAPA (dNTP, MgCl2, Taq DNA polymerase, buffer , agarose powder, SB buffer solution, PCR product (sample , low mass DNA ladder, biotium, loading dye.
The research was conducted by using exploration method with survey technique. Primary data is determined by purposive sampling
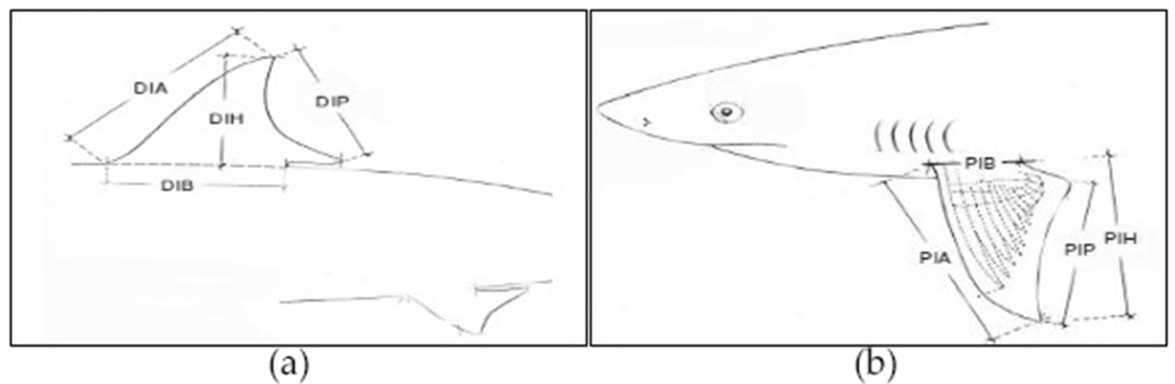
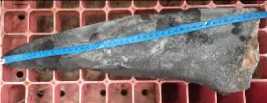
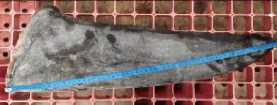
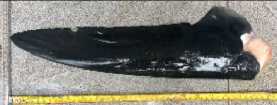
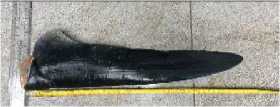
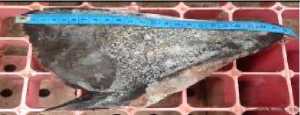
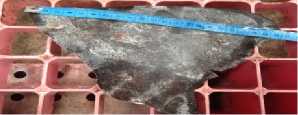
Figure 2. Dorsal fin (a) and (b) Pectoral fin
technique in the form of shark fin samples from fisherman by-catch in January 2018 from 3 largest fishery companies in Benoa Port: 1 PT. Bandar Nelayan, 2 PT. Golden Tuna and 3 PT. Perintis Jaya International to take to Base PSDKP Benoa. While the secondary data in the form where the shark is caught by fishermen based on PSDKP database.
Sampling was conducted in January 2018 and sample data processing was conducted in February 2018. Dominant shark fin samples collected amounted to 9 pieces, in which samples were collected each time the landing of the vessel amounted to 3 samples every 7 days in January 2018. The samples obtained documented first and then preserved for genetic analysis. Dominant shark fin samples in the form of tissue pieces were taken as ± 25 mg and preserved using a 96% ethanol solution of 1 mL placed in a micro tube
and stored in a cool box to be brought to the laboratory.
Samples were collected by morphological identification dorsal fin and pectoral fin, ie visual observation to see dominant shark's fin morphology and morphometric measurements based on morfometric measurement criteria to determine the mean size of dominant shark's fin, followed by genetic identification using DNA barcoding technique with various stages, ie extraction, PCR and electrophoresis to identify the dominant species and phylogenetic relationship of sharks landed at the Port of Benoa, Bali. Where DIB is first dorsal base, measured from the front of the front of the dorsal fin to the back of the back of the dorsal fin; DIA is first dorsal anterior margin, measured from the front end of the dorsal fin to the upper end of the dorsal fin; DIH is first dorsal hight, measured from the tip of the upper body to
Tabel 1 Catch
|
No. Date Proprietor |
Catch |
|
1 10/01/2018 PT. Bandar Nelayan 2 12/01/2018 PT. Golden Tuna |
Albacore, Yellow Fin, Swordfish, Escolar/Devilfish, Water Shark, Mackerel Blue Fin, Big Eye, Yellow Fin, Swordfish, Marlin, Water Shark, Escolar/Devilfish, Mahi-Mahi, Golok-Golok, Albacore, Moonfish |
|
3 17/01/2018 PT. Perintis Jaya Internasional 4 22/01/2018 PT. Golden Tuna |
Squid, Red Snapper, Mackerel, Water Shark, Ariid Catfish, Gulama, Giant Trevally Blue Fin, Big Eye, Yellow Fin, Swordfish, Marlin, Water Shark, Escolar/Devilfish, Mackerel, Golok-Golok, Albacore, Moonfish, Sailfish |
|
5 22/01/2018 PT. Perintis Jaya Internasional 6 25/01/2018 PT. Bandar Nelayan |
Giant Trevally, Mackerel, Grouper Red, Threadfin, Grouper, Water Shark, Ariid Catfish, Pomfret Albacore, Yellow Fin, Swordfish, Escolar/Devilfish, Water Shark, Sailfish, Blue Fin |
|
7 25/01/2018 PT. Bandar Nelayan |
Albacore, Yellow Fin, Escolar/Devilfish, Swordfish, Water Shark, Black Pomfret, Blue Fin |
|
8 27/01/2018 PT. Golden Tuna |
Big Eye, Yellow Fin, Blue Fin, Albacore, Sailfish, Escolar/Devilfish, Marlin, Water Shark |
|
9 28/01/2018 PT. Bandar Nelayan |
Albacore, Yellow Fin, Swordfish, Escolar/Devilfish, Water Shark, Sailfish, Blue Fin, Marlin |
the upper end of the dorsal fin; DIP is first dorsal pasterior margin, measured from the top end of the dorsal fin to the lower end of the dorsal fin; PIB is pectoral base, measured from the front of the pectoral fin to the base of the back of pectoral fin; PIA is pectoral anterior margin, measured from the front of the pectoral fin to the lower end of the pectoral fin; PIH is pectoral height, measured from the back of the pectoral fin to the lower end of the pectoral fin; PIP is pectoral posterior margin, measured from the upper end of the pectoral fin to the lower end of the pectoral fin. Morfometric
measurement criteria dorsal fin and pectoral fin based on Figure 2.
The results of the morphological identification data was determined by the identification species based on morphological characteristics and the genetic identification result data was processed using MEGA 5 software. The sequenced results that have been analyzed determined the identification of the species using the BLAST (Basic
Tabel 2
Result of Morphological Identification No. Sample
Pectoral Fin
Location of Arrest:
High Seas of Indian Ocean
Location of Arrest:
High Seas of Indian Ocean
3
Location of Arrest:
PP. Bacan, PP. Banyuwangi Muncar), PP. Kupang, PP. Masohi, PP. Probolinggo, PP. Seram Timur, PP Sorong, PP. Tarakn, Pu. Bau-Bau, Pu. Biak, Pu. Dobo, Pu. Gorong, Pu. Halmahera, Pu. Kaimana, Pu. Larantuka, Pu. Maumere, Pu. Penambulai, Pu. Saumlaki, Pu. Sawu, Pu. Tehoru
Location of Arrest:
High Seas of Indian Ocean
Location of Arrest:
L. Arafura, L. Seram, L. Aru,L. Timor
Location of Arrest
High Seas of Indian Ocean Average:
|
PIB (cm) |
PIA (cm) |
PIH (cm) |
PIP (cm) |
Weight (gr) |
|
18 |
58 |
54 |
50 |
438 |
|
18 |
54 |
50 |
46 |
432 |
|
17 |
44 |
41 |
37 |
426 |
|
19 |
60 |
57 |
53 |
440 |
|
17 |
44 |
41 |
37 |
425 |
|
16 |
43 |
40 |
36 |
420 |
|
17,5 |
50,5 |
47 |
43 |
430 |
No.
DIB (cm)
DIA (cm) DIH (cm) DIP (cm) Weight (gr)
Sample
Dorsal Fin
7
Location of Arrest:
High Seas of Indian Ocean
16
24 21 17 390
8
17
21 18 14 392
Location of Arrest:
ZEEI S. Hindia (Barat Sumatera), ZEEI S. Hindia (Selatan Jawa)
Location of Arrest:
High Seas of Indian Ocean
Average:
16
24 21 17 394
16 23
20 16 392
Local Alignment Search Tool process that compares the DNA sequencing database on GenBank. The sequencing results were then aligned using Clustal W. The sample sequence obtained from GenBank was analyzed for conservation status at the IUCN redlist. Phylogenetic tree making using MEGA 5 software, Neighbors-Joining Tree method, Kimura-2-Parameter algorithm, p-distance model and bootstrap 1000 replication (Pereira et al., 2010 . Result of morphological identification based on Tabel 2.
The by-catch shark is taken from the 3 largest fishery companies in Benoa Port: 1 PT. Bandar Nelayan, 2 PT. Golden Tuna and 3 PT. Perintis Jaya Internasional based on Tabel 1.
Based on the above results, longline catches at PT. Bandar Nelayan, PT. Golden Tuna and PT. Perintis Jaya Internasional in January 2018 can be grouped into 2, namely: by-catch (meka, escolar, water shark, mackerel, marlin, mahi-mahi, golok-golok, moonfish, sailfish, pomfret and main catch targets (albacore, yellow fin, blue fin, big eye . According to Astuti dkk. (2016 , the composition of
longline fish species at Port of Benoa in April-May 2016, namely: yellow fin, blue fin, big eye, albacore, water shark, escolar/devilfish, moonfish, meka, mackerel, monas shark, black marlin, white marlin, moro/super shark, marlin loreng, coboy shark, mahi-mahi, pomfret and tunafish.
-
4.2 Morphological Identification
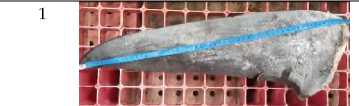
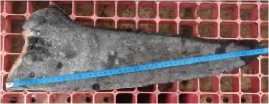
The by-catch shark is the dominant fin samples obtained from different individuals as much as 9 pieces continued to the morphological identification stage (Burgess et al., 2014 .
Based on the above results, the average size of the front of the pectoral fin to the base of the pectoral fin (PIB is 17.5 cm. Average size of the front of the front of pectoral fin to the tip of the lower pectoral fin (PIA is 50.5 cm. The average size of the base of the back of pectoral fin to the lower end of the pectoral fin (PIH is 47 cm. The average size of the top edge of the pectoral fin to the lower end of the pectoral fin (PIP is 43 cm. Average size of the front base of the dorsal fin until the back of the back of the dorsal fin (DIB is 16 cm. The average size of the front end of the dorsal fin to the tip of the dorsal fin (DIA is 23 cm. The average size of the upper end of the body to the tip of the dorsal fin (DIH is 20 cm. The average size of the top end of the dorsal fin to the lower
end of the dorsal fin (DIP is 16 cm. The average weight of pectoral fin is 430 gr. The average weight of the dorsal fin is 392 gr. The results show pectoral fins and dorsal fins have an average size and weight of about the same. According to Astuti dkk. (2016 , sharks landed at the Port of Benoa have size and weight is not much different.
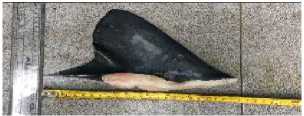
The characteristics of shark morphology identified during the study were two long-tailed and one short, one-tailed fin fins, a pair of longshaped pectoral fins, having two separate anal fins, body shape like a torpedo that allows sharks to swim quickly, blue to gray on upper body and white on the lower body (Megalofonou et al., 2009 . Based on these morphological characteristics, the dominant by-catch sharks were grounded during the research at Port of Benoa, Bali in the form of fin or non-intact body parts, blue shark with the name Prionace glauca species. According to Fahmi and Dharmadi (2015 , blue shark is one of the most widespread sharks found throughout tropical and temperate waters as well as relatively fast reproducing in 5 years producing an average of 35 children.
-
4.3 Genetic identification of dna barcoding techniques
The results of identification of by-catch morphology of by-catch shapes of dominant fin samples obtained from different individuals as many as 9 units continued to the genetic identification stage. The result of genetic identification using DNA barcoding technique through extraction stage, Polymerase Chain Reaction (PCR , electrophoresis and sequencing based on Figure 3 and Figure 4.
In the positive sample electrophoresis results (January 25, 2018 , the samples used were four samples 1, 2, 3 and 4. Samples numbered 1 and 3 showed positive results marked by the presence of DNA bands, while sample number 2 and 4 show a negative result marked by the absence of DNA bands. In the positive sample electrophoresis results (February 01, 2018 , the samples used were 7 samples 2, 4, 5, 6, 7, 8 and 9 in which all samples showed positive results marked by the presence of DNA bands. The location of DNA fragments is formed like bands that can be observed specifically at the electrophoresis stage. Factors that lead to negative sample electrophoresis results, ie: sampling on the part is not appropriate, the insulation process is not correct, the PCR process is
less work and the contamination of DNA samples. According to Kartika dkk. (2017 , electrophoresis results are not apparent due to low DNA concentrations.
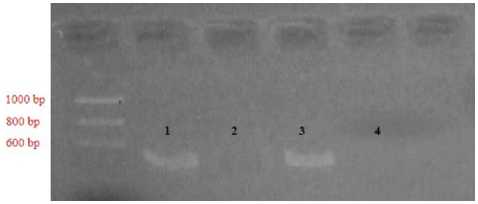
Figure 3. Results of electrophoresis positive samples January 25, 2018
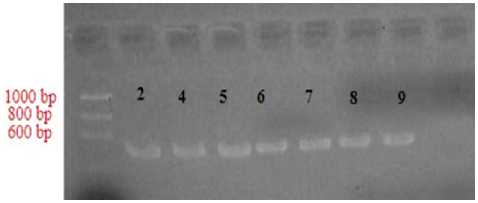
Figure 4. Results of electrophoresis positive samples February 01, 2018
The location of the DNA fragment must be compared with the DNA marker. The sample was successfully amplified and produced a single band when visualizing the agarose gel with a target marker size of 600 pb. According to Thompson and Thompson (2012 , the marker is a specific and well-known segment of DNA that serves as a marker of the base pair position of migrating DNA molecules.
The electrophoresis stage proceeds to the sequencing stage. Based on the sequencing results, the resulting DNA is a sequence of adenine nucleotides (A , cytosine (C , guanine (G and thymine (T in the DNA molecule. The result of sequencing obtained is in the form of file which is result of sequencing machine with ab1 extension and with fas and pdf extension which each contain DNA sequence in FASTA format and electrograph graph. According to Seprianto (2017 , the sequencing result is a sequence of nucleotides that can be distinguished by the type of nucleotide they represent by color. Nucleotides A (adenine is green, nucleotides C (cytosine is blue, nucleotides G (guanine is purple and the nucleotide T (timin is red.
The result of sequencing used is sequence data with good chromatogram. According to Tamura et al. (2011 , the results of sequencing with a clean chromatogram peak are both used in reverse sequence and forward sequence data. Sequencing
Seprianto (2017 , the max identity value of 99% indicates that the isolates are considered as the same species. While homology ≥ 97% can be stated that the comparable isolate belongs to the same genus and homology between 89-93% indicates
Prionace glauca KF793751.1 Cilacap Central Java
BIO HIU
Prionace glauca KF590476.1 Muara Baru Jakarta
Prionace glauca KF590241.1 Benoa Bali
Carcharhinus amblyrhynchos EU398596.1 Nusa Tenggara Barat
Loxodon macrorhinus KF793755.1 Melaboh Aceh
0.01
Figure 5. Phylogenetic Tree Result
results with bad chromatogram peaks are poorly used in reverse sequence and forward sequence data (Otto et al., 2008 .
-
4.4 Phylogenetic tree analysis
The result of genetic identification using DNA barcoding technique in the form of sequenced data is processed using MEGA 5 program (Molecular Evolutionary Genetic Analysis 5 . The sequenced results that have been analyzed are used to identify the by-catch shark species by using the BLAST (Basic Local Alignment Search Tool process that compares the DNA sequence database in GenBank (http://blast.ncbi.nlm.nih.gov .
BLAST results for the level of boostrap values (homogeneity obtained high enough that reaches 99%. This suggests that genetic identification using barcoding DNA techniques is appropriate. In addition, the barcoding ability of DNA techniques to distinguish species can also be seen by phylogenetic tree analysis performed after determining the nucleotide sequence to show proximity between sample species. According to
that isolates reside in the different family, but this needs to be traced again by phylogenetic analysis by looking at branches formed by isolates through observation positions occupied among other species or species of comparison (Willis, 2018 .
Sequences from the sequenced sequence of BLAST sequences were used to identify by-catch shark species in the form of dominant fin samples, followed by making phylogenetic trees to look at kinship, the distance between species and the genetic diversity of by-catch sharks (by-catch of the dominant fin sample with genetic data of sharks present in GenBank in the same family.
Based on the above results, phylogenetic trees describe from 3 species of sharks analyzed from the same family of Carcharhinidae with similarity reaching 99 values with species in GenBank ie Prionace glauca. The first group is occupied by the closest similarity sample, Prionace glauca from Benoa Bali, followed by Prionace glauca from Muara Baru Jakarta and Cilacap Central Java. Phylogenetic Tree Result based on Figure 5. Groups that are different from Prionace glauca are species used as outgroups. Sequences from
Tabel 3
Distance Matrix Results
|
Sequences |
1 |
2 |
3 |
4 |
5 |
6 |
|
Prionace glauca KF590476.1 Muara Baru Jakarta | ||||||
|
Prionace glauca KF793751.1 Cilacap Central Java |
0.002 | |||||
|
Prionace glauca KF590241.1 Benoa Bali |
0.000 |
0.002 | ||||
|
BIO HIU |
0.000 |
0.002 |
0.000 | |||
|
Carcharhinus amblyrhynchos EU398596.1 Nusa Tenggara Barat |
0.045 |
0.047 |
0.045 |
0.045 | ||
|
Loxodon macrorhinus KF793755.1 Melaboh Aceh |
0.134 |
0.136 |
0.134 |
0.134 |
0.143 |
outgroup correlated close to Prionace glauca come from the closest family of Carcharhinus amblyrhynchos. The sequence of outgroup that correlates considerably with Prionace glauca comes from the furthest family of Loxodon macrorhinus.
The boostrap value is shown in the numbers located on the branches of the phylogenetic tree. The results show that the boostrap value reaches 99. According to Rahmad (2013 , the calculation of boostrap values over 90 indicates a high degree of species similarity with the database and the reconstruction of phylogenetic trees can be trusted for accuracy. According to Musa et al. (2008 , the calculation of boostrap value is measured using distance matrix model pairwise distance or p-distance.
Based on the above results, the difference in distance obtained in each sample is reached 0.000. The difference in distance obtained in all samples with Prionace glauca from Benoa Bali and Muara Baru Jakarta is 0.000. The difference in distance obtained in all samples with Prionace glauca derived from Cilacap Central Java was 0.002. The difference in the distance obtained in all samples with the closest family of Prionace glauca ie Carcharhinus amblyrhynchos is reaching 0.045. The difference in distance obtained in all samples with the furthest family of Prionace glauca ie Loxodon macrorhinus was 0.134. This shows that the phylogenetic relationship can be seen from the value of genetic distance. According to Tamura et al., (2013 , the greater the genetic distance, the greater the difference in the number of nucleotide bases and the smaller the genetic distance value, the less the difference in the number of nucleotide bases. Distance matrix results based on Tabel 3.
-
4.5 Species conservation
The sharks of the Prionace glauca species belong to the near threatened category which means almost threatened. According to the Junior et al. (2009 , the near threatened category is a conservation status granted to species in near threatened extinction.
In general, the lack of proper functioning of fishery management has a negative impact on fishery resources. According to Novianto dkk. (2012 , one of the indicators of the non-functioning of fisheries management is the unavailability of time-consuming database of fishing boats that are active in catching as an indicator of real fishing effort as well as inaccurate data collection and information.
Shark species Prionace glauca (Blue Shark have close kinship with Carcharhinidae family. Based on the results of morphological identification and DNA barcoding techniques, it is necessary to study the shark by-catch of unfinished fin samples in this study with more quantities and different sampling times and the need for further research to determine the phylogenetic relationship of species Prionace glauca (Blue Shark with all species of sharks in Indonesia.
References
Astuti, S. P., Ghofar, A., Saputra, S. W., & Nugraha, B.
-
(2016) . Jenis dan distribusi ukuran ikan hasil tangkap sampingan (by catch) rawai tuna yang didaratkan di Pelabuhan Benoa Bali. Journal of Management of Aquatic Resources, 5(4), 453-460.
Bineesh, K. K., Gopalakrishnan, A., Akhilesh, K. V., Sajeela, K. A., Abdussamad, E. M., Pillai, N. G. K., Basheer, J. K., Jena, J. K., & Ward, R. D. (2016). DNA barcoding reveals species composition of sharks and rays in the Indian commercial fishery. Mitochondrial DNA Part A, 28(4), 458-472.
Burgess, G. H., Bruce, B. D., Cailliet, G. M., Goldman, K. J., Grubbs, R. D., Lowe, C. G., MacNeil, M. A., Mollet, H. F., Weng, K. C., & O'Sullivan, J. B. (2014). A reevaluation of the size of the white shark (Carcharodon carcharias) population off California, USA. PLoS One, 9(6), 1-11.
Emiliya, Pratomo, A., & Putra, R. D. (2017). Identification of the type shark fishermen catch on Bintan Island Riau Islands Province. Laporan Penelitian. Tanjung Pinang, Kepulauan Riau: Fakultas Ilmu Kelautan dan Perikanan, Universitas Maritim Raja Ali Haji.
Fahmi, & Dharmadi. (2015). Pelagic shark fisheries of Indonesia’s Eastern Indian ocean fisheries management region. African Journal of Marine Science, 37(2), 259–265.
Holmes, B. H., Steinke, D., & Ward, R. D. (2009). Identification of shark and ray fins using DNA barcoding. Fisheries Research, 95(2), 280-288.
Junior, T. V., Lessa, R. P., & Gadig, O. B. F. (2009). Feeding habits of the blue shark (Prionace glauca) off the coast of Brazil. Journal Scielo Biota Neotropica, 9(3), 55-60.
Kartika, G. R. A., Sartimbul, A., & Widodo, W. (2017). Varian genetik Sardinella lemuru di perairan Selat Bali. Jurnal Kelautan, 10(1), 21-28.
Megalofonou, P., Damalas, D., & Metrio, G. D. (2009). Biological characteristics of blue shark, Prionace
glauca, in the Mediterranean Sea. Journal of the Marine Biological Association of the United Kingdom, 89(6), 1233-1242.
Musa, H. H., Bao, W. B., Wang, K. H., Chen, G. H., & Zhu, G. Q. (2008). Genetic diversity, genetic distance and phylogeny of functional ApoVLDL-II and lipoprotein lipase genes. Journal of Applied Animal Research, 34(2), 143-147.
Novianto, D., Nugraha, B., & Bahtiar, A. (2012). Komposisi ukuran, nisbah kelamin dan daerah penyebaran hiu buaya (Pseudocarcharias kamoharai) yang tertangkap di Samudera Hindia. Jurnal Penelitian Perikanan Indonesia, 18(4), 255-261.
Otto, T. D., Vasconcellos, E. A., Gomes, L. H. F., Moreira, A. S., Degrave, W. M., Mendonca-Lima, L., & Alves-Ferreira, M. (2008). ChromaPipe: a pipeline for analysis, quality control and management for a DNA sequencing facility. Journal Genetics and Molecular Research, 7(3), 861-871.
Pereira, F., Carneiro, J., & Matthiesen, R. (2010). Identification of species by multiplex analysis of variable-length sequences. Nucleic Acids Research, 38(22), 1-17.
Rahmad. (2013). Molecular taxonomy of D NA barcoding and phylogenetic analysis of shark landed in Palabuhan Ratu fisheries landing site. Tesis. Bogor, Indonesia: Bogor Agicultural University.
Seprianto. (2017). Introductory course modules bioinformatics IBT 431. [online] Universitas Esa Unggul. (http://digilib.esaunggul.ac.id), [diakses: 05 Juni 2018].
Setyadji, B., & Nugraha, B. (2012). Hasil tangkap sampingan (HTS) kapal rawai tuna di Samudera
Hindia yang berbasis di Benoa. Jurnal Penelitian Perikanan Indonesia, 18(1), 43-51.
Steinke, D., Bernard, A. M., Horn, R. L., Hilton, P., & Hanner, R. (2017). DNA analysis of traded shark fins and mobulid gill plates reveals a high proportion of species of conservation concern. Journal Nature Research, 7(1), 1-6.
Tamura, K., Peterson, D., Peterson, N., Stecher, G., Nei, M., & Kumar, S. (2011). MEGA5: molecular evolutionary genetics analysis using maximum likelihood, evolutionary distance, and maximum parsimony methods. Journal Society for Molecular Biology and Evolution, 28(10), 2731-2739.
Tamura, K., Stecher, G., Nei, M., Peterson, D., Filipski, A., & Kumar, S. (2013). MEGA6: molecular evolutionary genetics analysis version 6.0. Journal Society for Molecular Biology and Evolution, 30(12), 2725-2729.
Thompson, R. B., & Thompson, B. F. (2012). Illustrated guide to home biology experiments: all lab, no lecture. (1st edition.). California, USA: DIY Science.
Ward, R. D., Holmes, B. H., White, W. T., & Last, P. R. (2008). DNA barcoding Australasian
chondrichthyans: results and potential uses in conservation. Marine and Freshwater Research, 59(1), 57-71.
Willis, A. (2018). Confidence sets for phylogenetic trees. Journal of the American Statistical Association, 114(525), 235-244.
© 2022 by the authors; licensee Udayana University, Indonesia. This article is an open access article distributed under the terms and conditions of the Creative Commons Attribution license (http://creativecommons.org/licenses/by/3.0/).
J. Mar. Aquat. Sci. 8: 221-229 (2022)
Discussion and feedback