Performance Test Application Center For Research And Community Service With The Pieces Method At STKIP Dharma Bakti Lubuk Alung Foundation
on
p-ISSN: 1979-5661
e-ISSN: 2622-321X
Jurnal Ilmu Komputer VOL. 16 Nomor 1
Performance Test Application Center For Research And Community Service With The Pieces Method At STKIP
Dharma Bakti Lubuk Alung Foundation
Dodi Nofri Yoliadi
Fakultas Ushuluddin, Adab dan Dakwah, UIN Mahmud Yunus Batusangkar Jl. Jenderal Sudirman No.137, Kec. Lima Kaum, Kabupaten Tanah Datar, Sumatera Barat
Email: dodinofriyoliadi@uinmybatusangkar.ac.id
Abstract
The Research and Community Service Center is the entity that manages the areas of research and community service. To date, the Center for Research and Community Service (P3M) at Dharma Bakti Lubuk Alung Foundation STKIP manages research activity and community service data entered into databases using Microsoft Access. Therefore, the Dharma Bakti Lubuk Alung Foundation's web-based research and community service center application was built using the PHP programming language and database processing with MySQL. The application development method adopts the waterfall method. GTMetrix is used as a software test to evaluate the performance of this application. The method used in this study is a quantitative method using the PIECES analytical model. The Research and Community Service Center, which evaluates application performance, received an A grade indicating that the application performed "very well" based on the results of all sites tested on GTMetrix. An analysis of user satisfaction with the Center for Research and Civil Service's application yielded a value of 4.4. This means that user satisfaction can be categorized as "very satisfied".
Keywords: P3M, Apps, GTMetrix, User Satisfaction, PIECES
-
1. Introduction
The Center for Research and Community Service is a unit that manages the fields of research and community service[1]. P3M has the task of planning and managing research and development activities in the fields of education and community service[2]. So far, P3M at STKIP Dharma Bakti Lubuk Alung Foundation manages data on research and community service activities using Microsoft Access, which is entered into the database. In addition, lecturers can also input data using the Google form, but this is not yet effective because the data is still inputted by P3M into the database using Microsoft Access. In addition, the process of collecting research data and dedication from lecturers to P3M is sometimes constrained by incomplete supporting data from lecturers. The P3M application is a web-based application developed to address problems in processing P3M data. This application was built using the PHP programming language, MySQL database, and CodeIgniter framework. The applied application development methodology is the waterfall model.
Evaluation of the performance of web-based applications is needed to be able to get recommendations for improvements to the application manager[3][8]. One of the tools commonly used to evaluate the performance of web-based applications is GTMetrix. Testing the level of user satisfaction is needed to determine the quality of an application[4]. Satisfaction is a feeling that arises in a person for the performance or results of a product or program that is being used for what is desired. User satisfaction does not focus on technical aspects but on the user's response to an application or information system. User satisfaction can be measured but not predicted. The PIECES framework method is one of the methods used for analysis and evaluation of user satisfaction[8]. The purpose of this research is to evaluate the performance of the P3M application using GTMetrix and to analyze the level of user satisfaction with the use of the P3M application using the PIECES method.
-
2. Research Methods
-
2.1. Types of Research
-
According to Nikolaus Duli (2019), "the definition of quantitative is the activity of collecting, managing, analyzing, and presenting data based on the amount or quantity that is carried out objectively to solve a problem or test a hypothesis to develop general principles" [5].
-
2.2. Research Variables
The following are the variables of the PIECES method:
Table I. Variabel PIECES
|
No |
Variabel |
Code |
Indicator |
|
1 |
Perfor- |
Q1 |
Easily accessible to users. |
|
mance |
Q2 |
If used simultaneously, system performance is stable. | |
|
Q3 |
Can operate a number of commands in a relatively short time. | ||
|
Q4 |
Quickly respond to a cancellation order or request. | ||
|
Q5 |
Available menus and navigation can be run easily and interactively. | ||
|
Q6 |
Has an attractive appearance. | ||
|
Q7 |
Displays the appropriate information as desired. | ||
|
Q8 |
There is an easy cancellation action available if needed. | ||
|
Q9 |
The resulting output has a consistent appearance. | ||
|
Q10 |
Never experienced an error when used. | ||
|
2 |
Infor- |
Q11 |
The information provided is accurate. |
|
mation |
Q12 |
Information was presented as needed. | |
|
and Data |
Q13 |
The information presented is easy to learn and understand. | |
|
Q14 |
Data is easy to access or use as needed. | ||
|
3 |
Economic |
Q15 |
Save operational costs. |
|
Q16 |
Speed up the reporting process. | ||
|
4 |
Control |
Q17 |
Has various access rights restrictions the data is guaran- |
|
and |
teed confidentially. | ||
|
Security |
Q18 |
Provide benefits to users. | |
|
5 |
Efficiency |
Q19 |
Data storage becomes easier. |
|
Q20 |
The work becomes easier to complete. | ||
|
Q21 |
The services provided are as desired. | ||
|
6 |
Service |
Q22 |
Reliable/trustworthy information. |
|
Q23 |
Easily accessible to users. |
To measure the research variables, we used a Likert scale. The Likert scale is a psychometric scale that is commonly used in questionnaires and is the most widely used scale in survey research[7]. The Likert scale used in this study has 5 score dimensions, which can be seen in the table below.
Table 2. Likert Scale Score
|
No |
Answer |
Code |
Score |
|
1 |
Strongly Agree |
SA |
5 |
|
2 |
Agree |
A |
4 |
|
3 |
Doubtful |
D |
3 |
|
4 |
Don't Agree |
DA |
2 |
|
5 |
Strongly Disagree |
SD |
1 |
-
2.3. Research Data
The sources of data used in this study were interviews and questionnaires. The interview was conducted in the form of a question-and-answer session directly with the head of the P3M because he was considered to be directly involved, had knowledge and a deep understanding of the situation, and knew more about the information needed to find out the problems to be studied. The questionnaire is a set of lists of questions related to the P3M process at the STKIP Dharma Bakti Lubuk Alung Foundation, which will be addressed to lecturers as application users.
-
2.4. Population and Sample
According to Arikunto (2012), if the total population is less than 100 people, then the total sample is taken as a whole, but if the population is greater than 100 people, then 1015% or 20–25% of the total population can be taken [6]. Because this study had a population of no more than 100 people, the authors took 100% of the population, namely 18 respondents. The use of the entire population as a unit of observation without having to draw a research sample is known as the census technique.
-
2.5. Application Development
-
1. Use Case Diagrams
Use case diagrams are used to design interactions between users and applications. A use case diagram can be seen in the image below:

Figure 1. Use Case Diagram
-
2. Context Diagrams
The following is the context diagram of the P3M application.

Figure 2. Context Diagram
3. Relationship Scheme
The image form of the database relation table can be seen in the image below.

(D agt: varchar(100) # status : iπt(11)
8 id_tim : ιnt(11)
# id_dosen : int(1OO)
© nama : varchar(90)
© tim : varchar(50)
So M timp a id_tim : int(11) # id_dosen : int(100) © nama : varchar(90) © tim : varchar(50) © sbg varchar(50) © agt: varchar(100)
J 0 P3M dosen g id_dosen : int(11) ħ nidn : int(25) @ password varchar(40) ® nama : varchar(100) ® alamat varchar(100) ® jk: varchar(100) ® nohp : varchar(12) H tgl date
® prodi: varchar(30) # level: int(1)
® email: varchar(100) ® foto: varchar(500)
J 0 P3M pengumuman a id_pengumuman : int(11) © judul: varchar(100)
S tgl date
© isi: text
© file : varchar(500)
-
# id dosen : int(11)
J O P3M publikasi a id_publikasi: int(11) # nidn : int(100) © nama varchar(50) © judul: varchar(225) H tgl: date
© sdana : varchar(IOO) u jdana : int(10)
© prodi: varchar(50) © file: varchar(255) # id-dosen : int(11) « tahun : int(11)
® anggota : varchar(100) « id tim : int(11)
J0 P3 penelitian a id_penelitian : int(11) « nidn: int(100) © nama varchar(50) © anggota : varchar(50) © tahun varchar(4) © judul: varchar(225) 0 tgl: date « id_tim : int(11) © sdana varchar(100) # jdana int(10) © prodi: varchar(50) © file: varchar(255) « id-dosen : int(11)

2 ■ pengabdian
a id_pengabdian int(11) # nidn : int(100)
® nama : varchar(50)
© judul: varchar(225)
H tgl: date
@ sdana : varchar(100) «jdana int(10)
© prodi: varchar(50)
© file: varchar(255)
-
# id_dosen : int(11)
-
# tahun : int(11)

9 ∣d-surat: ιnt(11)
© nama : varchar(50)
© perihal: varchar(50)
© tempat: varchar(1OO)
© kpd : varchar(1OO)
© judul_proposal: varchar(225)
□ tgl: date
® isi: text
© jabatan : varchar(50)
® file : varchar(500)
® status varchar(30)
# id-dosen : int(11)
Figure 3. Database Relations Schema
-
4. Implementation
The following is an implementation of the P3M STKIP application for the Dharma Bakti Lubuk Alung Foundation. The following image is the dashboard page.
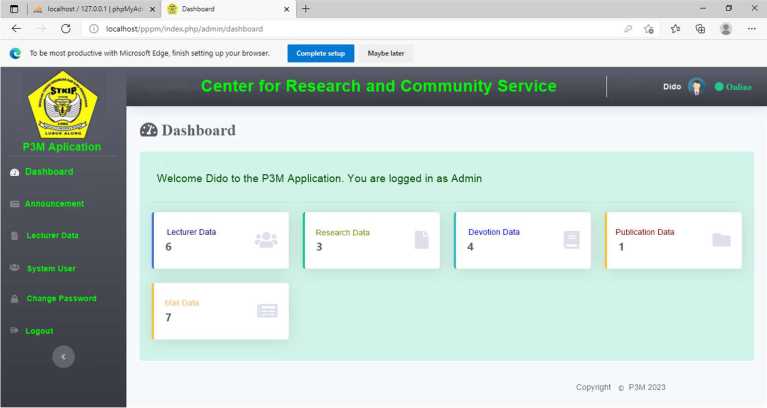
Figure 4. Dashboard Page
The following is a research data page.

Figure 5. Research Data Page
-
3. Results
-
3.1. P3M Application Performance Testing
-
The following is a performance test that was tested using the GTMetrix testing software.
Table 3. Performance Evaluation of the P3M Web Application
|
No |
Web Page |
Grade |
Test Result | |
|
Performance |
Structure | |||
|
1 |
Login |
A |
100% |
98% |
|
2 |
Dashboard |
A |
100% |
95% |
|
3 |
Announcement |
A |
100% |
98% |
|
4 |
Lecturer Performance |
A |
100% |
98% |
|
5 |
Team |
A |
99% |
98% |
|
6 |
Lecturer Data |
A |
100% |
98% |
|
7 |
Report |
A |
100% |
98% |
From the table above, it can be seen that 100% of all the pages tested get an A.
-
3.2. Analysis of User Satisfaction Levels
The following determines the level of satisfaction using the model stated by Kaplan and Norton with the following levels of satisfaction:
Table 4. Satisfaction Level
|
Value Range |
Category |
|
1 – 1.79 |
Very Dissatisfied |
|
1.8 – 2.59 |
Not satisfied |
|
2.6 – 3.39 |
Doubtful |
|
3.4 – 4.19 |
Satisfied |
|
4.2 – 5 |
Very satisfied |
(Source: Norton, 2000)
In the following, the level of user satisfaction is described per statement for each variable in the PIECES method.
1. Performance

Figure 6. Performance Variable Testing
Based on the graph above, it can be concluded that the highest result in the performance variable is found in the Q1 indicator with a value of 4.56. While the lowest results in the performance variable are found in the Q5 and Q10 indicators, namely 4.22.

Figure 7. Information and Data Variable Testing
Based on the graph above, it can be concluded that the highest results in the information and data variables are found in the Q12 and Q13 indicators with a value of 4.39. while the lowest result in the Information and Data variable is found in the Q14 indicator, which is 4.17.
-
3. Economic

Figure 8. Economic Variable Testing
Based on the graph above, it can be concluded that the highest result in the economic variable is found in the Q15 indicator with a value of 4.67. while the lowest result in the economic variable is found in the Q16 indicator, which is 4.56.
-
4. Control and Security

Figure 9. Control and Security Testing
Based on the graph above, it can be concluded that the highest result in the Control and Security variable is found in the Q18 indicator with a value of 4.33. While the lowest result in the Control and Security variable is found in the Q17 indicator, which is 4.28.
-
5. Efficiency
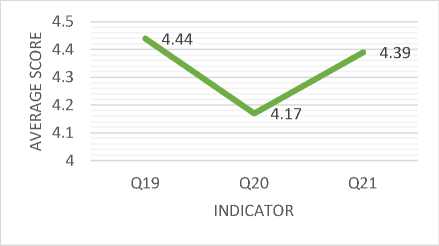
Figure 10. Variable Efficiency Testing
Based on the graph above, it can be concluded that the highest result in the efficiency variable is found in the Q19 indicator with a value of 4.44. while the lowest result in the Efficiency variable is found in the Q20 indicator, which is 4.17.
-
6. Service

Figure 11. Service Variable Testing
Based on the graph above, it can be concluded that the highest result in the service variable is found in the Q22 indicator with a value of 4.61. while the lowest result in the service variable is found in the Q23 indicator, which is 4.44.
To calculate the average score of each PIECES variable, you can use the following formula:
Xi =
(xa + xb + xc + xc + xd + xe) ∑i
Information :
Xi = the average score of the i-variable
(xa,…, xe) = average score of indicator-a to indicator-e ∑i = number of indicators for each variable
Table 4. Recapitulation of the PIECES Analysis Method
|
Code |
∑ |
Result |
|
1. Performance | ||
|
Q1 |
4,56 |
Very satisfied |
|
Q2 |
4,44 |
Very satisfied |
|
Q3 |
4,33 |
Very satisfied |
|
Q4 |
4,28 |
Very satisfied |
|
Q5 |
4,22 |
Very satisfied |
|
Q6 |
4,28 |
Very satisfied |
|
Q7 |
4,33 |
Very satisfied |
|
Q8 |
4,28 |
Very satisfied |
|
Q9 |
4,39 |
Very satisfied |
|
Q10 |
4,22 |
Very satisfied |
|
∑ |
43,33 | |
|
Average |
4,33 |
Very satisfied |
|
2. Information and Data | ||
|
Q11 |
4,22 |
Very satisfied |
|
Q12 |
4,39 |
Very satisfied |
|
Q13 |
4,39 |
Very satisfied |
|
Q14 |
4,17 |
Satisfied |
|
∑ |
17,17 | |
|
verage |
4,29 |
Very satisfied |
|
3. Economy | ||
|
Q15 |
4,67 |
Very satisfied |
|
Q16 |
4,56 |
Very satisfied |
|
∑ |
9,23 | |
|
Average |
4,61 |
Very satisfied |
|
4. Control and Security | ||
|
Q17 |
4,28 |
Very satisfied |
|
Q18 |
4,33 |
Very satisfied |
|
∑ |
8,61 | |
|
Average |
4,31 |
Very satisfied |
|
5. Efficiency | ||
|
Q19 |
4,44 |
Very satisfied |
|
Q20 |
4,17 |
Satisfied |
|
Q21 |
4,39 |
Very satisfied |
|
∑ |
13 | |
|
Average |
4,33 |
Very satisfied |
|
6. Service | ||
|
Q22 |
4,61 |
Very satisfied |
|
Q23 |
4,44 |
Very satisfied |
|
∑ |
9,05 | |
|
Average |
4,53 |
Very satisfied |
Based on the table above, an average score of 4.33 is obtained for performance variables, 4.29 for information and data variables, 4.61 for economic variables, 4.31 for control variables and security (control and security), 4.33 for efficiency variables, and 4.53 for service variables.
To calculate the average total score of all variables, the following formula is used:
∑x Variabel = Information :
(Xl+X2+X3+X4+X5+X6) N
∑x Variable = total variable average score X1… X6 = average score of variables 1 to 6 N = number of variables
The total value of the average score of all variables can be calculated as follows:
∑x Variabel
(Xl + X2 +X3 +X4 +X5 +X6 ) 6
(4,33 + 4,29 + 4,6l + 4,3l + 4,33+ 4,53)
26,4
6
6
= 4,4

Figure 12. Testing the PIECES Method
From the results of the total variable average score, a value of 4.4 was obtained. This value is in the interval 4.2–5, which indicates that the level of user satisfaction with the P3M application can be stated at the "Very Satisfied" stage by users.
Based on the results of the research and discussions conducted, we can conclude that: His P3M application test results using GTMetrix Software Testing gave a grade of 'A' for all sites tested. This value indicates that the results of the P3M application performance test can be classified as "very good." As a result of analyzing the satisfaction level of users of web-based P3M applications using the PIECES analysis model, a value of 4.4 was achieved. Since this value is in the range of 4.2 to 5, user satisfaction with P3M applications can be classified as "very satisfied". This application needs further development to be able to manage large amounts of data in the future. This application will be further implemented in his P3M at the STKIP Dharma Bakti Lubuk Alung Foundation to facilitate the management process of research data and community services. It is desirable to use multiple test tools to produce analytical results that can be used as comparative material.
References
-
[1] Mujilan, Agustinus. 2017. Analisis dan Perancangan Sistem Perspektif Bidang Akutansi. Universitas Katolik Widya Mandala Madiun : Fakultas Ekonomi dan Bisnis
-
[2] Jogiyanto, H. M. 1999. Analisis dan Desain Sistem Informasi. Yogyakarta: Andi
-
[3] Suliman. 2020. Analisis Performa Website Universitas Teuku Umar dan Universitas Samudera Menggunakan Pingdom Tools dan GTMetrix. SIMKOM, 5(1), pp.24-32.
-
[4] Ragil, Wukil. (2010). Pedoman Sosialisai Prosedur Operasi Standar. Mitra Wacana Media. Jakarta
-
[5] Duli, Nikolaus. 2019. Metodologi Penelitian Kuantitatif. Yogyakarta : Deepublish.
-
[6] Arikunto, Suharsimi. 2012. Prosedur Penelitian. Jakarta : Rineka Cipta
-
[7] Kaplan, Robert S. dan Norton, David P. 2000. Balanced Scorecard : Menerjemahkan Strategi Menjadi Aksi. Jakarta: Erlangga
-
[8] A. Supriyatna and V. Maria, “Analisis Tingkat Kepuasan Pengguna dan Tingkat Kepentingan Penerapan Sistem Informasi DJP Online dengan Kerangka PIECES dan Importance Performance Analysis,” Khazanah Inform. J. Ilmu Komput. Dan Inform., vol. 3, no. 2, pp. 88–94, 2017.
-
[9] A. Rafika Dewi, “Analisis Sistem Informasi Pengolahan Data Nilai Mahasiswa Menggunakan PIECES pada Prodi Sistem Informasi STTH-Medan,” J. Sist. Inf., vol. 02, no. 02, pp. 37–46, 2018.
-
[10] A. Supriyatna, “Perpustakaan Dengan Menggunakan Pieces Framework,” Pilar Nusa Mandiri, vol. XI, no. 1, pp. 43–52, 2015.
-
[11] Y. Yusran, “Perancangan Sistem Informasi Administrasi Pembayaran SPP Siswa Berbasis Web,” Edik Inform., vol. 6, no. 2, pp. 7–14, 2020, doi: 10.22202/ei.2020.v6i2.3980.
-
[12] A. M. Inge Monica, “procuratio : Jurnal Ilmiah Manajemen Procuratio : Jurnal Ilmiah Manajemen,” Charli Ones Chintya,Putri Intan permata sari dkk., vol. 8, no. 2, pp. 491–502, 2020.
-
[13] H. O. L. Wijaya, “Implementasi Metode Pieces Pada Analisis Website Kantor Penanaman Modal Kota Lu-buklinggau,” JUSIM (Jurnal Sist. Inf. Musirawas), vol. 3, no. 1, pp. 46–55, 2018, doi: 10.32767/jusim.v3i1.289.
-
[14] N. Junaedi, “Analisa Kepuasan Mahasiswa Terhadap Sistem Informasi Perpustakaan Universitas Merdeka Madiun Menggunakan Framework Pieces,” Res. Comput. Inf. Syst. Technol. Manag., vol. 1, no. 2, p. 59, 2018, doi: 10.25273/research.v1i02.3364.
-
[15] A. Fatoni, K. Adi, and A. P. Widodo, “PIECES Framework and Importance Performance Analysis Method to Evaluate the Implementation of Information Systems,” in E3S Web of Conferences, Nov. 2020, vol. 202, doi: 10.1051/e3sconf/202020215007
-
[16] M. Pangri, S. Sunardi, R. Umar, A. Dahlan, J. Ring Road Selatan, and T. Banguntapan Bantul, “Metode Pieces Frameworks Pada Tingkat Kepuasan Pengguna Sistem Informasi Perpustakaan Universitas.
-
[17] Muhammadiyah Sorong,” Bina Insa. ICT J., vol. 8, no. 1, pp. 63–72, 2021 S. Ramadhani, “PIECES Framework untuk Analisa Tingkat Kepuasan Pengguna dan Kepentingan.
-
[18] F. L. Guribie and C. Tengan, “A Proposed Knowledge Management Implementation Framework for the Ghanaian Construction Industry,” J. Build. Constr. Plan. Res., vol. 07, no. 01, pp. 1–10, 2019, doi: 10.4236/jbcpr.2019.71001.
31
Discussion and feedback