Optimization Of Wsn Deployment Using Pso Algorithm For Forest Fire Detection
on
p-ISSN: 2301-5373
e-ISSN: 2654-5101
Jurnal Elektronik Ilmu Komputer Udayana
Volume 11, No 2. November 2022
Optimization Of WSN Deployment Using PSO Algorithm For Forest Fire Detection
I Made Suastikaa1, I Gusti Agung Gede Arya Kadyanana2, Ngurah Agus Sanjaya ERa3, Made Agung Raharjaa4, I Komang Ari Mogi a5, Agus Muliantara a6
aInformatics Engineering, Faculty of Math and Science, University of Udayana South Kuta, Badung, Bali, Indonesia
Abstract
Forest fires are disasters that have often occurred in recent years. This has a huge impact on both the environment and society itself. Delayed handling of fires is one of the triggering factors for the large losses caused by the disaster. The use of a Wireless Sensor Network is one solution so that information related to fires is conveyed to the authorities quickly so that the handling can be done more quickly. In this study, a simulation was made to determine the optimal position of a node to detect fires optimally. This simulation is run on NS3 Software on Ubuntu 18.04 Linux Operating System. In the optimization process, the PSO algorithm is run with Google Colab. The results of each iteration on the PSO will be simulated in NS3 and the communication between nodes will be seen. There are 12 iterations of the maximum 30 iterations specified, and there are 12 simulations according to the number of iterations. From 12 simulations that have been carried out, it is known that in the last iteration of the 10 nodes installed, all nodes communicate. Communication between nodes can be seen through .pcap files and graphs on NetAnim, the communication is characterized by sending fire messages to each installed node. In the last iteration, 10 nodes received a fire message.
Keywords: Wireless Sensor Network, Forest fires, Particle swarm optimization
Forest fires are one of the natural disasters that have recently occurred in Indonesia. According to the Ministry of Environment and Forestry, based on Landsat satellite imagery, as of September 2019, forest and land fires reached 857,755 hectares[1]. In addition to causing environmental damage, the impact of forest fires is the high cost of handling them and the relatively long post-fire recovery process. A wireless sensor network (WSN) is a distributed autonomous device that uses sensors to monitor physical or environmental conditions such as temperature, sound, vibration, pressure, and movement at different locations. Recently, WSN has been widely used to monitor a location or place that is prone to a disaster[2]. By using the WSN device to monitor forest environmental conditions, when there is a potential fire, it is hoped that the device will be able to detect it and send a message to the nearest forest supervisor. However, in the process of placing the sensor, of course, you must pay attention to the distance between the sensors so that communication between sensors can run more efficiently. To get around this, an optimization algorithm called particle swarm optimization (PSO) is used. PSO is one of the optimization algorithms that are quite popular and is inspired by the behavior of groups of fish or birds in foraging[4]. In its application, after the sensor is placed by the optimization coordinates of the PSO algorithm, it is expected that the sensor will collect data in real-time so that in the event of a potential fire the system will respond in the form of a message so that related parties can deal with fires quickly. Based on this, the system design "Optimization of Deployment WSN Using the PSO Algorithm for Detecting Forest Fires was made". The system will be made by simulation, this is done to minimize unwanted things such as errors in sensor placement or other errors.
In this section, the general flow of the research that will be carried out by the author will be described, namely starting with determining the problem and then collecting data and information.
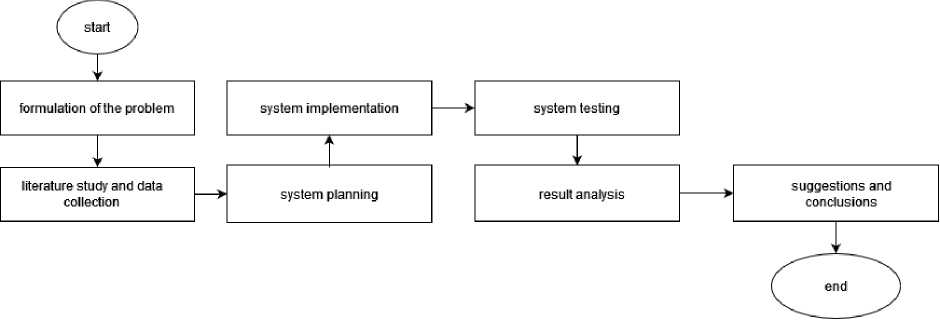
Figure 1. Research Flow
The system to be built is an implementation in a simulation. The simulation will be run with the software NS3 on Ubuntu 18.04 Linux Operating System.
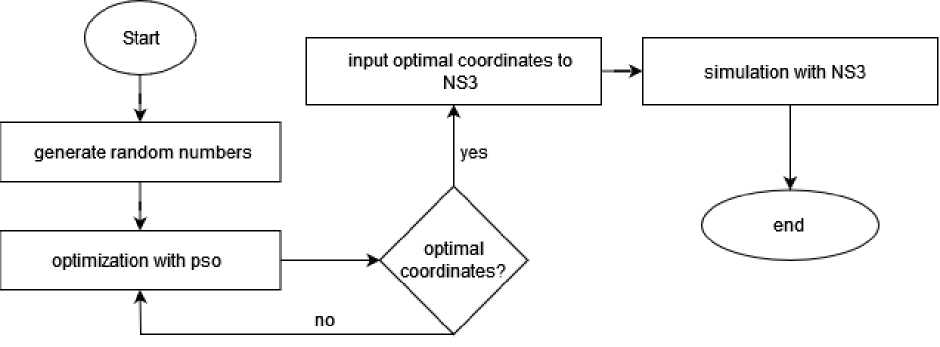
Figure 2. Simulation Flow
In this study, the simulation will be carried out using NS3 while the PSO optimization will be carried out using Google Colab.
Particle Swarm Optimization (PSO) was first introduced in 1995. The idea of PSO stems from the natural behavior of birds foraging for food. When a group of birds forages for food together, each bird will look around the area close to itself[2]. The following is a mathematical formulation that describes the position and velocity of particles in a certain dimension of space:
Xi (t) = xi1 (t), xi2(t),....,xiN(t) …………..(1)
Vi (t) = vi1 (t), vi2(t),....,viN(t) …………..(2)
Where:
X = Particle position
V = Particle velocity i = Particle index
t = Iteration to –t
N = Dimensions of space
The following is a mathematical model that describes the mechanism for updating the state of the particle Kennedy and Eberhart [1995]:
-
Vi(t) = vi(t - 1) + c^ (xf -Xi(t- 1)) + c2r2(XG -Xi(t-1) .........(3)
⅛ω = ½ω+*i(t-i)....................(4)
Where Xf = x[1,x[2,^,x[n represents the local best of the particle. While Xg = xG1,xG2,^,xGn represents the global best of the entire herd. While c1 and c2 are constants that have positive values which are usually referred to as learning factors. Then r1 and r2 are random numbers with values from 0 to 1. Equation (3) is used to calculate the new particle velocity based on the previous velocity, the distance between the current position and the local best position, and the distance between the current position. with the best position of the herd (global best). Then the particle flies to a new position based on equation (4). After the PSO algorithm is run with a certain number of iterations until it reaches the termination criteria, a solution that lies in the global best will be obtained[5].
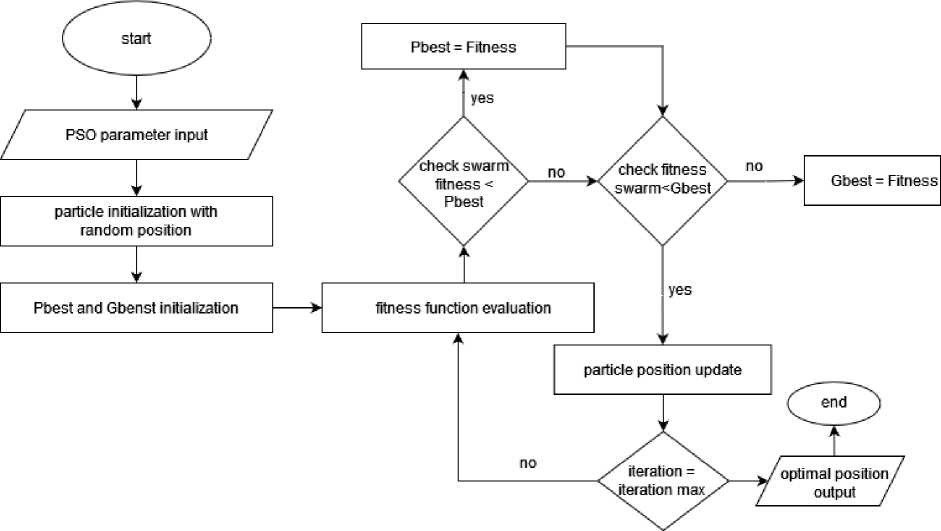
Figure 3. PSO Algorithm
In the figure, it can be seen that the optimization process begins by inputting several parameters such as the number of particles, the maximum number of iterations, and several other parameters. After determining the number of particles, the initialization of the position (X, Y) of each particle with random numbers is carried out using a linear congruential generator (LCG). From the position of each particle that has been determined, then initialized the Pbest and Gbest values. After all the values are obtained, the fitness value of each particle will be evaluated, and then the results are used to determine the Pbest and Gbest values in the next iteration. After that, the next process is to update the latest position of each particle based on the latest Pbest and Gbest values. At the final stage, it will be checked whether the iteration has reached the maximum iteration, if it has not eaten, an evaluation of the particle fitness function will be carried out and the process will be carried out as before. If the iteration reaches the maximum then the results of each iteration will be printed and the optimization process is declared
complete. The results of the optimization process for each iteration will then be tested in a simulation with NS3.
The simulation stage is carried out to test the connection between sensor nodes, testing is done by creating a hotspot node that sends fire messages to the nearest node. The fire message will then be sent to each sensor node and it will be seen which nodes are connected and which are not[3]. The simulation was carried out for 1500 seconds with the sensor coverage radius set at 100 meters. The number of nodes used in this simulation is 10 sensor nodes and 1 fire node. The simulation will be run per iteration until it reaches the maximum iteration, so there will be several simulations until it reaches the maximum iteration.
The results of the PSO calculation reach the maximum results in the 12th iteration of 30 iterations.
The following is the result of the 12th iteration.
Table 1. The most optimal PSO results in iteration 12
|
Iteration |
Node Sensor |
X |
Y |
|
12 |
Sensor 1 |
22.590523 |
34.094393 |
|
Sensor 2 |
40.471378 |
29.488389 | |
|
Sensor 3 |
20.5098 |
34.668839 | |
|
Sensor 4 |
28.421732 |
30.019085 | |
|
Sensor 5 |
17.184822 |
22.69669 | |
|
Sensor 6 |
25.440409 |
38.304829 | |
|
Sensor 7 |
24.444198 |
44.115399 | |
|
Sensor 8 |
43.317781 |
7.871107 | |
|
Sensor 9 |
16.623386 |
39.321243 | |
|
Sensor 10 |
31.836154 |
0 |
After the implementation of making the program is complete, then the program will be run with certain commands that have been previously configured. These commands will adapt to the simulation scenario being run. Before running the simulation, the program must be built and compiled first.
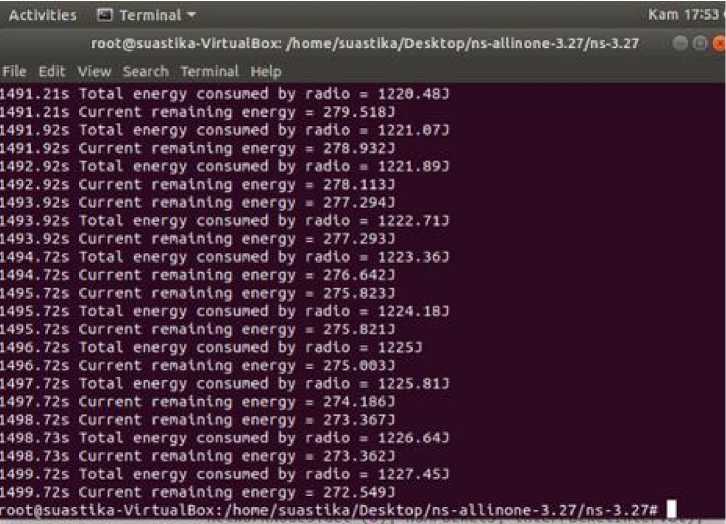
Figure 4. NS3 Run Results
After compiling, simulate NetAnim, by going to the NetAnim folder and running the command. (./NetAnim).
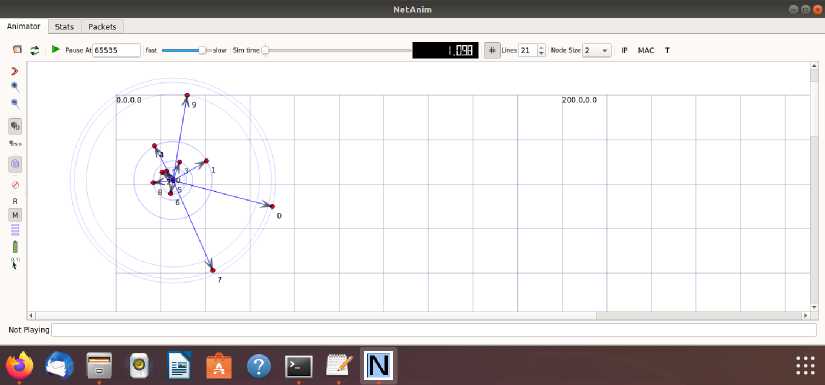
Figure 5. 12th Iteration Node Position

Figure 6. Iteration node communication
From the figure, it can be seen that all of the 10 nodes set up received the message. Based on this, of the 12 iterations carried out the 12th iteration is the most there are communicating nodes, namely 10 sensor nodes, it can be concluded that the results in this iteration can be considered the most optimal.
After the program is finished executing, it will produce output in the form of a .pcap file, the file is a file created for network analysis with Wireshark. Here is what the .pcap file looks like when run with Wireshark.
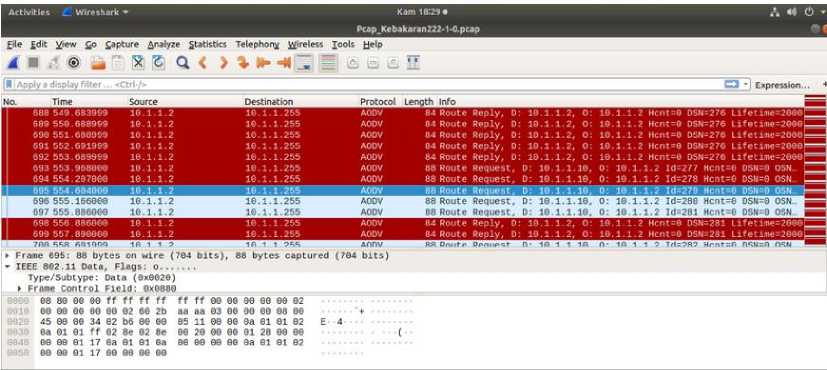
Figure 7. Pcap file node not receiving fire message
The image is a pcap file for the sensor node which is out of reach of other nodes so that the node does not receive any messages.
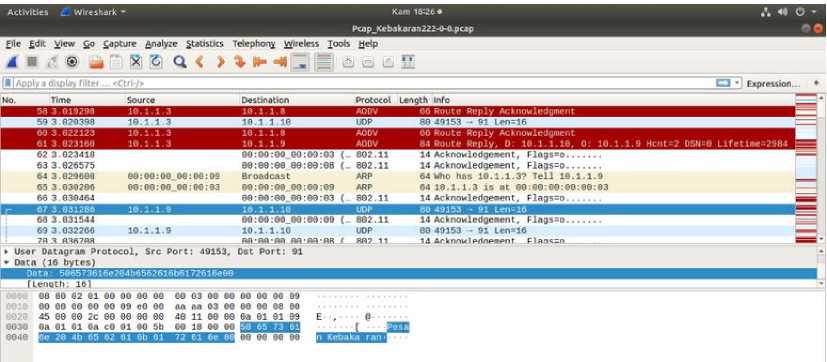
Figure 8. Pcap file node receiving fire message
From the two images, it can be seen that nodes connected to other nodes will communicate by sending text messages in the form of "Fire Messages".
-
3.4 Effect of Number of Iterations on Nodes receiving Fire messages
10 Nodes that receive Fire Messages
12
10
8
6
4
2
0
6 9 5 6 9 9 9 7 7 9 9 9 10

■ message receiver node
Figure 9 Graph of fire message receiving nodes
From the graph, it can be seen that the number of iterations affects the node that receives the fire message. In the implementation of the simulation in NS3, the distance of nodes that are too far is the main factor that affects node communication, the farther the distance between nodes, the more difficult or even impossible it is to communicate with other nodes. From the diagram, it can be seen that the last iteration, namely the 12th iteration, is the maximum iteration, this is evidenced by the number of nodes that can communicate, all of which are sensor nodes.
Based on the research and simulations that have been carried out, the following conclusions can be drawn:
-
• he sensor node Deployment Simulation process can run well on NS3 on Ubuntu 18.04 Linux Operating System. Simulations are carried out to determine the number of connected sensor nodes so that fire messages can be sent properly. The simulation visualization is shown using the NetAnim application, while the fire message delivery details are shown via a .pcap file.
-
• In the testing phase, each iteration of data on the PSO will be simulated so that it can be seen the number of nodes that are connected and which are not. The optimal level will be seen from how many nodes are connected in the iteration, the more nodes connected, the more optimal the results in that iteration.
References
-
[1] Mubarok, F. (2019, November 16). Retrieved from
www.mongabay.co.id:https://www.mongabay.co.id/2019/11/16/kebakaran-hutan-dan-lahan-terus-terjadi-bagaimana-solusinya/
-
[2] Christofer, G., Sujaini, H., & Irwansyah, M. (2015). Rancang Bangun Aplikasi Early Warning
dengan pemanfaatan Pengukuran Suhu Ruangan Berbasis Arduino Mega 2560.
-
[3] Marbun, Y., Nikentari, N., & Bettiza, M. (2015). Perbandingan Algoritma Genetika dan Particle
Swarm Optimization dalam Optimasi Penjadwalan Matakuliah. Jurnal Jurusan Teknik Informatika.
-
[4] Murdiansyah, D. T. (2016). Optimasi Jaringan Sensor Nirkabel Menggunakan Algoritma Two
Sub-Swarm PSO Diskrit. Journal On Computing.
-
[5] Rubiani, H., & Mulyatum, S. (2016). Deployment Jaringan Sensor Nirkabel Berdasarkan
Cakupan Area Sensor Node Menggunakan Algoritma Particle Swarm Optimization. Semnar Nasional Aplikasi Teknologi Informasi (SNATi).
428
Discussion and feedback