Classification of Typhus and Dengue Fever Using the Pseudo Nearest Neighbor Algorithm
on
p-ISSN: 2301-5373
e-ISSN: 2654-5101
Jurnal Elektronik Ilmu Komputer Udayana
Volume 11, No 1. August 2022
Classification of Typhus and Dengue Fever Using the Pseudo Nearest Neighbor Algorithm
I Dewa Ngurah Tri Hendrawana1, Ida Bagus Gede Dwidasmaraa2, I Gusti Agung Gede Arya Kadyanana3, I Putu Gede Hendra Suputraa4, AAIN Eka Karyawatia5, Ida Bagus Made Mahendraa6
aInformatics Department, Faculty of Mathematics and Natural Sciences, University of Udayana South Kuta, Badung, Bali, Indonesia 1dewahendrawan99@gmail.com
Abstract
Typhus and dengue fever are diseases that often occur in Indonesia. The spread of these two diseases is relatively fast with similar symptoms. This could be a fatal thing if there is a misdiagnosis. Therefore, an application was developed to assist in the classification of typhus and dengue fever based on the patient's clinical symptoms using the PNN (Pseudo Nearest Neighbor) algorithm. This application receives input in the form of clinical symptoms experienced by the patient, then a preprocessing process is carried out to convert user input into discrete data, and the results are processed in classification using the PNN method. From the validation process with 5-fold cross validation obtained the best k value is k=6. Then, the accuracy testing process concluded that the accuracy of the classification process for typhus and dengue fever with the PNN method is 68,97%. Then, from 25 respondents in the user acceptance test obtained that 88.4% of respondents strongly agree with the application design, 87.6% respondents strongly agree with the ease of application, and 86.6% respondents strongly agree with the efficiency provided by the application.
Keywords: Classification, Pseudo Nearest Neighbor, Typhus, Dengue Fever, User Acceptance Test
Typhus and dengue fever are public health problems that often occur in Indonesia. The spread of the virus from these two diseases is relatively fast, so the number of people with typhus or dengue fever tends to increase every year. In addition, the symptoms possessed by typhus or dengue fever also have similarities with each other. This can be fatal to the patient if an error occurs in the diagnosis. Therefore, a classification system was built on whether the patient had dengue fever or typhus based on the clinical symptoms experienced by the patient.
In this study, classification is done by applying Pseudo Nearest Neighbor in the process of diagnosing patients according to their clinical symptoms. Pseudo Nearest Neighbor (PNN) is a variant of the kNN algorithm that improves accuracy on small data. The PNN algorithm uses a combination of the weighted k-NN and the k-NN closest local average method [1]. PNN classifies by calculating the total distance between the test data and the k closest neighbors in each class by weighting proportionally based on the distance, then the class with the smallest total distance will be used as the class label [2]. In a study conducted by [1], it was discussed about the application of the PNN algorithm for the credit score classification of borrowers at banks. In this study, the smallest error range produced by the PNN algorithm was 20.75% with a value of k = 13.
Based on the research above, a classification system for typhus or dengue fever was built based on the clinical symptoms experienced by patients using the PNN (Pseudo Nearest Neighbor) algorithm. This research is hoped can help doctors and medical personnel to diagnose diseases based on clinical symptoms experienced by patients.
Hendrawan, Dwidasmara, Kadyanan, Suputra, Karyawati, and Mahendra Development of Typhus and Dengue Fever Detection Applications Using the Pseudo Nearest Neighbor Algorithm
The research begins with the literature study to find related references for this study. After that, it continued with the process of collecting data in the form of disease medical record data. Then based on the literature study, an application was built to classify typhus and dengue fever. The system that has been built is tested using the specified test method. And then the results of the testing process will be used as a conclusion in this study.
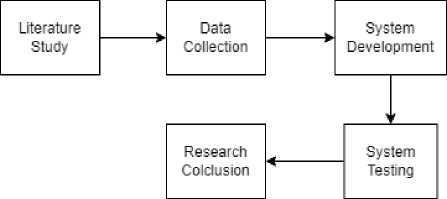
Figure 1. Research Flow
This research used primary data in the classification process. The data collected for this research is clinical symptoms of patients with typhus, dengue fever, and several diseases that have similar symptoms to typhus and dengue fever. Then the data collected was divided into 80% of training data and 20% of test data.
After all the data is collected, the research data was converted into discrete data using the ordinal encoding method. Ordinal encoding is a method used to convert categorical data into numeric data. In ordinal coding, each category is converted to an integer. This will have no effect on the number of categories, but only implies the order of the categories [3]. The purpose of this stage is to adjust the data so that it can be used in the classification process with the Pseudo Nearest Neighbor (PNN) algorithm.
K-Fold Cross Validation is one of the most used validation methods. It divides the data to be training data and testing data[4]. Training data is used to learn the data’s pattern, and the testing data is used to validate the model. The data is divided into similar amounts and then trained and tested in the k iteration, as in Figure 2. Researchers commonly used k=5 or k=10 to get a not-biased model [5].
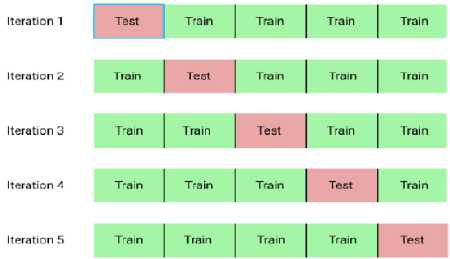
Figure 2. Illustration of 5-Fold Cross Validation
Pseudo Nearest Neighbor (PNN) is a variant of K-Nearest Neighbor which is developed from the Weighted k-Nearest Neighbor (WkNN) and local mean-based k-Nearest Neighbor (LMkNN) [1]. PNN calculates the total distance between k nearest neighbors in each class and test data with proportional weighting based on distance and concludes with the closest distance as the class for the test data [2]. PNN calculates the total distance from the test data with the number of k nearest
neighbors in each existing class with proportional weighting based on distance, then the class is determined based on the total closest distance obtained.
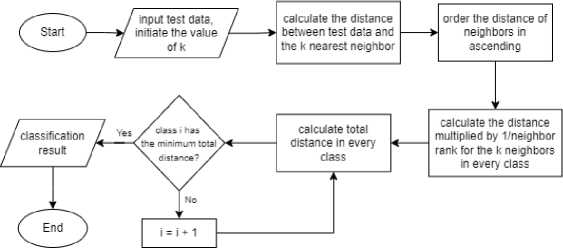
Figure 3. Classification with PNN
Based on the classification in Figure 3, a multi-label classification process was carried out to determine whether the patient had typhus, dengue fever, had both diseases, or other diseases. The multi-label classification flow can be seen in Figure 4.
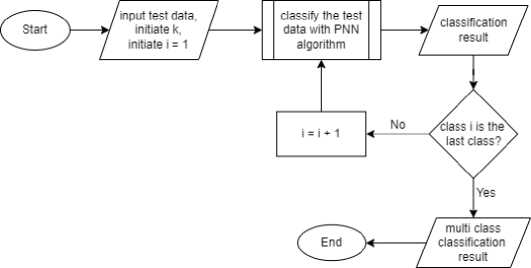
Figure 4. Multi Label Classification
In the multi-label classification, classification process is held twice. First classification to determine whether the test data was classified as typhus or not, and the second process is classification to determine whether or not the test data was included in dengue fever. From each processes the output produced is in the form of a value of 1 or 0 for each label being tested. The output in each label will be recorded, so, the conclusions obtained in the form [1,1] for patients with typhus fever and dengue, [1,0] or [0,1] for patients who have one of the two diseases, and [0, 0] for patients who do not suffer from typhus or dengue fever.
The system was developed using the waterfall model. This model was used because the system requirements are clear, the possibility of changes in system requirements is small, and this model only requires small resources in its implementation [6]. Waterfall method include analysis, design, implementation, testing, and maintenance.
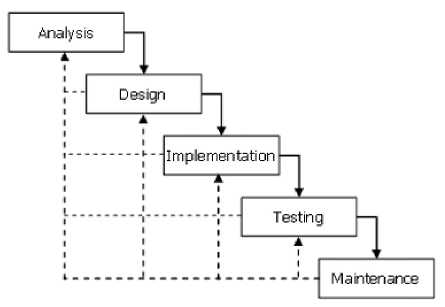
Figure 5. Waterfall Model
-
a. Analysis
Hendrawan, Dwidasmara, Kadyanan, Suputra, Karyawati, and Mahendra Development of Typhus and Dengue Fever Detection Applications Using the Pseudo Nearest Neighbor Algorithm The first step in waterfall model is analysis phase. Analysis phase is a description of the behavior of application to be developed. This step describes functional and non-functional requirements.
-
1. Functional requirements
Functional requirements are the requirements that will be implemented into the system. The functional requirements that will be made are as follows:
Table 1. Functional Requirements
|
No |
Requirements |
User |
|
1 |
Login and logout |
Admin & Petugas |
|
2 |
Admin can add new petugas, delete petugas, and access list of petugas |
Admin |
|
3 |
Use disease prediction feature and access the result |
Petugas |
|
4 |
Access patient list and patient details |
Petugas |
-
2. Non-functional requirements
The non-functional requirements that will be made are as follows:
Table 2. Non-functional Requirements
No Requirements
-
1 Only the registered users who can access the system
-
2 System can be accessed 24 hours
-
3 Web based system
The Unified Model Language (UML) was used to design the system. UML allows developers to easily make the systems blueprint, so it is easy to understand and it could be an effective way to communicate the system design to the others [7]. UML has several diagrams for the developers, some of them are use case diagram, activity diagram, and sequence diagram.
-
1. Use Case Diagram
Use case diagram is a representation of functional requirements, so the system will be easily developed. In another word, a use case diagram is an explanation of system function from the user’s side [8]. So, use case diagram can describe the interaction that happens between the user (actor) and the system.
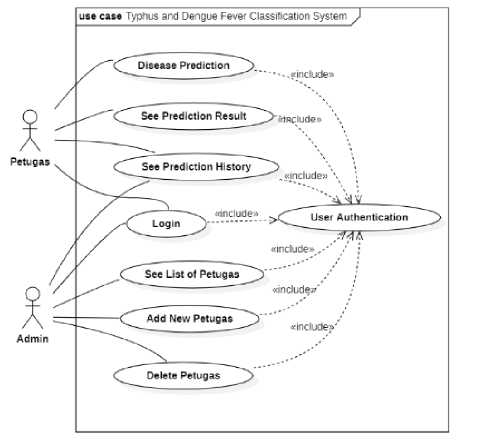
Figure 6. Use Case Diagram
-
2. Activity Diagram
An activity diagram is a description of the activity flows that happen in the system[7]. It is also describing how the activities started, the decision that might happen, and how it ended.
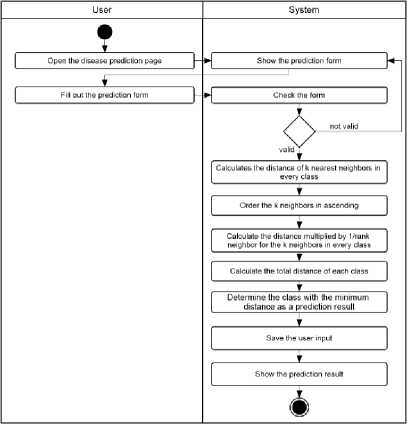
Figure 7. Activity Diagram
-
3. Sequence Diagram
Sequence diagram is an interaction diagram that describes the order of the system events. So, in the sequence diagram, the interaction between object/class has been described and it also indicates the communication that happens in the system [8].
interaction SequenceDiagramPrediciion J
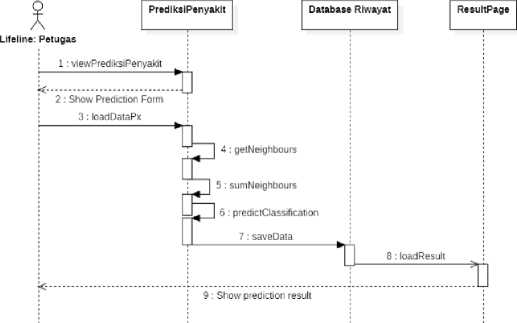
Figure 8. Sequence Diagram
Accuracy testing is carried out to find out how much accuracy is produced by the classification system for typhus or dengue fever with the PNN algorithm [9]. The accuracy rate is obtained by dividing the correct predictions by the number of the test data, the result obtained would be in the form of a percentage. To calculate the level of system accuracy, the following formula is used:
P(PN) =
Pn _____
rn × 100% n
(1)
Explanation:
-
• P(PN) = Accuracy rate
-
• Pn = The number of classification results by the system that deserves to be true
-
• n = Number of data tested
-
b. User Acceptable Test (UAT)
Hendrawan, Dwidasmara, Kadyanan, Suputra, Karyawati, and Mahendra Development of Typhus and Dengue Fever Detection Applications Using the Pseudo Nearest Neighbor Algorithm User Acceptance Test is carried out to find out what the system was doing, and to know the system assessment based on the end-user's point of view [10]. In this study, end-users are asked to use the system that had been built, then end-users are asked to answer a questionnaire regarding user ratings of the system with the linkert scale [11].
Table 3. Linkert Scale
|
Statement |
Scale |
|
Strongly Disagree |
1 |
|
Disagree |
2 |
|
Neutral |
3 |
|
Agree |
4 |
|
Strongly Agree |
5 |
Then the questionnaire result is calculated as follows:
p = ∑f×Ls χ 100% (2)
n× 5
Explanation:
P = Percentage
Ls = Linkert Scale
f = frequent of the answer to be choose
n = total respondent
After the percentage calculation, the conclusion of UAT process obtained as Table 4 [11].
Table 4. UAT Result
|
Percentage |
Conclusion |
|
0% - 20% |
Strongly Disagree |
|
21% - 40% |
Disagree |
|
41% - 60% |
Neutral |
|
61% - 80% |
Agree |
|
81% - 100% |
Strongly Agree |
This study used primary data in the form of clinical symptom data of typhus patients, dengue fever patients, and several other diseases in 2020 and 2021 which were obtained from the patient's medical record book at Buleleng District Public Hospital. From the data collection process, 290 data were obtained in the form of categorical and numerical data. Then the clinical symptoms data of each patient will be processed to be used in predicting the patient's disease.
After the data has been collected, the preprocessing stage then carried out. Attributes with categorical data type are converted into discrete data, using the LabelEncoder method found in the Scikit Learn library. From the results of preprocessing obtained datasets that are ready to be used in the classification process with the PNN method.
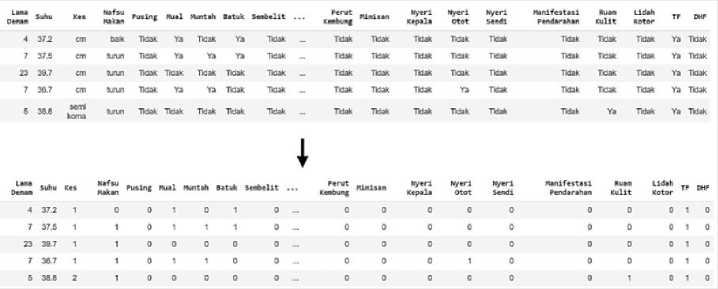
Figure 9. Preprocessing
Figure 9 shows the result of preprocessing process. All of the categorical data were converted into discrete data, so the data could be used in the calculation of PNN algorithm.
This research implemented 5-fold cross validation in the validation model process with 232 training data. To validate the model, 232 training data were divided into 5 similar sets and then were trained and tested in 5 iterations. To obtained the optimal accuracy, this research tested the value of k=1 until k=10.
Table 5. 5-Fold Cross Validation Result
|
K |
Accuracy in every iteration (%) | |||||
|
1st |
2nd |
3rd |
4th |
5th |
Average | |
|
1 |
19,57 |
34,78 |
17,39 |
23,91 |
23,91 |
23,91 |
|
2 |
21,74 |
23,91 |
19,57 |
17,39 |
21,74 |
20,87 |
|
3 |
23,91 |
19,56 |
26,09 |
21,74 |
17,39 |
21,74 |
|
4 |
21,74 |
28,26 |
17,39 |
26,09 |
17,39 |
22,17 |
|
5 |
34,78 |
21,74 |
32,6 |
21,74 |
28,26 |
27,83 |
|
6 |
28,26 |
30,43 |
19,56 |
32,6 |
30,43 |
28,26 |
|
7 |
34,78 |
26,08 |
26,08 |
32,6 |
13,04 |
26,52 |
|
8 |
17,39 |
17,39 |
23,91 |
17,39 |
30,43 |
21,3 |
|
9 |
17,39 |
17,39 |
28,26 |
32,6 |
23,91 |
23,91 |
|
10 |
15,21 |
17,39 |
19,56 |
30,43 |
28,26 |
22,17 |
From the Table 5, the optimal accuracy of the PNN is obtained by k=6 with an average accuracy of 28.26%. So that PNN algorithm with parameter k=6 is used as a model for the application in this research.
Implementation of the system interface was done by doing the coding process using HTML, CSS, JavaScript, and the Bootstrap framework. The result of the interface system are petugas login, home page, prediction, prediction result, prediction history, admin login, admin homepage, list of petugas, and add petugas. There are some of the application’s interface that has been deployed.
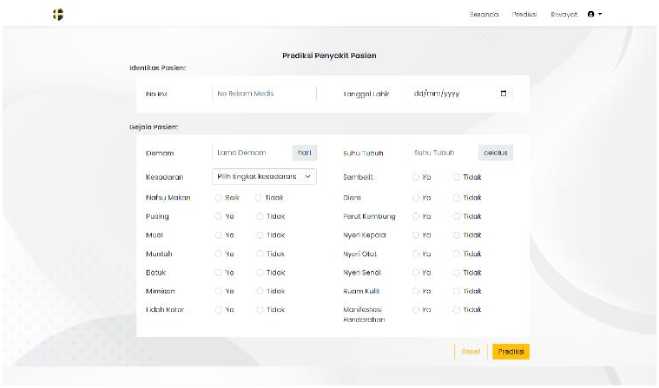
Figure 10. Prediction Interface
Figure 10 is where Petugas do the prediction. In this page, Petugas need to fill patient’s identity and symptoms. After all of the columns was filled by Petugas, then Petugas need to click ‘Prediksi; button to do the prediction.
Hendrawan, Dwidasmara, Kadyanan, Suputra, Karyawati, and Mahendra
Development of Typhus and Dengue Fever Detection Applications Using the Pseudo Nearest Neighbor Algorithm
I _ Beranda Prodiksi Hiwoyot θ ’
Hasil Prediksi Penyakit
No RM : 123435 Tgl Periksa: 2022-07-12
τgl Lahir: 2000-04-23 waktu Poriksa: 00:20:06
usia: 22 tahun Petugos: Petugas I
Gejala pasien:
-
• Demam 5 hr ’ Ma/Mi turun ∙ Kes cm
» Pusing » Diarc
Hasil Prediksl Slstem: TF
KemtKiIi
-
Figure 11. Prediction Result Interface
Prediction result page contains information about the prediction result done by Petugas. In this application there are four types of output, first 'TF' which means typhus, the second one is 'DHF' which means dengue fever, then there is 'Penyakit Lain' which is mean the patient neither has typhus or dengue fever, and the last one is 'TF dan DHF' which is mean that the patient suffers typhus and dengue fever.
Riwayat HasilPrediksi
Hasil
NolRM Igllaliir WaktuPeriksa CcjqIaPcnyakit Prcdiksi Aksi
|
111111 |
1999-12-31 |
2022 05 27 12X13:28 |
Dorram 5 hari, Natsu makan turuι∖ Muaj Parut Kembung. Mknlsanl Manirestasl Penciaranan |
TF |
O |
|
142577 |
2000-02 20 |
2072-05-22 0323138 |
Camom 7 hari. Nalsu makan turu∏.. Mual |
TF |
O |
|
267174 |
2003-06-Ii |
2022-06-06 lt⅛14∕ |
Cernam 3 hari. Nafsu makan turun, Batuk |
DHF |
O |
|
B55B92 |
2004-02-□1 |
2022 05 05 1143:41 |
Cerram 3 hari. Nafsu makan balk. Pusing, Mual. Batuk |
Penyaklt Laln |
O |
|
B31272 |
2314 03 □1 |
2022 05 05 IZ4224 |
Cerram 7 hari, Natsu makan turun, Mual. Nyerl Kepala |
TF |
O |
|
470469 |
1970-0301 |
2022-05-05 10:10:21 |
Damom 4 hari, Natsu makan tururχ Muaj Muntah, Diaro |
DHF |
O |
|
111230 |
1804-00-OS |
2022-05-05 OliSdi |
Demam 6 hari. Natsu makan turun Pusing, Batuk |
TF |
e |
-
Figure 12. Prediction History Interface
Prediction history page contains all the prediction that has been done by Petugas. From this page, Petugas can access the patient’s detail by clicking the button in the right columns.
Frebrirtor App
S IiiwiyatPiediksi
|
Daftar Petugas | |||
|
Dashboard / Petugas | |||
|
SDAile-SeljiuhFetugss |
∣÷r. ,. | ||
|
No LtscniaiTK |
Nanw Lengkap |
Holc |
Aksi |
|
1 pelugaβ1 |
PKugML 1 |
petugas |
■ |
|
2 ndmiπ1 |
Ariin n t |
UVitin |
8 |
|
3 pehκjas2 |
FKugas 2 |
petugas |
8 |
C∞yrtght4' HoBrtrarikUS
-
Figure 13. Petugas List Interface
Figure 13 is a page of list Petugas. From this page, Admin can see Petugas information, add new Petugas, and delete Petugas. Admin can click the '+Petugas' button to add new Petugas and has to click the trash icon to delete Petugas.
After the PNN algorithm has been successfully implemented in the system, an accuracy test is carried out to determine how accurate the application can classify patient’s diseases. In this process, all of the 290 data that have been collected were divided into 58 test data and 232 training data. This process calculates the result by dividing the total correct predictions of the application by the total test data used. From the testing process, the accuracy obtained from the implementation of PNN with k=6 as the model in the application is 68.97% with total 40 correct predictions by the application.
-
b. User Acceptance Test (UAT)
User Acceptance Test is carried out to know how users’ perception of the application that was developed. In this research, there were 25 participants in the UAT process. The participants of this test are doctors and nurses. In this test, the participants managed to answer a questionnaire in Google Form about their perception of the developed system. There were some statements about the user perception in the questionnaire, which the participants must respond to whether they agree or disagree with the statements, using the rating scale in Table 3. From the UAT process obtained a result as follows:
Table 6. UAT Score
|
Code |
Indicator |
Score |
Total Score |
% | ||||
|
SD (1) |
D (2) |
N (3) |
A (4) |
SA (5) | ||||
|
P1 |
Design |
0 |
1 |
1 |
10 |
13 |
115 |
92,0% |
|
P2 |
0 |
0 |
6 |
7 |
12 |
106 |
84,8% | |
|
P3 |
Easiness |
0 |
0 |
3 |
8 |
14 |
111 |
88,8% |
|
P4 |
0 |
0 |
4 |
9 |
12 |
108 |
86,4% | |
|
P5 |
Efficiency |
0 |
0 |
6 |
5 |
14 |
108 |
86,4% |
|
P6 |
0 |
0 |
5 |
6 |
14 |
109 |
87,2% | |
|
P7 |
0 |
0 |
3 |
7 |
15 |
112 |
89,6% | |
|
P8 |
0 |
0 |
4 |
12 |
9 |
105 |
84,0% | |
Based on the questionnaire’s result that has been carried out from 25 respondents, the average percentage value of the three indicators, namely design, easiness, and efficiency are as follows.
Table 7. Conclusion of UAT
|
Indicator |
Percentage (%) |
Description |
|
Design |
88,4% |
Strongly Agree |
|
Easiness |
87,6% |
Strongly Agree |
|
Efficiency |
86,8% |
Strongly Agree |
In Table 7, it is known that from 25 respondents in the user acceptance test obtained that 88.4% respondents strongly agree with the application design, then 87.6% respondents strongly agree that the application is easy to use, and 86.6% respondents strongly agree with the efficiency that given by the application.
This research succeeded in classifying typhus and dengue fever with the Pseudo Nearest Neighbor (PNN) algorithm. This research used a total of 290 data that divided into 232 training data and 58 test data. To get the most optimal result, this research used k-fold cross-validation to validate the best k value in the PNN algorithm. From the 5-fold cross-validation process, the best k in the range k=1 until k=10 is k=6, with an average accuracy of 28.26%. After the application was successfully built, several testing processes were carried out to find out how well the application could work. An accuracy test was carried out with 58 test data and the best accuracy rate obtained from the PNN model in this application was 68.97%. Then, from 25 respondents in user acceptance test obtained that 88.4% of them strongly agree with the application design, 87.6% respondents strongly agree with the eas e of application, and 86.6% respondents strongly agree with the efficiency provided by the application.
Hendrawan, Dwidasmara, Kadyanan, Suputra, Karyawati, and Mahendra Development of Typhus and Dengue Fever Detection Applications Using the Pseudo Nearest Neighbor Algorithm References
-
[1] H. Pratiwi, M. A. Mukid, A. Hoyyi, and T. Widiharih, “Credit scoring analysis using pseudo nearest neighbor,” Journal of Physics: Conference Series, vol. 1217, p. 012100, 2019, doi: 10.1088/1742-6596/1217/1/012100.
-
[2] Suyanto, Data Mining untuk Klasifikasi dan Klasterisasi Data, no. May. Bandung: Informatika, 2017.
-
[3] K. Potdar, T. S. Pardawala, and C. D. Pai, “A Comparative Study of Categorical Variable Encoding Techniques for Neural Network Classifiers,” International Journal of Computer Applications, vol. 175, no. 4, pp. 7–9, Oct. 2017, doi: 10.5120/IJCA2017915495.
-
[4] Y. Widyaningsih, G. P. Arum, and K. Prawira, “APLIKASI K-FOLD CROSS VALIDATION DALAM PENENTUAN MODEL REGRESI BINOMIAL NEGATIF TERBAIK,” BAREKENG: Jurnal Ilmu Matematika dan Terapan, vol. 15, no. 2, pp. 315–322, Jun. 2021, doi: 10.30598/BAREKENGVOL15ISS2PP315-322.
-
[5] H. Azis, P. Purnawansyah, F. Fattah, and I. P. Putri, “Performa Klasifikasi K-NN dan Cross Validation pada Data Pasien Pengidap Penyakit Jantung,” ILKOM Jurnal Ilmiah, vol. 12, no. 2, pp. 81–86, Aug. 2020, doi: 10.33096/ilkom.v12i2.507.81-86.
-
[6] A. K. A. Gumawang and A. Rakhmadi, “Pengembangan Sistem Perancangan Manajemen Usaha Kecil Menengah Bidang Kuliner dengan Metode Swot,” in The 7th University Research Colloquium 2018, 2018, pp. 159–170. Accessed: May 20, 2022. [Online]. Available:
http://repository.urecol.org/index.php/proceeding/article/view/30/27
-
[7] M. T. Prihandoyo, “Unified Modeling Language (UML) Model Untuk Pengembangan Sistem Informasi Akademik Berbasis Web,” Jurnal Informatika: Jurnal Pengembangan IT, vol. 3, no. 1, pp. 126–129, Jan. 2018, doi: 10.30591/JPIT.V3I1.765.
-
[8] Y. R. L. Kelen and B. J. Belalawe, “IMPLEMENTASI MODEL-VIEW-CONTROLLER (MVC) PADA UJIAN ONLINE MELALUI PENERAPAN FRAMEWORK CODEIGNITER,” 2018.
-
[9] R. Kohavi and F. Provost, “Glossary of terms. Machine Learning—Special Issue on Applications of Machine Learning and the Knowledge Discovery Process.,” Machine Learning, vol. 30, pp. 271–274, 1998, doi: 10.1023/A:1017181826899.
-
[10] D. W. Utomo, D. Kurniawan, and Y. P. Astuti, “TEKNIK PENGUJIAN PERANGKAT LUNAK DALAM EVALUASI SISTEM LAYANAN MANDIRI PEMANTAUAN HAJI
PADA KEMENTERIAN AGAMA PROVINSI JAWA TENGAH,” Simetris: Jurnal Teknik Industri, Mesin, Elektro dan Ilmu Komputer, vol. 9, no. 2, pp. 731–746, Nov. 2018, doi: 10.24176/SIMET.V9I2.2289.
-
[11] B. Priyatna, A. L. Hananto, and M. Nova, “Application of UAT (User Acceptance Test) Evaluation Model in Minggon E-Meeting Software Development,” Systematics Journal, vol. 2, no. 3, pp. 110–117, Dec. 2020, Accessed: Jul. 09, 2022. [Online]. Available:
https://journal.unsika.ac.id/index.php/systematics/article/view/4947
156
Discussion and feedback