VOCAL TONE PRECISION DETECTION USING HARMONIC PRODUCT SPECTRUM (HPS) AND K-NEAREST NEIGHBOR (KNN) CLASSIFICATION
on
p-ISSN: 2301-5373
e-ISSN: 2654-5101
Jurnal Elektronik Ilmu Komputer Udayana
Volume 10, No 3. February 2022
Vocal Tone Precision Detection Using Harmonic Product Spectrum And K-Nearest Neighbor Classification
Made Sri Ayu Apsaria1, I Made Widiarthaa2, Made Agung Raharjaa3, I Gede Santi Astawaa4, I Gede Arta Wibawaa5, Ida Bagus Made Mahendraa6
aInformatics Department, Faculty of Mathematics and Natural Sciences, University of Udayana South Kuta, Badung, Bali, Indonesia
1ayuapsaarii25@gmail.com 2madewidiartha@unud.ac.id 3made.agung@unud.ac.id 4santi.astawa@unud.ac.id 5gede.arta@unud.ac.id 6ibm.mahendra@unud.ac.id
Abstract
The progress of the digital era that is happening today, encourages rapid development in technology and science, one of which is in the field of art. Of all performing arts, the art of singing is the most complex, which requires a lot of preparation and practice. Everyone has a different type of voice. Males generally have three types of voice, namely bass, baritone, and tenor, while women generally have three types of voice, namely contralto (alto), mezzosoprano, and soprano. However, not everyone knows what kind of voice they have. Therefore, this study will focus on classifying the human voice. In this study, the author uses the Harmonic Product Spectrum (HPS) and K-Nearest Neighbor (K-NN) algorithms. The data used is in the form of primary voice recording data obtained from 258 participants (male and female), where each person has 8 sound files, namely do, re, mi, fa, sol, la, si, and do'. saved in .wav format. From the research conducted, the test was carried out using the K-NN and K-NN methods with Hyperparameters. The results obtained in the form of accuracy of 74% and 81%, so that the Harmonic Product Spectrum (HPS) and K-Nearest Neighbor (K-NN) algorithms give good results for determining the type of human voice.
Keywords : Harmonic Product Spectrum, K-Nearest Neighbor, vocal tone detection, vocal type classification, vocal range.
The progress of the digital era that is happening today, encourages rapid development of technology and science. Technological developments have changed various aspects of human life such as social, health, economic, and arts and culture aspects. Aspects of art and culture are changing quite rapidly due to technological developments, especially in the field of music. Music is a beautiful sound that can be heard. Sounds in music can be sourced from tools that are able to make sounds and are sourced from humans[11]
At first music could only be heard directly when the music was played, but with advances in technology, music can be heard at any time with the help of recordings. The emergence of various songs that match the interests of the community makes people creative by singing back songs that are on the rise using their own characteristics but still maintaining the originality of the song.
Of all performing arts, the art of singing is the most complex, which requires a lot of preparation and practice[8]. Everyone has a different type of voice where each type of voice has a different vocal range. Males generally have three types of voices, namely bass, baritone, and tenor, while women generally have three types of voices, namely contralto (alto), mezzo-soprano, and soprano.
The way that can be done to find out the type of voice you have is to compare your voice with a musical instrument, generally the musical instrument used is the piano[7]. In addition, the way that can be done to find out the type of voice is to do vocal lessons where a vocal coach will help find out the type of voice you have[10].
The suitability of the type of voice and tone with the song is important because if someone ignores this, the voice when singing seems discordant or false. This happens because not everyone who wants to know the type of voice has a musical instrument or goes through vocal lessons so that it becomes an obstacle when singing. With this phenomenon, we need a technology that can help detect the type of person's voice without having to use a musical instrument or visit a vocal coach.
Detection of musical instrument tones is also carried out on angklung musical instruments where the system used obtains optimal results with an accuracy rate of 88.78%[3]. The system with the Harmonic Product Spectrum (HPS) algorithm is used to see the basic frequency contained in the input signal then the K-Nearest Neighbor (KNN) classification method is used to detect and recognize the tone that is being played. The android-based guitar tuner application uses the Fast Fourier Transform (FFT) algorithm and the Harmonic Product Spectrum (HPS) algorithm.
The guitar tuner application works well and can help in the guitar tuning process[1]. In the study of chord and melody detection in fingerstyle wav files using the DWPT and K-NN methods, the results obtained are 99.07% for single chord detection, 100% for single note detection, and 83.11% average accuracy for detecting 40 fingerstyle music. In this study, the K-Nearest Neighbor (KNN) method was used as a classification method. The tones used as training data were 355 chord recording data and 125 single tone recording data. The data tested in this study were 195 chord recordings, 75 single note recordings, and 8 fingerstyle music, each of which was recorded 5 times.
The Harmonic Product Spectrum (HPS) algorithm is proven to be able to be used to determine the basic frequency of the tone and the K-Nearest Neighbor (KNN) classification can be used to classify sound types based on tone. In the study of music classification based on active frequency using the K-Nearest Neighbor (KNN) method can classify music with several different genres. The level of accuracy obtained in this study is 70%. Pitch detection using the Harmonic Product Spectrum (HPS) algorithm results in sharper harmonics in the spectrum[4].
Based on the explanation of the problems above, the author intends to conduct research to determine the accuracy of vocal tone detection using the Harmonic Product Spectrum (HPS) algorithm and determine the type of sound using the K-Nearest Neighbor (KNN) classification. The process carried out to detect vocal tones requires sound signal processing. so as to give the appropriate results.
A tone is a sound whose frequency has been set. IMC (International Music Council) has set the tone a' = 440, which means that the a' tone must vibrate 440 vibrations in 1 second, or in other words the a' tone = 440 vibrations per second[11].
There are four main types of voices in humans when singing, soprano and alto (contralto) for women, and tenor and bass for men. However, for each type there are subtypes such as mezzo-soprano for women, and baritone for In general, soprano and tenor voices have a higher range than alto and bass voices. Soprano is the highest voice type in women, with the most common subtypes being lyric and mezzo. Both can sing the same range, but lyric soprano has a lighter tone, while mezzo notes have a deeper tone. The lowest voice in women is (alto) contralto which is divided into two parts, namely the first and second alto. The first alto has a lighter tone, while the second alto is heavier[2].
|
Gender |
Vocal Type |
Vocal Range in Music Notation |
Vocal Range in Frequency(Hz) |
Fundamental Frequency Hz' ' |
|
Male |
Tenor (high) |
C3-C5 |
130.813 -523.251 |
16.35 |
|
Baritone (middle) |
F2-F4 |
87.3071 -349.228 |
21.80 | |
|
Bass (low) |
E2-E4 |
82.4069-329.628 |
20.60 | |
|
Female |
Soprano (high) |
C4-C6 |
261.626- 1046.5 0 |
16.35 |
|
Mezzo-soprano (middle) |
A3-A5 |
220.000 - 880.000 |
27.50 | |
|
Alto (low) |
F3-F5 |
174.614-698.45 6 |
21.80 |
Figure 1 Voice Type
Sound frequency is the number of vibrations or the number of vibrations that occur per second in a sound wave or sound wave. Frequency is also defined as the number of changes in pressure per second or frequency per second in units of cycles per second (cls) or Hertz (Hz). The nature of sound is determined by its frequency and intensity.
Based on the frequency, sound or voice is divided into three frequency regions, namely:
-
a. Sound frequency between 0 - 20 Hz (Infrasonic Area) This sound frequency, for example, is ground vibration, building vibration and car truck.
-
b. Sound frequency between 20 - 20,000 Hz (Sonic Frequency/hearing) Ear sensitivity dB = 0 occurs at a frequency of 1000 Hz, where the international average threshold value lies in the 1000 Hz area.
-
c. Sound frequency above 20,000 Hz (Ultrasonic Area) 16 In the medical field, this frequency functions in determining 3 things, namely: treatment, destruction/destructive and diagnosis. This is because the high frequency has a fairly large network penetration power.
|
Hote |
He |
Note |
He |
Note |
He |
Note |
He | |
|
Cl |
32.7 |
CZ |
65.4 |
C3 |
130.8 |
C4 |
261.6 | |
|
Cttl |
34.6 |
CttZ |
69.3 |
CttS |
138.6 |
CttJ |
277.2 | |
|
Dl |
36.7 |
DZ |
73.4 |
DS |
146.8 |
DJ |
293.7 | |
|
Dttl |
38.9 |
DttZ |
77.8 |
DttS |
155.6 |
DttJ |
311.1 | |
|
El |
41.2 |
EZ |
82.4 |
E3 |
164.8 |
E4 |
329.6 | |
|
Fl |
43.7 |
FZ |
87.3 |
FS |
174.6 |
FJ |
349.2 | |
|
Fttl |
46.2 |
FttZ |
92.5 |
FttS |
185.0 |
FttJ |
370.0 | |
|
Gl |
49.0 |
GZ |
9S.0 |
GS |
196.0 |
G4 |
392.0 | |
|
Gttl |
51.9 |
GttZ |
103.8 |
GttS |
207.7 |
GttJ |
415.3 | |
|
Al |
55.0 |
AZ |
110.0 |
A3 |
220.0 |
A4 |
440.0 | |
|
Attl |
58.3 |
AttZ |
116.5 |
AttB |
233.1 |
AttJ |
466.2 | |
|
Bl |
61.7 |
BZ |
123.5 |
BS |
246.9 |
BJ |
493.9 |
Figure 2 Grand Piano Frequency
-
2.4 Fast Fourier Transform (FFT)
Fast Fourier Transform (FFT) is a Fourier transform algorithm developed from the Discrete Fourier Transform (DFT) algorithm. The Fast Fourier Transform algorithm is very efficient in calculating the DFT coefficient and can reduce the enormous computational complexity. FFT is a method that converts signals from time domain to frequency domain. By using this FFT method, the computation rate of the Fourier transform calculation can be increased. The formula of the FFT method can be defined as follows in equation (1).
^[^] = ∑Nn=-11 x(n)WNkn (1)
-
2.5 Harmonic Product Spectrum (HPS)
Harmonic Product Spectrum (HPS) algorithm is an algorithm to determine the tone in the frequency domain[6]. This algorithm is also a pitch detection algorithm based on Fourier transform. This algorithm also takes advantage of the tendency of pitched musical signals to show strong harmonic structures. The algorithm works by down-sampling spectra and multiplying spectra[9]. Fast Fourier Transform (FFT) algorithm is used to represent signals in spectral form. If the input signal is a musical note, then its spectrum must consist of a series of peaks corresponding to the fundamental frequency with harmonic components. The downsampling process is the process of compressing the spectrum to get the fundamental frequency of the signal.
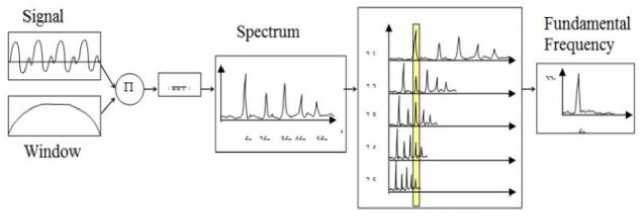
Figure 3 Harmonic Product Spectrum
-
2.6 K-Nearest Neighbor (K-NN)
K-Nearest Neighbor (KNN) algorithm is a method for classifying objects based on the learning data that is closest to the object[5]. This method is widely used in the field of pattern recognition. K-Nearest Neighbor classification is based on comparing the given test data with similar training data. The training data is described by n attributes. Each data represents a point in the n-dimensional space. In this way, all training data will be stored in the n-dimensional pattern space. When given unrecognized data, the K-Nearest Neighbor classification will look for a pattern space for the k training data closest to the unknown test data. This method has a way of working that is to find the closest distance from the value to be evaluated with its nearest neighbor in a data. At the classification stage, the same features will be calculated to perform data testing. The distance from the new vector to the entire training sample vector will be calculated and the closest number of k pieces will be taken.
Class 1
Class 2 '' New point

Featu re_2
Produksi Pribadi Penulis, Stephen Fordham
Figure 4 K-Nearest Neighbor
Python is a multipurpose interpretive programming language. Unlike other languages which are difficult to read and understand, python places more emphasis on code readability to make it easier to understand syntax. This makes Python very easy to learn both for beginners and for those who have mastered other programming languages.
This language first appeared in 1991, designed by a person named Guido van Rossum. Until now Python is still being developed by the Python Software Foundation. Python language supports almost all operating systems, even for the Linux operating system, almost all distributions already include Python in it.
The data used in this study is primary data. Data was obtained by recording the tones of 258 participants (male and female) recorded in .wav format. The audio format .wav or waveform is used because the sound data in this format has not been compressed so that it can be said that the waveform file is a raw file or pure data from recorded sound. In this study, the tone used is a single basic tone. Each note that is sung is a single basic note (do, re, mi, fa, sol, la, si, and high do). One participant has 8 files that will be used as system input. The training data and test data used in this study were divided into 70% and 30% of the total data.
The inputted data will go through several stages. The recording file is a file in .wav format. Then it will enter the preprocessing stage to equalize the input signal. At this stage consists of windowing and FFT. Then it converts the signal in the time domain into the frequency domain. Harmonic Product Spectrum (HPS) algorithm is then used to remove harmonic frequencies from the sound signal. Then the classification stage uses the K-Nearest Neighbor (KNN) method to determine the type of sound.

Figure 5 Flowchart System
At this stage the system created will be represented by a design or description including interface representation and coding procedures. This stage is also included in the representation of the appearance of the software that will be made. The system interface used in this study uses the desktop-based Python programming language using the PyQt5 framework. The system created has two pages, namely the front page and the classification page.
0 Dialog - [Preview] - Qt Designer

DETEKSI NADA VOKAL DAN KLASIFIKASI
JENIS SUARA MANUSIA menggunakan harmonic product spectrum dan k-nearest neighbor
MULAI
Figure 6 System GUI
Figure 6 is the front page of this system. This page is the initial display when the user starts the system. On this display there is a label and a “START” button. When the “START” button is clicked, the user will be directed to the next page, namely the classification page.

Figure 7 System GUI (1)
Figure 7 is this system’s classification page. This classification page is used to classify sound types based on files that have been inputted by the user. On this page there are buttons used to enter sound files, namely “Do”, “Re”, “Mi”, “Fa”, “Sol”, “La”, “Si”, and “Do'”. Then there is also the "CLASSIFICATION" button which is used to carry out the process of classifying the type of sound. The results obtained will be displayed in LineEdit.
The value of k in the K-Nearest Neighbor classification is the number of nearest neighbors used to determine the class of a data. The optimal value of k will increase the accuracy of the system. k = 2 to k = 23 will find the most optimal value to be used in the system. The amount of training data used is 180 data and the amount of test data used is 77 data with features, namely do, re, mi, fa, sol, la, si and do'.
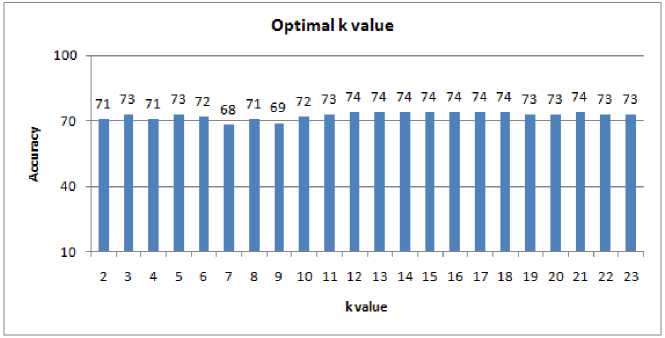
Figure 8 Optimal k Value
From figure 8, it can be seen that the k value with the highest accuracy lies in the k value between 12 to 22 and is at a stable accuracy of 73% and 74%.
The value of k in the K-Nearest Neighbor classification is the number of nearest neighbors used to determine the class of a data. The optimal value of k will increase the accuracy of the system. k = 2 to k = 23 will find the most optimal value to be used in the system. The amount of training data used is 180 data and the amount of test data used is 77 data with features, namely do, re, mi, fa, sol, la, si and do'. The optimal k value in the second way is with the K-NN Hyperparameter, where this Hyperparameter serves to increase the accuracy of the system to be made. The parameters used are leaf_size, p, and n_neighbor.
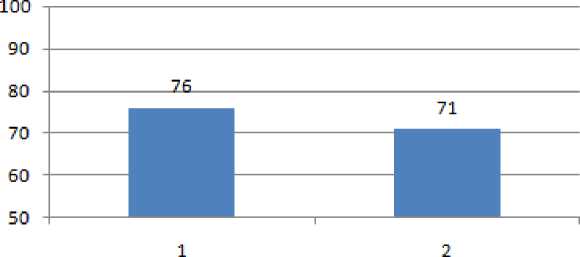
Best p value K-NN Hyperparameter Tuning
p value
Figure 9 The best p value of K-NN Hyperparameter Tuning
From figure 9 we can determine that the best p value is p = 1 with an accuracy of 76%.
Best k value K-NN Hyperparameter Tuning
S’ BO
Iiiiiiiiiiiiiiiiiiiiii
2 3 4 5 6 7 8 9 10 11 12 13 14 15 16 17 18 19 20 21 22 23
k value
Figure 10 Best k value K-NN Hyperparameter Tuning
From figure 10 we can determine that the best k value is k=10 with an accuracy of 71%.
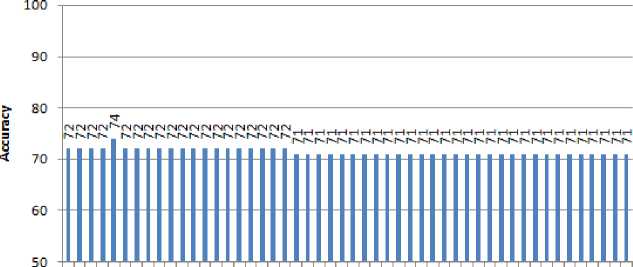
Best leaf size value K-NN Hyperparameter Tuning
1 3 5 7 9 11 13 15 17 19 21 23 25 27 29 31 33 35 37 39 41 43 45 47 49
leaf size value
Figure 11 Best leafsize value for K-NN Hyperparameter Tuning
From figure 11, it can be seen that the best leafsize value is leafsize = 6 with an accuracy of 74%.
The three parameters are searched for the best for the system by combining all the possible parameters used. The results obtained from K-NN using this hyperparameter are leaf_size=6, p=1, and n_neighbors=10. The K-NN model uses Hyperparameter Tuning with parameters leaf_size=6, p=1, and n_neighbors=10 resulting in an accuracy of 81%, so this K-NN model will be used in the system to classify the type of human voice.
Based on the analysis carried out, it can be seen that the K-NN model with Hyperparameter Tuning with parameters leaf_size=6, p=1, and n_neighbors=10 each has the highest accuracy. The test will be carried out using a confusion matrix. The test was carried out using a dataset of 258 audio files with the distribution of the training data as much as 180 data and the number of testing data as 77 data. This test is carried out using the parameters leaf_size=6, p=1, and n_neighbors=10.

Figure 12 System Result
Figure 12 is a classification page display with the files that have been entered and the results that have been displayed. In the picture, it can be seen that the result of the classification is SOPRANO, which means that the person has a SOPRANO type of voice.
From the implementation of the research that has been done and the results that have been obtained, the following conclusions can be drawn.
-
1. From the results of the research conducted, the K-Nearest Neighbor method can be used to classify the types of human voice well.
-
2. The accuracy obtained in classifying the type of sound using K-Nearest Neighbor is 74% with an optimal k value of k above 12 and the accuracy of K-Nearest Neighbor classification using Hyperparameter Tuning is 81% with the parameter used, namely leaf_size=6 , p=1, and n_neighbors=10.
-
3. The composition and amount of training data used greatly affect the accuracy of the system, with the amount of valid training data increasing the tendency of accuracy.
References
-
[1] F. Abdillah, “Implementasi Algoritma Fast Fourier Transform (FFT) dan Algoritma Harmonic Product Spectrum (HPS) pada Tuner Gitar Berbasis Android,” Jurnal Nuansa Informatika, vol.11, no.2, p.18-25, 2017.
-
[2] P.S. Phillips, Singing For Dummies, 3rd Edition, United States: Wiley, 2021, ch.1, pp. 15-25.
-
[3] R. Ashary, R. Patmasari and S. Saidah, “Sistem Deteksi Nada Alat Musik Angklung Menggunakan Metode Harmonic Product Spectrum,” e-Proceeding of Engineering, vol.6, no.1, p.1039-1046, 2019.
-
[4] M.I. Fauzi, R. Magdalena and B. Hidayat, “Deteksi Akor dan Melodi pada File Wav Gitar Fingerstyle Menggunakan Metode DWPT Dan K-NN,” JESCE : Journal of Electrical and System Control Engineering, vol.3, no.2, p.116-125, 2020.
-
[5] C.C. Aggarwal and S. Sathe, Outliner Ensembles: An Introduction, New York City: Springer International Publishing, 2017, ch.6, pp. 214.
-
[6] A.R. Jayan, Speech and Audio Signal Procesing, India: PHI Learning Pvt. Ltd., 2017, pp. 53.
-
[7] E. Lutters, Kunci Sukses Menjadi Aktor, Jakarta: Gramedia Widiasarana Indonesia, 2018, ch.2, pp.107.
-
[8] E.T.L.Caruso, E.Tetrazzini and L.Caruso, The Art of Singing, Germany: Outlook Verlag, 3rd Edition, 2018 pp.35.
-
[9] D. Zhang and K. Wu, Pathological Voice Analysis, Singapore: Springer Singapore, 2020, ch.3, pp. 49.
-
[10] R. Bale, Teaching with Confidence in Higher Education: Applying Strategies from the Performing Arts, United Kingdom: Taylor & Francis, 2020, ch.4.
-
[11] N. Simanungkalit, Teknik Vokal Paduan Suara, Jakarta: Gramedia Pustaka Utama, 2013, ch.1, pp.1-6.
260
Discussion and feedback