Implementation of K-Means Clustering Algorithm in Determining Classification of the Spread of the COVID-19 Virus in Bali
on
p-ISSN: 2301-5373
e-ISSN: 2654-5101
Jurnal Elektronik Ilmu Komputer Udayana
Volume 10 No. 1, August 2021
Implementation of K-Means Clustering Algorithm in Determining Classification of the Spread of the COVID-19 Virus in Bali
Putu Mas Anggita Putraa1, I Gusti Agung Gede Arya Kadyanana2
Informatics Department, Faculty of Math and Science, Udayana University South Kuta, Badung, Bali, Indonesia 1anggitaputra13@gmail.com 2gungde@unud.ac.id
Abstract
The COVID-19 virus or also known as SARS-Cov-2 is an infectious disease caused by the Coronavirus which attacks the human respiratory system. The COVID-19 case has affected all provinces in Indonesia, including Bali. There is a total of 7481 cases in Bali and this is due to the lack of understanding of the community towards the COVID-19 prone areas in Bali. Therefore, it is necessary to group the areas prone to COVID-19 in Bali. One of the clustering algorithms is K-Means, this algorithm uses several groups for the placement of some data with a partition system. The grouping will be carried out using data from the Bali COVID-19 Task Force website on September 18, 2020, using RapidMiner application. The results obtained divided Bali into 3 clusters with Denpasar as the center of the highest spread of COVID-19 in Bali as the red zone, then Badung, Buleleng, Bangli, Gianyar, and Karangasem in the yellow zone, and other districts in the green zone.
Keywords: Covid-19, K-means Clustering, Clustering, Data Mining, Bali
The COVID-19 virus or also known as SARS-Cov-2 (Severe Acute Respiratory Syndrome Coronavirus 2) is an infectious disease characterized by symptoms in the acute respiratory tract. This virus is a large family of Coronaviruses that commonly attack animals. The virus, which was first discovered in the city of Wuhan, China, spreads through human-to-human contact, through droplets of fluid from the mouth and nose when an infected person coughs or sneezes, similar to the way flu is transmitted. Diseases caused by this virus are the same as MERS (Middle East Respiratory Syndrome) and SARS (Severe Acute Respiratory Syndrome)[1] .
The spread of the COVID-19 virus is spreading rapidly to various parts of the world, including Indonesia. In early March 2020, in Indonesia, there were 2 reported positive cases of COVID-19 for the first time. And until September 2020, it was recorded that 236,519 people had tested positive for COVID-19 (source: covid19.go.id)[2] . The spread of the COVID-19 virus is almost evenly distributed in all provinces in Indonesia, including Bali Province, where up to 7481 positive cases of COVID-19 have been recorded in Bali (source: data collection.baliprov.go.id)[3] . This puts Bali in the 8th position with the highest positive cases of COVID-19 in Indonesia.
The high number of positive cases of COVID-19 in Bali is certainly troubling for many people, the rapid spread of the virus, and also causing negative impacts in various fields. This of course needs to be prevented to reduce the rate of spread of COVID-19 cases in Bali. The lack of understanding of the Balinese people regarding the COVID-19 prone areas in Bali and awareness of implementing health protocols are one of the factors in the increasing positive cases of COVID-19 in Bali. To overcome this problem, it is necessary to group the areas prone to COVID-19 in Bali.
K-Means is a clustering algorithm that is included in the Unsupervised learning group which is used to group data into several groups with a partition system. This algorithm can accept data whose class label is unknown and then group it. The K-Means algorithm can consist of several
clusters that have a central point called Centroid. In the application of the K-Means algorithm, the input received can be in the form of data and the desired number of clusters[4] .
In previous research by (Nayuni Dwitri et al, 2020) using the K-means algorithm to classify data on the spread of COVID-19 in Indonesia. The K-means algorithm divides the data into 3 clusters based on the highest level of the spread of COVID-19, in which DKI Jakarta Province is the center of the cluster so that it is considered the red zone with the highest spread of COVID-19. Judging from the results of previous research, it is hoped that this study can classify areas prone to COVID-19 in Bali based on 4 variables, namely the number of cases, the death rate, the number of people recovering, and the number of people who are being isolated so that they can inform the public not to visit or more be vigilant when visiting that area.
Data mining is a process of automatically searching for useful information in large data storage areas. Data mining is an analysis of data to find clear relationships and conclude that they were not previously known in a way that is currently understood and useful for the owner of the data[5] . Descriptive mining, which is the process of finding important characteristics of data in one database. Data mining techniques including descriptive mining are clustering, association, and sequential mining.
Clustering is a method of grouping data as seen from the similarity or proximity. The cluster has a different meaning from the group. Groups are similar conditions while clusters do not have to be similar, but the grouping is based on the similarity of the existing samples. For example, using the Euclidean distance formula. The Euclidean distance is the shortest in a data set to the centroid. Clustering is unsupervised learning, namely the process of dividing a group of data sets into clusters based on the similarities of the various attribute values of the data set. This aims to speed up computation time by acquiring quality clusters. A cluster is a set of data objects in the same cluster that are similar to one another and separated from other cluster objects[6] .
The K-means clustering algorithm is a data analysis method or data mining method that performs the modeling process without supervision (unsupervised) and is one of the methods that performs data grouping with a partition system. Two types of data clustering are often used in the process of grouping data, namely hierarchical and non-hierarchical, and k-means is a non-hierarchical or partitional clustering data clustering method. In classifying the data into several groups with several Clusters. Data are selected into several groups with predetermined criteria and then collected into one cluster, where each cluster has a central point called Centroid. Here are the steps to perform the optimization using the K-Means algorithm[7] :
-
a) Determine the number of clusters (k) desired
-
b) Determine the center point (Centroid) randomly
-
c) Calculate the distance of each point closest to the centroid using Euclidean Distance following formula:
k n
i=ι j=i
Explanation:
J = the distance between data point and centroid
Xji= jth to the data in the ith cluster
Ci = the ith centroid in the ith cluster
-
d) Recalculated center of the cluster members in the cluster, and then update the cluster center with the following formula:
Ni vn=⅛∑xk k=0
Keterangan:
Vlj = The average centroid in the ith cluster for the jth variable
Ni = Number of members of the ith cluster
ik = Index from cluster
j = Variable index
Xkj = The kth data value and the jth variable for the cluster
-
e) Recalculate each object using the new cluster center (new centroid), this is the initial stage of opening a new iteration. If cluster members do not experience cluster movement again, the clustering process is declared complete. However, if cluster members experience displacement, then return to step C until cluster members do not move again.
The methodology of this research article is simulation-based. Fig. 1 shows the stages of the research carried out in this article.
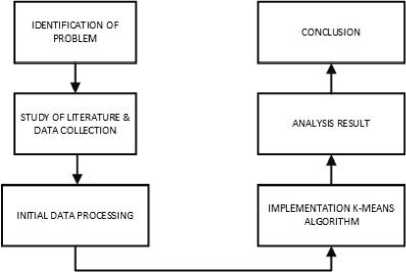
Figure 1. Flowchart Research Stages
In this research, problem identification aims to classify the area in the province of Bali by the high cases of Covid-19 there, whether it's about the number of people positive Covid-19, the number of people who died, the number of people who recovered, and the number of people who are in the isolation process. It is intended that we know which areas are the vulnerable cases Covid-19 in Bali so that it can increase our self-awareness to the dangers of this virus.
In this stage, the literature study to deepen the basic knowledge related to the method of data collection was appointed and, where data obtained is the data distribution COVID cases-19 in Bali. The data were sourced from the official website of the Task Force COVID Bali [3], which is composed of four variables: the number of positive votes, the number of deaths, the number of people cured, and the number of people in the healing process or being isolated. The following is the latest data obtained on September 18, 2020.
Table 1. Data on the Spread of COVID-19 di Bali
|
Indeks |
Province |
Positive Case |
Dead Case |
Healed Case |
In Treatment/Isolation |
|
1 |
Badung |
1144 |
28 |
724 |
392 |
|
2 |
Bangli |
668 |
28 |
598 |
42 |
|
3 |
Buleleng |
776 |
25 |
689 |
62 |
|
4 |
Denpasar |
2128 |
39 |
1850 |
239 |
|
5 |
Gianyar |
837 |
31 |
604 |
202 |
|
6 |
Jembrana |
207 |
5 |
180 |
22 |
|
7 |
Karangasem |
695 |
20 |
508 |
167 |
|
8 |
Klungkung |
579 |
8 |
550 |
21 |
|
9 |
Tabanan |
447 |
13 |
316 |
118 |
At this stage, the data obtained from the official website of the Bali COVID-19 Task Force [3] will be processed using the K-Means Clustering method. The data can be converted into an integer data format so that data can be processed in the program. The program is used in the processing of this data using the Rapid Miner application to determine the grouping data so that it can display the final results of grouping clustering.
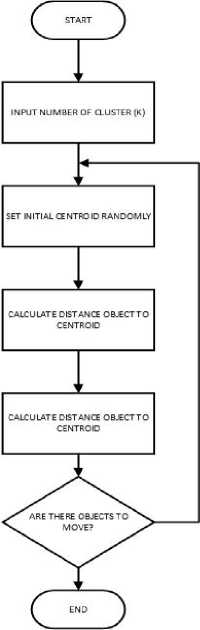
Figure 2. Flowchart K-Means Algorithm
At this stage the K-Means algorithm is used for the data grouping process, where the data obtained is then processed in several stages as follows:
-
1. Determine the number of clusters (k) desired
-
2. Determine the center point (Centroid) randomly
-
3. Calculate the distance of each point closest to the centroid using the equation formula ( 1 ).
-
4. Recalculate the cluster center with the members of the cluster, then update the cluster center with the equation formula ( 2 )
-
5. Recalculate each object using the new Cluster center (new Centroid), this is the initial stage of opening a new iteration. If Cluster members do not experience Cluster movement again, the Clustering process is declared complete. However, if Cluster members experience displacement, then return to step C until Cluster members do not move again.
At this stage, a manual calculation process is carried out in Microsoft Excel using the K-Means algorithm which can be seen as follows:
-
1. Determine the initial centroid from the data in Table 1. Data on the Spread of COVID-19 di Bali, the initial centroid selected here is C0 (Klungkung), C1 (Gianyar), and C2 (Bangli).
-
2. Calculate the distance of all data with each centroid using the formula equation ( 1 ), then group each data by centroid based on the closest distance between the data and the centroid according to the following example:
Province
Positive Case
Died Case
Recovered Case
In
Tre atment/lso I ation
cl
c2
cθ
Shortest Distance
cluster
Badung
1144
28
724
392
604.1125723
380.470761
698.2420784
380.470761
Cl
Bangli
668
28
598
42
0
232.8218203
105.1950569
0
C2
Buleleng
776
25
689
62
142.6674455
174.8770997
245.1530134
142.6674455
C2
Denpasar
2128
39
1850
239
1933.399597
1794.611379
2034.179441
1794.611379
Cl
Gia∏v≡r
837
31
604
202
232.8218203
0
320.5776037
0
Cl
Jembrana
207
5
180
22
623.0361145
780.8661857
524.6846672
524.6846672
co
Karangasem
695
20
508
167
156.5822468
175.2883339
191.5202339
156.5822468
C2
Klungkung
579
8
550
21
105.1950569
320.5776037
0
0
CO
Tabanan
447
13
316
118
366.5596814
492.3657177
285.681641
285.681641
CO
Figure 3. Calculating Data Distance with Centroid
-
3. Update the center of the existing centroid using the formula equation (2). Then if the value at the centroid point changes, iterate again until the center point of the centroid does not change.
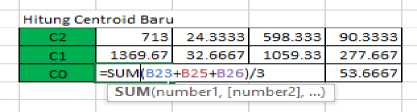
Figure 4. Updating the Center Point Centroid
-
4. The final result can be seen in the following figure:
Province
Positive Case
DiedCase
Recovered Case
Treatment/lsolation
cl
c2
cθ
Shortest Distance
cluster
Badung
1144
28
724
392
400.3047839
1503.217217
919.2901247
400.3047839
C2
Bangli
668
28
598
42
205.4437149
1933.399597
389.2860987
205.4437149
C2
Buleleng
776
25
689
62
137.0194147
1790.907591
530.0254711
137.0194147
C2
Denpasar
2128
39
1850
239
1790.680295
0
2319.224799
0
Cl
Gianyar
837
31
604
202
38.15127783
1794.611379
548.7175959
38.15127783
C2
Jembrana
207
5
180
22
775.6398133
2554.874948
235.9781063
235.9781063
CO
Karangasem
695
20
508
167
174.1077827
1964.687761
374.5072318
174.1077827
C2
Klungkung
579
8
550
21
379.3991566
2126.3511
206.3815237
206.3815237
CO
Tabanan
447
13
316
118
490.4768292
2279.08622
91.09884741
91.09884741
CO
824
26.4
624.6
173
2128
35
1850
239
411
8.66667
348.667
53.6667

Figure 5. Final Result of Manual Calculation
At this stage the implementation of the K-Means algorithm is carried out in the Rapid Miner application which can be seen as follows:
-
1. Import data into the RapidMiner application, where the data is input in the form of an excel sheet
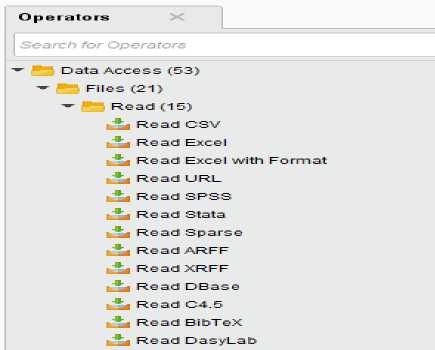
Figure 6. Import Data
-
2. Select the data range to be used, because the K-Means algorithm can only recognize INT (Integer) data types, so the data range blocks are integer types, from ranges C4 to F13.
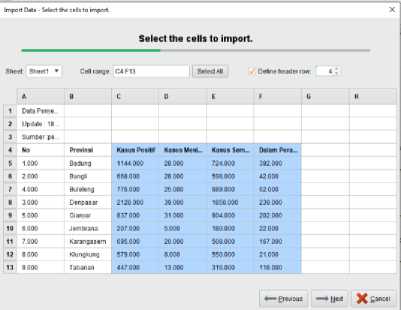
Figure 7. Imported Data Adjustments.
3. Determine the data processing model, then select the K-Means Model
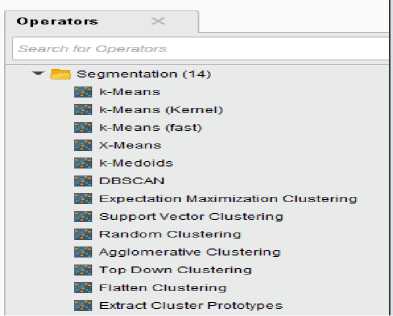
Figure 8. Selection of the K-Means Model
4.
Then on the parameter tab input, the number of clusters (k) specified, in this study using 3 clusters to group data into 3 categories, namely the red zone for the cluster with the largest data on the spread of COVID-19, the yellow zone for the cluster with moderate COVID-19 spread data. and the green zone with the smallest data on the spread of COVID-19. Then determine the maximum number of processes performed and the maximum number of iterations performed.
I Parameters
H Clustering (k Means)
H add cluster attribute
EJ add as label
□ remove unlabeled
max runs
measure types
divergence
max optimization steps
H determine good start val□(
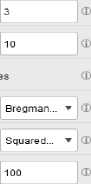
Figure 9. Determining parameters
5. Then select the Design tab and connect the data with the K-Means model
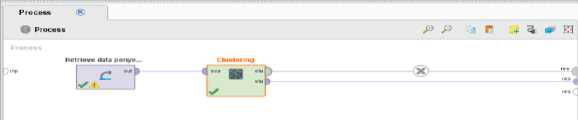
Figure 10. Connecting the K-Means Model
6. Then run the project and you will get the following results: A. Text View
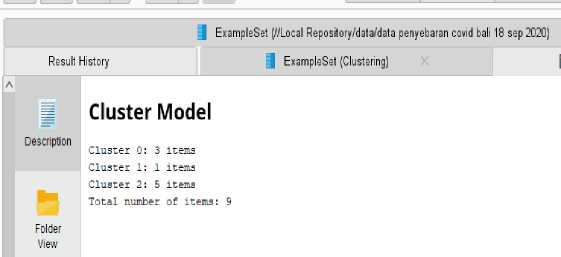
Figure 11. Result Text View
|
B. |
Table View | ||||||
|
Openin TurboPrep |
^∣ AutoModeI |
Filter (9 i 9 examples}: | |||||
|
Row No. |
id |
cluster |
Kasus Positif |
Kasus Meni... |
Kasus Sem... |
Dalam Pera... | |
|
1 |
1 |
cluster_2 |
1144 |
28 |
724 |
392 | |
|
2 |
2 |
cluster_2 |
668 |
28 |
598 |
42 | |
|
3 |
3 |
cluster-2 |
776 |
25 |
689 |
62 | |
|
4 |
4 |
ClusteM |
2128 |
39 |
1850 |
239 | |
|
5 |
5 |
cluster_2 |
837 |
31 |
604 |
202 | |
|
6 |
6 |
ClusterJ |
207 |
5 |
180 |
22 | |
|
7 |
7 |
cluster-2 |
695 |
20 |
508 |
167 | |
|
S |
8 |
ClusterJ |
579 |
8 |
550 |
21 | |
|
9 |
cluster 0ι |
447 |
13 |
316 |
118 | ||
Figure 12. Display of Clustering Result Data in Table
C. Plot View
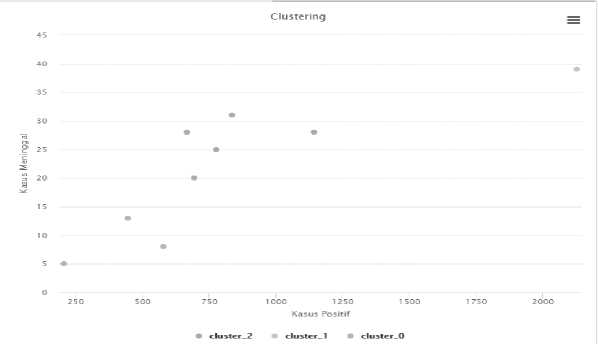
Figure 13. Results of Clustering Attributes of Positive Cases & Deaths
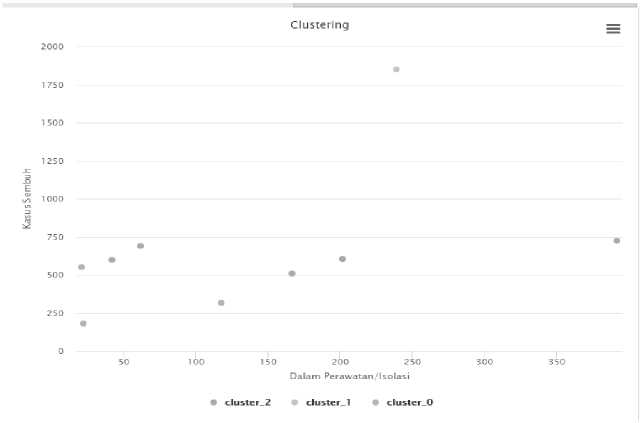
Figure 14. Results of Clustering Attributes of Cases Healed & Treatment / Isolation
Based on the results of the research conducted, the results obtained with the K-Means algorithm can group the data on the spread of COVID-19 in Bali into 3 clusters. Where from 9 district/city data, the cluster center is obtained, namely Denpasar City as the area with the highest level of COVID-19 spread so that it becomes a red zone. Then cluster two, namely Badung, Bangli, Buleleng, Gianyar, and Karangasem areas with a moderate level of distribution but the potential to become a yellow zone, so it must also be the center of government attention. And cluster zero, namely the Jembrana, Klungkung, and Tabanan areas, which are green zones with a fairly low level of COVID-19 spread.
References
-
[1] A.R. Setiawan, Lembar Kegiatan Literasi Saintifik untuk Pembelajaran Jarak Jauh Topik Penyakit Coronavirus 2019 (COVID-19) Jurnal Ilmu Pendidikan, Vol.2, No.1, 2020
-
[2] Satgas COVID-19 RI, Satuan Tugas Penanganan COVID-19, 17 September 2020. [Online]. Available: covid19.go.id. [18 September 2020]
-
[3] Satgas COVID-19 Bali, Data Sebaran Kasus COVID-19 Sampai Dengan Tanggal 2020-0918 di (BALI), 18 September 2020. [Online]. Available: pendataan.baliprov.go.id. [18 September 2020]
-
[4] N. Dwitri. J. A. Tampubolon and S. Prayoga, Penerapan Algoritma K-Means Dalam Menentukan Penyebaran Pandemi COVID-19 di Indonesia JurTI (Jurnal Teknologi Informasi), Vol.4, No.1, 2020
-
[5] E. H. S. Atmaja, Implementation of K-Medoids Clustering Algorithm to Cluster Crime Patterns in Yogyakarta International Journal of Applied Sciences and Smart Technologies, Vol.1, No.1, p.33-41, 2019
-
[6] F. M. Falahi, Penerapan Metode Clustering Untuk Pengelompokan Mahasiswa Potensial Drop Out Menggunakan Algoritma K-Means ++, Universitas Islam Negeri Sunan Ampel Surabaya, 2019
-
[7] J. Han. M. Kamber and J. Pei, Data Mining Concept and Techniques, Third Edition., Waltham: Elsevier Inch, 2012
28
Discussion and feedback