Specialty Coffee Cupping Score Prediction with General Regression Neural Network (GRNN)
on
p-ISSN: 2301-5373
e-ISSN: 2654-5101
Jurnal Elektronik Ilmu Komputer Udayana
Volume 9, No 2. November 2020
Specialty Coffee Cupping Score Prediction with General Regression Neural Network (GRNN)
Yuriko Christiana1, I Dewa Made Bayu Atmaja Darmawana2
aInformatics Department, Udayana University
Jalan Raya Kampus Unud, Badung, Bali, Indonesia 1yurikochristian@gmail.com 2dewabayu@unud.ac.id
Abstract
Coffee is a beverage highly appreciated in all around the world due to its natural product with varied aromas and tastes. The cupping score is a score for a coffee quality graded with an expert called Q grader. The cupping score will decide if a coffee may be called as specialty coffee. In this research, the cupping score will be predicted by the coffee properties and did not involve the Q grader for giving the score. The prediction of the score is obtained by using the GRNN method. The experiment consists of finding when the MAE and the MSE are converged and find the neuron's best number. The model's performance is measured with MSE and MAE with the best MSE value of 0.097 and MAE value 0.245.
Keywords: GRNN, Specialty Coffee, Coffee Cupping Score, Neural Network, Quality Prediction
Coffee is a beverage highly appreciated in all around the world due to its natural product with varied aromas and tastes [1]. The consumption of Arabica and Robusta coffee is increasing thoughout the years [2]. Indonesia is one of the top country in exporting igh variety Arabica coffee from different origins [2]. There are two types of previously mentioned coffee species, namely Robusta and Arabica. Arabica coffee consists of many varieties, including Bourbon, Typica, Paca, Pache, Caturra, Pacamara, Java, Ruiru, Geisha, and others [3]. To determine the quality of a coffee, an expert called Q grader must assess the quality of coffee based on the cupping score [1]. The aspects assessed in the evaluation include aroma, flavor, aftertaste, acidity, body, balance, uniformity, clean cup, sweetness, overall, defects, and total cup points [4]. Based on the total cup points value, the quality of coffee with a value above 80 may be called specialty coffee [4].
Several attempts have been made to predict the score of coffee quality. There is a study conducted to predict quality values based on aroma analysis and chemometrics using a solidphase microextraction (SPME) device and CG-FID parameters [5]. A study predicts quality values based on near-infrared spectra of green coffee beans [4]. In this study, the prediction of the quality value will be carried out, but using data on characteristics, varieties, and processing methods of coffee beans. The predicted value is the total cup points value using the general regression neural network (GRNN) method.
General regression neural network is a neural network method that predicts an output value based on the value that is used as input. If the variable to be estimated connects the output variable with the input variable, this method can model a process or system [6]. GRNN is a radial base network model that is usually used to approach a function [7]. The GRNN operation basis is essentially based on non-linear regression (kernel), where the estimate of the output expected value is determined by the set of inputs [8].
In this study, GRNN will be used to predict the total cup point value, and input into the GRNN model is country of origin, variety, processing method, humidity, category one defects, color,
category two defects, and altitude of the plantation. The dataset is obtained from the Kaggle website in the form of an assessment of coffee and its properties. The output produced from GRNN is the prediction of the total cup points, where this value determines whether a coffee product can be considered specialty coffee. Evaluation of model performance is measured using the mean square error (MSE) and the mean average error (MAE) measures. Experiments were carried out by finding the number of epochs and the number of neurons in the pattern layer, which resulted in the smallest MSE and MAE values from the GRNN results.
The research was conducted in several steps starting from data input, data preprocessing, training the GRNN model, and evaluating the GRNN model, which results in the measurement of MSE and MAE. The following is the research flowchart:
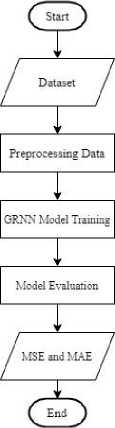
Figure 1. Research flowchart
The dataset used is the arabica coffee data titled "Coffee Quality database from CQI: A scrapped database from Coffee Quality Institute," which is obtained from the Kaggle website. The data obtained is still in the form of raw data containing attributes such as company, mill, farm name, and the others. The features used as input are the country of origin, variety, processing method, moisture, category one defects, color, category two defects, and the plantation's altitude. These attributes were chosen according to the characteristics, varieties, and processing methods because these attributes were considered to describe the quality of the coffee beans. Data in the form of categorical data is converted into numbers to be used as input into the model. Numeric data are normalized by min-max normalization.
An artificial neural network is an information processing system that mimics humans' biological neural networks [9]. The artificial neural network inputs are fed to the model in one or more hidden layers [9]. They are weighted and processed to decide the output in the next layer [9]. Artificial neural networks have been used in a wide variety of application domains, and their applications are useful in various fields [9]. In this study, GRNN is used to predict the total cup point value from the given data in the food sector.
GRNN is a development result of an artificial neural network. GRNN was initially developed by Specht [8]. GRNN is a model that can predict continuous outputs and fast in the training process [10]. Here is the architecture from GRNN.
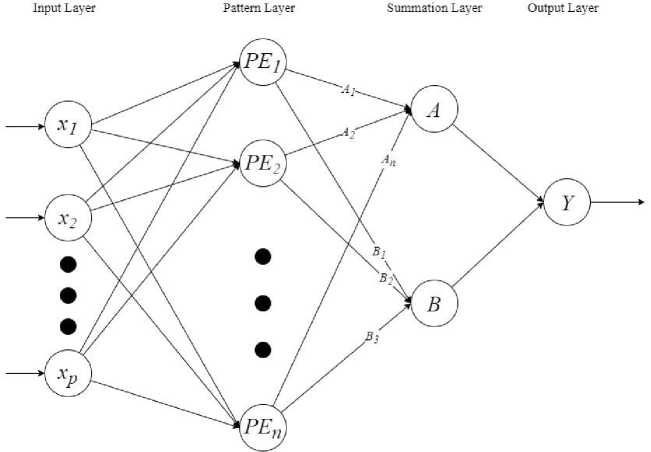
Figure 2. GRNN architecture
Assume the input vector x of p is independent, the random variable is used to predict the variable y [6]. GRNN is based on a non-linear regression theory which is formulated as follows:
ε[jw=!⅛≡: (1) l-∞f(×∙r)^r
Where y is the output predicted by GRNN, while X is the input vector (x1, x2, ..., xp) which consists of p variables [11], E [y | X] is the expected value of the output y given the input vector X, and f (X, y) is the joint probability density function of X and y [11].
GRNN architecture consists of 4 layers [11]. The first layer is input with eight neurons. The second layer is the pattern layer. The third layer is the summation layer. Moreover, the last one is the output layer with one neuron. The gaussian activation function is used for the pattern layer in the neural network model. The equation for the gaussian activation function [12] is as follows:
Y(X) = exp(-(X)2) (2)
Where X is the input vector of data. This equation will be used as an activation function in the neural network at the pattern layer. After training the neural network model, testing is carried out by providing test data input of 20 percent of the total dataset. Model performance is measured by mean square error and mean absolute error. MSE calculation equation is as follows:
MSE = 1∑(Xi - Yi)2
(3)
(4)
MAE calculation equation is as follows:
MAE = 1∑i∣Xi-Yi∣
Where Xi is the original data, and Yi is the prediction result of the model. The lowest MSE and MAE values are the configuration of the number of epochs and the best number of neurons in the pattern layer as predictors of output.
The GRNN method is implemented using the Keras library, a library that runs on the TensorFlow machine learning platform. The GRNN architecture used is as follows:
-
a. First layer: input layer with eight numbers of neurons
-
b. Second layer: a pattern layer with neurons that were varied during the experiment, namely eight neurons and 16 neurons with a Gaussian activation function
-
c. Third layer: summation layer with two numbers of neurons
-
d. Fourth layer: output layer with one neuron
After doing the first experiment with the 100 epochs, we plotted the MSE and MAE changes for each epoch and looked for which epoch MSE and MAE values began to converge. The following is a plot of the changes in MSE and MAE in each epoch.
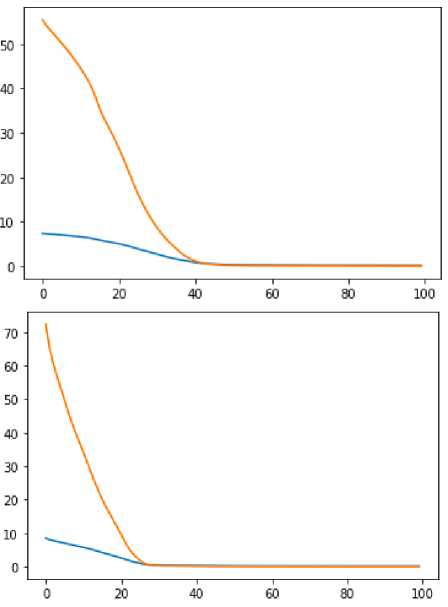
Figure 3. MSE and MAE value change by epoch with eight neurons in the pattern layer (left) and 16 neurons in the pattern layer (right)
Figure 3 shows that the MSE and MAE values when eight neurons are used, the value started to converge around the 40th epoch when the eight neurons are used. When 16 neurons are used, the value started to converge around the 25th epoch. This shows that the model's speed in learning the data is influenced by the number of neurons used. MSE and MAE value that converge earlier means the model has better training performance. The results of MSE and MAE values for each variation in the number of neurons and the number of epochs are as follows:
-
Table 1. MSE and MAE result
Pattern Layer Node Epoch MAE MSE
8 45 0.342 0.199
|
8 |
100 |
0.270 |
0.115 |
|
16 |
45 |
0.294 |
0.154 |
|
16 |
100 |
0.245 |
0.097 |
Table 1 shows the lowest MAE and MSE values in the variation is in the 16 neurons and 100 epochs. The difference between the results is not too significant, so for the training process, the number of epoch 45 is enough to give results that are not too different from epoch 100.
The total cup point in the cupping score must be made with the Q grader coffee expert. So in this research, those scores are predicted without involving the Q grader and predict the score by coffee characteristics and variety data. The prediction is resulting in state-of-the-art performance using the GRNN model. The result of the method used is measured with an MSE and MAE value with the best configuration of pattern layer neurons and the number of epochs. The best configuration is 16 neurons with 100 epochs resulting in MAE 0.245 and MSE 0.097.
References
-
[1] L. L. Pereira, W. S. Cardoso, R. C. Guarçoni, A. F. A. da Fonseca, T. R. Moreira, and C.
-
S. ten Caten, “The consistency in the sensory analysis of coffees using Q-graders,” Eur. Food Res. Technol., 2017, doi: 10.1007/s00217-017-2863-9.
-
[2] S. P. Putri, T. Irifune, Yusianto, and E. Fukusaki, “GC/MS based metabolite profiling of
Indonesian specialty coffee from different species and geographical origin,” Metabolomics, 2019, doi: 10.1007/s11306-019-1591-5.
-
[3] P. Poltronieri and F. Rossi, “Challenges in Specialty Coffee Processing and Quality
Assurance,” Challenges, 2016, doi: 10.3390/challe7020019.
-
[4] K. Tolessa, M. Rademaker, B. De Baets, and P. Boeckx, “Prediction of specialty coffee
cup quality based on near infrared spectra of green coffee beans,” Talanta, 2016, doi: 10.1016/j.talanta.2015.12.039.
-
[5] J. S. Ribeiro, F. Augusto, T. J. G. Salva, and M. M. C. Ferreira, “Prediction models for
Arabica coffee beverage quality based on aroma analyses and chemometrics,” Talanta, 2012, doi: 10.1016/j.talanta.2012.09.022.
-
[6] D. F. Specht, “A General Regression Neural Network,” IEEE Trans. Neural Networks,
1991, doi: 10.1109/72.97934.
-
[7] Y. Feng, Y. Peng, N. Cui, D. Gong, and K. Zhang, “Modeling reference
evapotranspiration using extreme learning machine and generalized regression neural network only with temperature data,” Comput. Electron. Agric., 2017, doi:
10.1016/j.compag.2017.01.027.
-
[8] Y. Xie, C. Li, Y. Lv, and C. Yu, “Predicting lightning outages of transmission lines using
generalized regression neural network,” Appl. Soft Comput. J., 2019, doi:
10.1016/j.asoc.2018.09.042.
-
[9] A. Shenfield, D. Day, and A. Ayesh, “Intelligent intrusion detection systems using
artificial neural networks,” ICT Express, 2018, doi: 10.1016/j.icte.2018.04.003.
-
[10] M. del R. Martinez-Blanco et al., “Generalized Regression Neural Networks with
Application in Neutron Spectrometry,” in Artificial Neural Networks - Models and Applications, 2016.
-
[11] L. P. W. Adnyani and Subanar, “General Regression Neural Network ( GRNN ) Pada Peramalan Kurs Dolar Dan Indeks Harga Saham Gabungan ( IHSG),” Factor Exacta, 2015.
-
[12] C. E. Yarman, “Approximating fractional derivative of Faddeeva function, Gaussian function, and Dawson’s integral,” 2019, doi: 10.1002/mma.5679.
190
Discussion and feedback