Quantization-Based Novel Extraction Method Of EEG Signal For Classification
on
p-ISSN: 2301-5373
e-ISSN: 2654-5101
Jurnal Elektronik Ilmu Komputer Udayana
Volume 9 No. 2, November 2020
Quantization-Based Novel Extraction Method of EEG Signal for Classification
Ni Putu Dewi Angrenia1, Agus Muliantaraa2, Yuriko Christiana3
aInformatics Department, Udayana University
Bali, Indonesia 1angrenidewii13@gmail.com 2muliantara@unud.ac.id 3yurikochristian@gmail.com
Abstract
In the pattern recognition field, features or object’s characteristics are one of the key points to recognizing them. The feature extraction process will see that objects have different features, where the features are obtained through the analysis process from the extractor, such as for data statistics, energy, power spectral, and so on. This study aims to enrich the point of view of EEG signal features by quantifying the signal. It will be analyzed whether the features obtained by quantization represent the EEG signal object from different viewpoints. This research uses the DEAP dataset, with the result being a feature vector that will be included in the artificial neural network classifier using the Keras library. The experiment carried out is to try to enter quantized and Non-quantized feature vectors into the classifier. As a result, the accuracy of the classification process with the quantization vector was 75%, and the accuracy in the Nonquantized vector classification process was only 58%. These results indicate the EEG signal quantization feature can represent the EEG signal object.
Keywords: EEG signal, quantization, DEAP, feature extraction, pattern recognition
Machine Learning (ML) or machine learning is an approach in Artificial Intelligence that is widely used to replace or mimic human behavior to solve problems or automate. In the Machine Learning area, generally, the data used as input in the machine is a feature that can represent or represent an object in the process of classifying the object itself. The classification itself is a method in machine learning that is used by machines to sort or classify objects based on certain characteristics [1]. An object certainly has different characteristics or features when viewed from the process of getting the features or features it has. That way, the detection of an object can not only be seen from one point of view or one feature, but also from another point of view. To detect an object in more detail requires a lot of features. The more the number of features, the more complex and detailed the features will be so that it has an impact on classification.
The features of an object are obtained through the feature extraction process which is the process of analyzing the object from a certain point of view, for example from data statistics, changes in frequency from time to time, energy, zero-crossing rate (ZCR), pitch, spectral power and so on [2]. One of the efforts that can be made to enrich the object's features is through a process known as quantization. The general use of quantization is for the conversion of a continuous signal into a discrete signal in the digitization process through a device called an analog-to-digital converter (ADC), where an analog or continuous signal will go through 3 processes consisting of sampling, quantization, and coding. A continuous or analog time signal is interpreted at each time value and taken for the values in a continuous-time interval. Meanwhile, discrete or digital time signals are interpreted only at specific time values and are usually taken at the same time intervals [3]. The quantization process is the process of rounding data values into certain predetermined numbers. The more levels used, the more accurate signal data is stored. However, this will result in large data sizes and a long process.
Meanwhile, the coding process provides a code for each quantized signal data based on the occupied level [4].
The object of research in this study is the brain wave signal which is commonly known as signal EEG. The EEG signal data used is a secondary dataset, namely the DEAP dataset1. The DEAP dataset consists of recorded EEG data from 32 research subjects with a stimulant in the form of 40 music videos given to subjects in each experiment. EEG signal data recording refers to the international system standard 10-20 by using 32 channels. EEG signal itself is one of the biosignals produced by neurons in the brain and transmitted through the surface of the human scalp and can be used to analyze epileptic diseases, sleep disorders, brain paralysis, or emotions. EEG refers to the recording of the brain's spontaneous electrical activity over a short period, usually 20-40 minutes via electrodes attached to a part of the cortex of a person's head [5].
In previous research, several studies have been carried out related to the feature extraction of EEG signals from various perspectives. One of them is a study related to feature extraction of EEG signals by performing statistical analysis of signal data to find out signal information that can distinguish signals from one another. There are several statistical features used in this study, namely the peak to peak value, the average value of the amplitude, the mean value of the amplitude, the standard deviation, skewness, kurtosis, the absolute average value of the first and second derivatives, and the normalized value of the mean. These static features are taken from each channel that has been previously selected which is the characteristic of each signal to be clustered [6]. Then, in other studies, EEG signal feature extraction using power spectral was carried out with the consideration that the power spectral can provide information for each frequency from the data processed into the system, where previously the data was still in the time domain. Another consideration is that spectral power provides a faster computation time for real-time identification. [7]
Based on the background and previous studies, the focus of this study that distinguishes it from previous studies is that in this study, a feature extraction analysis study of EEG signals was carried out from a new perspective, namely, signal quantization. The purpose of this study is to analyze whether the EEG signal features obtained based on signal quantization can represent the EEG signal itself from different points of view. The EEG signal will be analyzed through its features based on the quantization of the signal that has been successfully implemented. The output of this research is in the form of feature or feature vectors resulting from the quantization process, where the feature vectors will then go through the classification process. This classification acts as a method of evaluating the quantization output using the Neural Network classifier which is implemented with the Keras library. In this process, there are two experiments, namely comparing the classification of the quantization feature vector with the feature vector without quantization. Then the accuracy of each experiment will be sought to determine which experiment gives better performance in the classification process.
This research is divided into several stages including literature study, data collection, feature extraction, classification, and system evaluation. At the literature study stage, the authors search, collect, learn, and understand the information and literature needed in making and implementing research. Furthermore, the data used in this study are secondary data, namely EEG signal data to analyze emotions obtained from the DEAP Dataset. DEAP Dataset is a multi-modal dataset for the analysis of human affective states. The initial stage through which the EEG signal data is passed is a normalization of the Min-Max data. Then, the next stage is the main stage in this research, namely feature extraction which includes the process of frame blocking, windowing, and quantization of the EEG signal to obtain features from different points of view. Furthermore, the feature extraction output is classified. Then, the final stage in the research is an evaluation to calculate the correct results in the study and get an accuracy value. The following is a general EEG signal quantization research design:
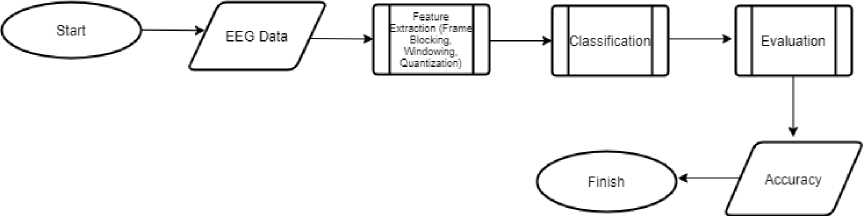
Figure 1. Research Design Flowchart
At this stage, the writer searches to collect, learn, and understand the information and literature needed in making and implementing research. Information and literature are obtained from book literature and other related information sources.
In this study, the EEG signal dataset used is a dataset that has gone through the Python version of the preprocessing stage, where the EEG signal data has been down-sampled to 128 Hz, the artifacts have been removed, and so on.
There are 40 channels in this dataset where channels 1-32 are channels for EEG signals placed based on the international system 10-20, and channels 33-40 are data signals for hEOG, vEOG, zEMG, tEMG, GSR, respiration belt, Plethysmograph and. In this study, the authors only use EEG signal recording, namely data signals on channels 1-32 and ignore signals that are not EEG signals. A file with a .dat extension representing one research subject from a total of 32 .dat files will be extracted into 40 CSV files. The number of CSV files is a representation of the number of trials when recording an EEG signal. Then in each trial, there are 40 channel rows used in the dataset and 8064 data sample columns.
Table 1. DEAP Dataset Content
|
No |
Category |
Value |
|
1 |
Subject |
32 |
|
2 |
Video |
40 Video |
|
3 |
Rating Scale |
Arousal, Valence, Dominance, Liking |
|
4 |
Rating Value |
Value scale 1-9 |
|
5 |
Recorded Signals |
Peripheral physiological signals, Face video (on 22 subjects) |
-
2.3 Feature Extraction
-
2.3.1 Frame Blocking
-
The first step carried out in the feature extraction series is frame blocking where the signal is divided into several frames. Each frame contains signal points according to the frame length. The frame length that is usually used for signal processing is between 10-30 ms. Besides, this process is generally done in an overlapping manner for each frame. The overlap length that is commonly used is approximately 30% - 50% of the frame length. Overlapping is done to avoid losing the characteristics of the signal at the intersection of each frame.
To calculate the frame blocking process with overlap, the following formula is used.
y(ri) = x(n + M') (1)
where :
M = overlapping frames obtained from multiplying the amount of data with the
length of the frame
N = number of data
-
n = data index
x (n + M) = the value of the recorded signal
y (n) = the result of frame blocking.
-
2.3.2 Windowing
The next step taken with the EEG signal before entering the main quantization stage is windowing. There are several types of window functions, but the most commonly used is the Hamming window. The Hamming window function is as follows.
w(n)= 0.54 - 0.64 cos(^^^) ,0≤n≤N-1 (2)
The output representation of the window function for the input signal is:
y(n) = x(ri).w(ri),0 ≤n ≤N —1 (3)
where :
N = the duration (in sample units) for each frame or frame length
y (n) = the windowing signal sample value
-
w (n) = the Hamming window function and x (n) is the sample value from the signal
frame to-i.
In this study, after obtaining the Hamming window results on the EEG signal, then the calculation of the average value of the sample frame is carried out using the following equation.
y(k) = )∑l-oX∖k,ι∖ (4)
where :
y (k) = the average sample frame
l = the frame length
x [k, i] = every ith sample of k frame.
-
2.3.3 Quantization
Then, the next step that the EEG signal goes through is quantization. The quantization process converts a continuous signal x(n) into a discrete signal xq(n), which is used to represent x(n). The quantization mathematical equation is as follows.
Xq(n) = Q[x(n)) (5)
where :
Q = the quantization process
xq(n) = the quantized signal (discrete-valued).
There are two ways in the quantization process, namely rounding and truncation. The way of rounding changes the value of each data to the nearest number. Meanwhile, the truncation method will change the value of each data to the smallest number value.
As for the EEG case in this study, the quantization equation used is as follows.
yq(k) =
As seen in the equation above, to obtain the quantization value of the EEG signal four conditions refer to the y (k) value or the average sample frame value, where later the value of y (k) will fulfill one of the four conditions. Determine the four conditions in the equation because in this case the quantization level is divided into 4 levels.
-
2.4 Classification
The result of the feature extraction process which is a quantization feature will go through the classification process. For the estimated feature vector classification, the authors rely on the Neural Network classifier which is implemented using the Keras library.
There are two ways to classify emotions based on EEG signals, namely by selecting several channels based on predetermined criteria or by using all available channels. In signal processing, it is necessary to reduce the number of channels used because a large number of channels take a lot of time and makes data analysis difficult. By selecting certain channels, the computational load required for data analysis and features used is reduced, thereby minimizing computation for feature extraction and classification processes. Taking these things into account, the authors chose channel F8 from a total of 32 EEG signals to obtain the required features. The selection of channel F8 is based on the location of the channel close to emotional impulses [8].
In this process, the feature vectors obtained from processing the EEG signal data of one of the research subjects are included in the classifier to classify two types of emotions, namely positive emotions and negative emotions from the liking label on the DEAP dataset. Liking data from subjects in the dataset is numerical data with a scale of values from 1 to 9. Each research subject has 40 liking data according to the number of trials on the DEAP dataset. The determination of the value of positive and negative emotions is carried out by normalizing the liking value. After that, the search for the average value is carried out, where the result of this average value becomes the limit for determining the positive and negative values of emotions.
-
2.5 Evaluation
Evaluation is carried out to get an accuracy value which reflects how well the system has been made. In this research, the accuracy value will be used by using the equation:
P= b x 100% (7)
where :
-
P = the level of accuracy
-
b = the number of correct data
-
n = the total data.
By obtaining a P-value, it can be stated that if the P-value is greater, the system will be better and vice versa if the P-value is getting smaller, the system cannot recognize the emotion well.
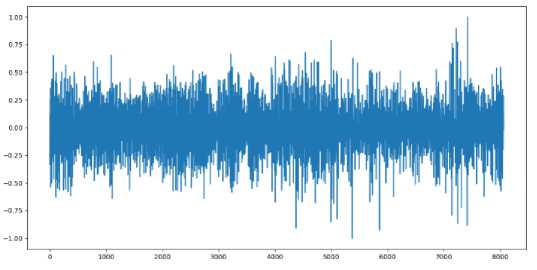
Figure 2. 1st Subject’s EEG Signal
This research was conducted by inputting EEG signal data into the system and then carrying out the Min-Max normalization process. Normalization is the process of scaling the attribute values of data so that they can lie within a certain range. With this normalization, the comparison value of data before or after processing becomes balanced or standardized. Then the output from this process will enter the frame blocking stage.
Frame blocking itself is the initial stage of the feature extraction process in this study. In frame blocking, EEG data which is the output of the normalization process is divided into 125 frames containing signal points with a frame length of 64. The length of the overlap area used in this study is half of the frame length.
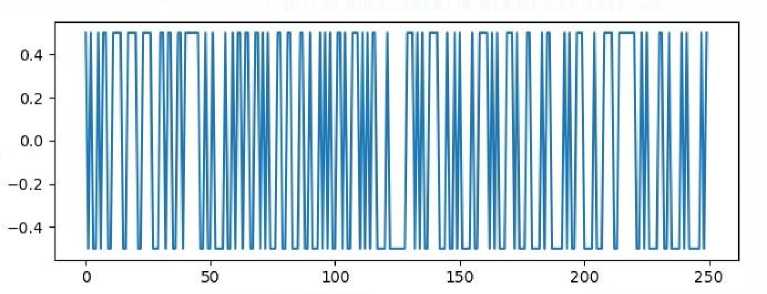
The next step in the feature extraction series is windowing the frame blocking results using the Hamming window function. Then, after the Hamming window results are obtained for the EEG sample, the average value of the sample frame will be calculated. Then, the EEG data goes through the main stage of the feature extraction series, namely quantization. In this quantization stage, new feature vectors will be generated from the EEG signal. The following is the form of an EEG signal that has been quantized and without quantization.
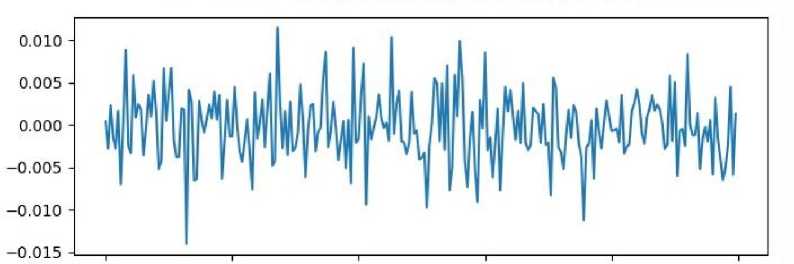
O 50 IOO 150 200 250
Figure 3. 1’st Subject EEG Signal Sample Without Quantization
-
Figure 4. 1’st Subject EEG Signal Sample With Quantization
The feature vectors will then go through a classification process. The classification stage in this study acts as a method of evaluating new features resulting from the quantization process to determine whether the features of the quantization results can represent the EEG signal itself. In the DEAP dataset, four labels are consisting of arousal, valence, dominance, and liking. In this process, the feature vectors obtained from processing the EEG signal data of one of the research subjects are included in the classifier to classify two types of emotions, namely positive emotions and negative emotions from the liking label on the DEAP dataset.
Classification is implemented using the Keras library, which is a library that runs on the TensorFlow machine learning platform. The Neural Network architecture used is as follows:
-
a. First layer: input layer with 250 neurons
-
b. Second layer: hidden layer with 500 neurons
-
c. Third layer: hidden layer with 250 neurons
-
d. Fourth layer: hidden layer with 250 neurons
-
e. Fifth layer: hidden layer with 500 neurons
-
f. Sixth layer: the output layer has 1 neuron with sigmoid activation function
In this study, 100 epochs of Neural Network architecture were conducted.
At the evaluation stage, there are two experiments, namely comparing the classification of the feature vector through quantization with the feature vector without quantization. The following is a table of the accuracy obtained based on the experiments that have been carried out.
Table 2. Accuracy Table
|
Quantization |
Accuracy |
|
Yes |
75% |
|
No |
58% |
As shown in the table above, the feature vector with quantization has a positive impact in representing the EEG signal which is indicated by the acquisition of accuracy of 75%. Then, the feature vector without quantization can represent the EEG signal, but the accuracy is lower than the feature vector with quantization, which is 58%.
Based on the results of the tests carried out, the conclusion that the writer can draw is that the quantization feature is one of the features that can represent EEG signals, shown by its accuracy in the classification of positive and negative emotions from the liking label on the DEAP dataset with Neural Network classifier with the Keras library. In this study, it was proven that features with quantization have an accuracy of 75% compared to features without quantization which only obtain an accuracy of 58%.
References
-
[1] Ahmad, A., 2017. Mengenal artificial intelligence, machine learning, neural network,
dan deep learning. no. October.
-
[2] Koelstra, S., Muhl, C., Soleymani, M., Lee, J.S., Yazdani, A., Ebrahimi, T., Pun, T.,
Nijholt, A. and Patras, I., 2011. Deap: A database for emotion analysis; using
physiological signals. IEEE transactions on affective computing, 3(1), pp.18-31.
-
[3] Santosa, E.J., 2017. KLASIFIKASI GENRE MUSIK MENGGUNAKAN METODE
SUPPORT VECTOR MACHINE (Doctoral dissertation, Universitas Widyatama).
-
[4] Caballero, D., 2018. Feature extraction algorithms from MRI to evaluate quality
parameters on meat products by using data mining. ELCVIA Electronic Letters on Computer Vision and Image Analysis, 16(2), pp.1-4.
-
[5] Hilmi, A., Wijayanto, I. and Hadiyoso, S., 2017. Analisis perbandingan pola sinyal alfa
dan beta eeg untuk klasifikasi kondisi rileks pada perokok aktif dengan menggunakan K-nearest Neighbor. eProceedings of Engineering, 4(3).
-
[6] Fasich, D.A., 2017. Klastering Emosi Berdasarkan Gelombang Otak Sinyal EEG
Menggunakan Fuzzy C-Means Clustering (Doctoral dissertation, Institut Teknologi Sepuluh Nopember).
-
[7] Hidayat, I.T., Djamal, E.C. and Ilyas, R., 2017, August. Brain Computer Interface Untuk Aksi Memutar Lagu Terhadap Tiga Kondisi Emosional Menggunakan Spektral Daya dan Adaptive Backpropagation. In Seminar Nasional Aplikasi Teknologi Informasi
(SNATI).
-
[8] Hurriyatul Fitriyah (penulis); Edita Rosana Widasari (penulis). (2017). Dasar-dasar komputasi sinyal digital : dan contoh aplikasinya menggunakan matlab / Hurriyatul Fitriyah, ST., MSc., Edita Rosana Widasari, ST., MT., MEng.. Malang :: UB Press,.
176
Discussion and feedback