Implementation of K-Nearest Neighbor Algorithm in Heart Disease Classification
on
p-ISSN: 2301-5373
e-ISSN: 2654-5101
Jurnal Elektronik Ilmu Komputer Udayana
Volume 10 No. 1, August 2021
Implementation of K-Nearest Neighbor Algorithm in Heart Disease Classification
Ni Kadek Sukma Putri Rahayua1, I Komang Ari Mogi, S.Kom., M.Koma2.
aInformatics Department, Faculty of Math and Science, Udayana University South Kuta, Badung, Bali, Indonesia 1sukmaaputri@gmail.com
Abstract
The heart is an important organ that exists in the human body. The main function of the heart is to pump blood throughout the body through blood vessels. The WHO states that as many as 7.3 million people die from heart disease. In this study heart disease will be classified using the K-Nearest Neighbor algorithm. K-Nearest Neighbor algorithm is a classification algorithm based on the distance from data testing against training data with a pre-defined number of k. The results were obtained from performance measurements for the classification of heart disease with the K-Nearest Neighbor algorithm measured using the K-Fold Cross Validation algorithm, from an accuracy rate of 65.89%, a precision level of 66.27%, and a recall of 74.67%.
Keywords: Heart Disease, K-Nearest Neighbor, Classification, K-Fold Cross Validation, Heart.
The heart is an important organ that exists in the human body. The main function of the heart is to pump blood throughout the body through blood vessels. If the blood vessels are narrowed, then the heart will be impaired causing heart disease [1]. WHO data shows that as many as 7.3 million people die from heart disease [2]. It is not an infectious disease, but it is the number one deadly disease in the world. The main causes of heart disease are tobacco use, physical inactivity, unhealthy diet and alcohol use, increased risk of heart disease with age, high blood pressure, having high cholesterol, and being overweight.
Technology that developed in this era can also help medical personnel to know the disease of a person, one of which is heart disease. Heart disease will be classified using the K-Nearest Neighbor algorithm. K-Nearest Neighbor algorithm is a classification algorithm based on the distance from data testing against training data with a pre-defined number of k.
Based on the exposure, the authors will implement the K-Nearest Neighbor algorithm in the classification of whether a person has heart disease or not.
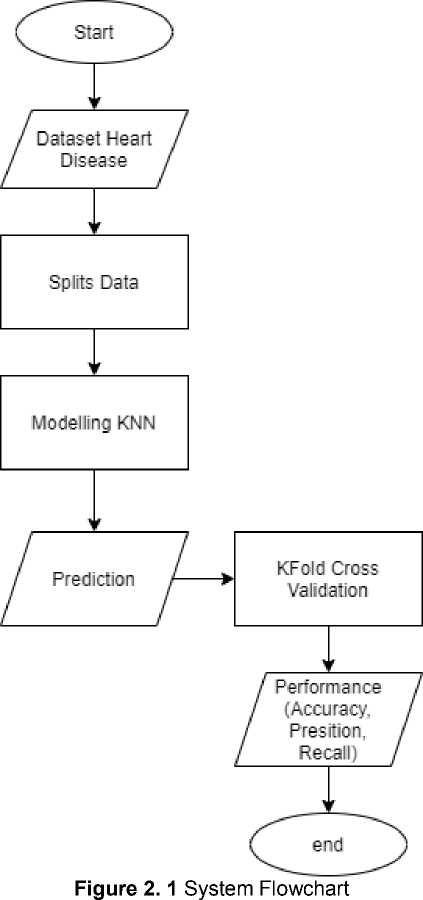
This study used a dataset of heart disease obtained from https://archive.ics.uci.edu/ml/datasets/heart+disease, wherein this data set there are 9 attributes. In this data, there are 8 attributes and the target attribute is 1 attribute. This classification begins (1) by entering a dataset of heart disease (2). Then normalize the data so that all data of the same type (3). Furthermore, the calculation of the distance of the nearest neighbor to the specified k
(4). The accuracy of the data obtained will be presented by the program (5), the program is completed (6).
The heart is one of the vital organs in the body that serves to pump blood throughout the body through blood vessels. The heart consists of four spaces, consisting of upper spaces called the right and left atriums while the lower chamber is called the right and left ventricle. Blood from all over the body flows into the vein that boils in the right atrium, blood from the entire body passes through the heart valve and reaches the right ventricle. During the construction of the right ventricle, the blood is pushed into the lungs to secrete carbon dioxide (CO2), take oxygen, and return through the pulmonary vein to the left atrium. If the heart cannot work properly it can cause heart disease [3].
Diseases related to the organs of the heart and blood vessels include: heart failure, coronary heart, and rheumatic heart. Coronary heart disease (CHD) is a disease of the heart and blood vessels caused by the narrowing of the coronary artery. Narrowing of blood vessels occurs due to the process of atherosclerosis or spasm or a combination of both. Atherosclerosis occurs due
to cholesterol deposits and connective tissues on the walls of blood vessels slowly, this is often characterized by complaints of chest pain [4].
Some factors that can cause heart disease include :
-
1. Getting older
-
2. Lifestyle
-
3. Less rest
-
4. Lack of exercise
-
5. Stress
-
6. Obesity
-
7. Smoke, etc
Algorithms are divided into two types, namely supervised algorithms and unsupervised algorithms. Supervised learning algorithms aim to advance new patterns in data by connecting existing data patterns with new data, whereas in unsupervised learning algorithms, data does not yet have any patterns and the purpose of unsupervised learning algorithms is to find patterns in a data [5]. The K-Nearest Neighbor algorithm includes a supervised algorithm because it aims to classify new objects based on attributes and training data.
In the book written by Dr. Suyanto, S.T., M.Sc., the K-Nearest Neighbor algorithm works by looking for some groups of k data objects or patterns (of all existing training patterns) that are closest to the input pattern, then selecting the class with the most number of patterns among the pattern k. To determine the distance between objects is used euclidean formula in equation 6.1 [6].
dxy = √∑"=ι(χ/ — y∂2 (1)
Where :
dxy : the distance between the point on the training data and the testing data to be classified
xi : value from training data
yi : the value of the testing data
i : attribute value
n : dimension data attribute
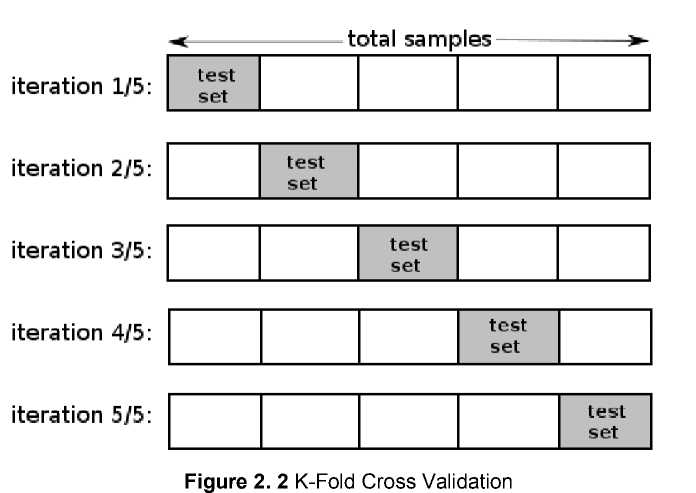
Cross validation is one of the methods for evaluating classifier performance, this method can be used if it has a limited amount of data (not many instances). K-fold cross validation is one of the methods used to know the average success of a system by repeating by randomize input attributes so that the system is tested for some random input attributes. K-fold cross validation starts by dividing the desired amount of n-fold data. In the process of cross validation data will be
divided into n partitions of the same size D1, D2, D3.. Then the test and training process is done as many times as n times. In the ith iteration of the partition In will be the test data and the rest will be training data. For the use of the best fold amount for validity tests, it is recommended to use 10-fold cross validation in the model. An example of dataset sharing in the 10-fold cross validation process is seen in the image below.
The workings of K-fold cross validation are as follows :
-
1. The total instance is divided into N sections.
-
2. The 1st Fold is when the 1st part becomes the testing data and the rest becomes training data. Next, calculate accuracy, precision, and recall based on that portion of data. Calculation of accuracy, precision, and recall using the following equations:
∑correct classification test data
Accuracy = ------=------------------- × 100%
∑total test data
Precision =
^correct classification test data ∑total data predicted
× 100%
^correct classification test data ∑total test data on a specific class
× 100%
-
3. The 2nd fold is when the 2nd part becomes the testing data and the rest becomes training data. Next, calculate accuracy based on the portion of the data.
-
4. So on until it reaches the K-fold. Calculate the average accuracy of the K fruit accuracy above. This average accuracy becomes the final accuracy.
The data set in this study is heart disease dataset. The amount of data used is 304 data where these data will be divided into 2, namely training data and test data. The share of training data and test data used is 70% for training data and 30% for test data. To determine if the patient has heart disease then used 9 closest data or in the algorithm K-Nearest Neighbor k = 9. The KNN algorithm will calculate the nearest 9 training data from the test data. After knowing the results of the 9 data, the majority of targets will be used as a conclusion whether the patient has heart disease or not.
Table 3. 1 Sample Training Data
|
A r≥ G |
S ∣z |
C |
TRES |
CH |
F D |
REST |
THAL |
EXA |
OLDP |
SLO |
C |
TH |
TAR |
|
E |
E X |
P |
TBPS |
OL |
B S |
ECG |
ACH |
NG |
EAK |
PE |
A |
AL |
GET |
|
53 |
1 |
0 |
123 |
282 |
0 |
1 |
95 |
1 |
2 |
1 |
2 |
3 |
0 |
|
50 |
1 |
2 |
140 |
233 |
0 |
1 |
163 |
0 |
0.6 |
1 |
1 |
3 |
0 |
|
59 |
0 |
0 |
174 |
249 |
0 |
1 |
143 |
1 |
0 |
1 |
0 |
2 |
0 |
|
52 |
1 |
2 |
172 |
199 |
1 |
1 |
162 |
0 |
0.5 |
2 |
0 |
3 |
1 |
|
55 |
0 |
0 |
180 |
327 |
0 |
2 |
117 |
1 |
3.4 |
1 |
0 |
2 |
0 |
|
Table 3. 2 Sample Testing Data | |||||||||||||
|
A r≥ G |
S |
C |
TRES |
CH |
F D |
REST |
THAL |
EXA |
OLDP |
SLO |
C |
TH |
TAR |
|
E |
E X |
P |
TBPS |
OL |
B S |
ECG |
ACH |
NG |
EAK |
PE |
A |
AL |
GET |
|
60 |
1 |
0 |
117 |
230 |
1 |
1 |
160 |
1 |
1.4 |
2 |
2 |
3 |
0 |
|
60 |
1 |
0 |
140 |
293 |
0 |
0 |
170 |
0 |
1.2 |
1 |
2 |
3 |
0 |
|
62 |
1 |
1 |
120 |
281 |
0 |
0 |
103 |
0 |
1.4 |
1 |
1 |
3 |
0 |
|
54 |
1 |
2 |
120 |
258 |
0 |
0 |
147 |
0 |
0.4 |
1 |
0 |
3 |
1 |
|
42 |
1 |
2 |
120 |
240 |
1 |
1 |
194 |
0 |
0.8 |
0 |
0 |
3 |
1 |
To measure the performance of the heart disease classification program will be used K-Fold Cross Validation algorithm. The program used n splits as many as 10 iterations, while to know the performance will be calculated accuracy, precision, and recall.
Table 3. 3 K-Fold Cross Validation Table
|
Fit_Ti me |
Score_ Time |
Test_Acc uracy |
Train_Acc uracy |
Test_Pre cision |
Train_Pre cision |
Test_R ecall |
Train_R ecall | |
|
0 |
0.001 998 |
0.00897 3 |
0.7 |
0.707317 |
0.5 |
0.72 |
1 |
0.78260 9 |
|
1 |
0.000 977 |
0.00300 9 |
1 |
0.707317 |
1 |
0.7 |
1 |
0.79545 5 |
|
2 |
0.001 995 |
0.00299 4 |
0.333333 |
0.73494 |
0 |
0.72549 |
0 |
0.82222 2 |
|
3 |
0.000 999 |
0.00498 6 |
0.444444 |
0.746988 |
0.75 |
0.744186 |
0.4285 71 |
0.76190 5 |
|
4 |
0.001 001 |
0.00302 7 |
0.555556 |
0.73494 |
0.8 |
0.727273 |
0.5714 29 |
0.76190 5 |
|
5 |
0.000 996 |
0.00398 5 |
0.888889 |
0.686747 |
1 |
0.688889 |
0.8333 33 |
0.72093 |
|
6 |
0.001 989 |
0.00296 |
0.888889 |
0.710843 |
1 |
0.708333 |
0.8 |
0.77272 7 |
|
7 |
0.000 997 |
0.00299 3 |
0.555556 |
0.746988 |
0.625 |
0.761905 |
0.8333 33 |
0.74418 6 |
|
8 |
0.000 997 |
0.00299 3 |
0.444444 |
0.73494 |
0.285714 |
0.727273 |
1 |
0.85106 4 |
|
9 |
0.000 995 |
0.00399 |
0.777778 |
0.686747 |
0.666667 |
0.693878 |
1 |
0.75555 6 |
Out of 212 training data and 92 test data and using K-NN method with a value of K = 9 obtained an accuracy rate of 65.89%, precision rate of 66.27% and recall of 74.67%.
In this study, the classification of heart disease was carried out using the K-Nearest Neighbor algorithm with k = 9. The proximity between cases to training data and test data is done by specifying the test data class. To measure the performance of the KNN algorithm, it is done using the K-Fold Cross Validation algorithm. Measured performance is the level of accuracy, precision, and recall. The results obtained from the KNN algorithm performance calculation are from an accuracy rate of 65.89%, a precision level of 66.27%, and a recall of 74.67.
The advice that can be applied for further research is to compare algorithms or other data mining methods in detecting heart disease, to know which algorithms are more accurate and efficient. So that the right algorithm can be determined to detect heart disease
References
-
[1] L. Ghani, M. D. Susilawati, and H. Novriani, “Faktor Risiko Dominan Penyakit Jantung
Koroner di Indonesia,” Bul. Penelit. Kesehat., vol. 44, no. 3, pp. 153–164, 2016, doi: 10.22435/bpk.v44i3.5436.153-164.
-
[2] M. Lestari, “Penerapan Algoritma Klasifikasi Nearest Neighbor (K-NN) untuk Mendeteksi
Penyakit Jantung,” Fakt. Exacta, vol. 7, no. September 2010, pp. 366–371, 2014.
-
[3] P. D. Sugiyono, “済無No Title No Title,” J. Chem. Inf. Model., vol. 53, no. 9, pp. 1689–
1699, 2016, doi: 10.1017/CBO9781107415324.004.
-
[4] D. Evanko, “Optical imaging of the native brain,” Nat. Methods, vol. 7, no. 1, p. 34, 2010,
doi: 10.1038/nmeth.f.284.
-
[5] F. Liantoni, “Klasifikasi Daun Dengan Perbaikan Fitur Citra Menggunakan Metode K-
Nearest Neighbor,” J. Ultim., vol. 7, no. 2, pp. 98–104, 2016, doi: 10.31937/ti.v7i2.356.
-
[6] G. O. Mustakim, “Algoritma K-Nearest Neighbor Classification,” J. Sains, Teknol. dan
Ind., vol. 13, no. 2, pp. 195–202, 2016, [Online]. Available: http://ejournal.uin-suska.ac.id/index.php/sitekin.
44
Discussion and feedback