The Effect of Feature Selection on Music Genre Classification
on
p-ISSN: 2301-5373
e-ISSN: 2654-5101
Jurnal Elektronik Ilmu Komputer Udayana
Volume 9 No. 4, May 2021
The Effect of Feature Selection on Music Genre Classification
I Nyoman Yusha Tresnatama Giria1, Luh Arida Ayu Rahning Putria2
aInformatics Department, Udayana University South Kuta, Badung, Bali, Indonesia 1yusatresnatama11@gmail.com 2rahningputri@unud.ac.id
Abstract
One of the things that affects classification results is the correlation of features to the class of a data. This research was conducted to determine the effect of the reduction of features (independent variable) that have the weakest correlation or have a distant relationship with the class (dependent variable). Bivariate Pearson Correlation is used as a feature selection method and K-Nearest Neighbor is used as a classification method. Results of the test showing that, 75.1% average accuracy was obtained for classification without feature selection, while using feature selection, average accuracy was obtained in the range of 75% - 79.3%. The average accuracy obtained by the selection of features tends to be higher compared to the accuracy obtained without selection of features.
Keywords: Feature Selection, Classification, Accuracy, Bivariate Pearson correlation, K-Nearest Neighbor
Genre in music is a classification performed by a person based on how similar the rhythm, harmony, and other various contents from the music is. Manual classification like this takes a lot of time because we need to listen to the music one by one, so a more effective classification is needed.
Before it can be classified, music needs to be extracted first in order to obtain feature data from the music itself. From the extraction results, a classification is carried out using classification method with the aim of obtaining the results of the music’s genre. K-Nearest Neighbor is a method that is easy to learn and in terms of learning, this method has the nature of supervised learning, which means this method uses training data as information to calculate and classify the test data [1]. There are various factors that can affect the results of classification, one of which is the features itself. The relationship between features will certainly have an impact on the classification results [2]. Bivariate Pearson correlation is a feature selection method which used to determine strength of the relationship between the independent variable (features) and the dependent variable (genres). Feature that have a weak correlation will be eliminated so that new dataset can be obtained with the eliminated features which will gives a different accuracy if re-classified.
In a previous studies related to the music genre classification has been conducted by [3] using 5 feature extraction methods (MFCC, chroma frequencies, spectral centroid, spectral roll-off, and zero crossing rate) to classify songs to 9 different genres. In this study, there are 3 classification methods used with different accuracy results namely K-Nearest Neighbor reaching 64%, Linear Support Vector Machine reaching 60%, and Poly Support Vector Machine reaching 78%.
In other studies conducted by [2], classification of liver disorders diagnostic results was conducted by using neural network backpropagation with MATLAB as classification method and bivariate Pearson correlation with IBM SPSS Statistic 25 tools as feature selection method. In testing data analysis conducted by this study, data that does not perform feature selection produces an accuracy value that tends to be greater than data that performs feature selection ranging between
64% to 100%. However, the accuracy value obtained in data that performs feature selection is more stable which is ranging between 68.57% to 71.42%.
Based on both studies above, authors want to know the accuracy changes that occur both before and after feature selection of music genre classification. The features that will be used in this study are produced by 5 feature extraction methods which results a total of 28 vector features. Bivariate Pearson correlation will be used as selection feature method that aims to find out which features or vector features will be selected based on the correlation relationship between features and classes (genres). The classification method in this study is K-Nearest Neighbor.
In this research, the audio data that will be used is GTZAN dataset which has 9 genres with 100 songs for each genre. The process of how the system will works can be seen in Figure 1.
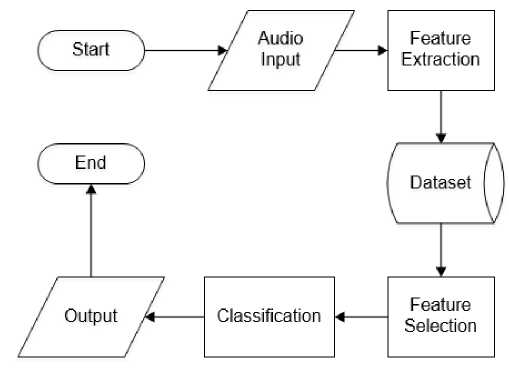
Figure 1. Flowchart of music genre classification with feature selection
The process starts from feature extraction to get the features of all songs from GTZAN dataset. The features obtained will be saved into a dataset. The feature selection was carried out using the Bivariate Pearson correlation method which then will be classified using K-Nearest Neighbor to produce an output in the form of accuracy.
The goal of this step is to get a new dataset in the form of numeric values of each feature extracted from each song. There are 5 extraction features that will be used namely MFCC, chroma frequencies, spectral centroid, spectral roll-off, and zero crossing rate. Several libraries are involved for feature extraction namely scipy, librosa, and pandas.
Feature selection aims to find the relevance value of a feature of the class label and ignore feature that do not contribute anything to data classification' result. Bivariate Pearson correlation is used to analyze the significance value of each feature on the dataset. If the significance value of a feature is close to 0, it means that feature has a strong relationship to the class (genre) which might influence the result of classification. If the feature significance value is close to 1, it means the feature has a weak relationship to the class (genre) [2]. The sample correlation coefficient between two variables (feature (x) and genre (y)) is denoted r or rxy, and can be computed as equation (1).
cov(x,y)
(1)
rxy = i , τ ∕ „ F
√var(x). √var(y)
Where cov(x, y) is the sample covariance of x and y, var(x) is the sample variance of x, and var(y) is the sample variance of y [4]. IBM SPSS Statistic 25 is used to help calculate Bivariate Pearson correlation method above.
Classification is done after we have a dataset either before or after performing the feature selection. The classification steps by using the K-Nearest Neighbor can be done by the following steps:
Dataset that has been obtained through feature extraction will be inputted for early classification’s process.
In pre-processing, the data will be normalized with min-max normalization to get a balance of values between each feature from dataset [5]. The calculation of min-max normalization can be done with equations (2).
minRange + (x — minValue)(maxRange - minRange) norm(x) =-------------——---- . τ. ,--------------
(2)
maxValue — minValue
Where norm(x) is the function to normalize data x, minRange is the minimum limit we provide while maxRange is the maximum limit. minValue and maxValue are both smallest and largest values of all data before normalized. x is the data before normalized.
There are many distance calculations available in the K-Nearest Neighbor method, one of which is Euclidean. The purpose of the calculation is to define the distance between the two points, which is the point in the training data (x), and the point in testing data (y). Calculation of euclidean distance can be done with equations (3).
d(xi,yi) =
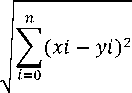
(3)
Where d is the distance between the point on the training data x and the testing data y to be classified. x, y, and i represent attribute and n is the dimension of the attribute.
Sorting process is done after all distances have obtained. In the K-Nearest Neighbor method, sorting is performed based on the smallest (closest) distance value.
The process of determining a class, in this case a genre on music. The output of genre results is obtained from the test data through this step.
In the classification step of this study will be done with the help of scikit-learn library which has several functions namely K-NN Classifier function, metrics for accuracy calculation, and most importantly is data training and data testing will use K-fold cross validation function from this library.
-
3. Result and Discussion
-
3.1. Feature Extraction Result
-
Total 28 vector features have been obtained from the extraction feature which consist of 13 MFCC vector features, 12 chroma frequencies vector features, and 1 vector feature each from spectral centroid, spectral roll-off, and zero crossing rate.
-
3.2. Feature Selection Result
Correlation test results using IBM SPSS Statistic 25 can be seen in Figure 2.

Figure 2. Correlation result of MFCC feature against genre
In the image above, there are several features in Pearson correlation that have an asterisk symbol. 1 asterisk symbol (*) means its correlation significance is below 0.05 and the 2 asterisk symbol (**) means its correlation significance is below 0.01 [4]. Some features that do not have an asterisk symbol indicate that the independent variable (feature) has a weak correlation to dependent variable (genre). In the MFCC feature, there are 8 vector features that have an asterisk symbol which means have a strong correlation.
chroma-set1 chroma-set1 chroma-set1
.150 .000 .572 .087 .262 .020 .000 .820 .007 .622 .024.004
900 900 900 900 900 900 900 900 900 900 900900
Figure 3. Correlation result of Chroma Frequency feature against genre
In chroma frequencies correlation result, there are 6 vector features that have an asterisk symbol which also means have a strong correlations
|
centroid |
rolloff |
zero cross |
|
XX .408 |
XX .339 |
XX .375 |
|
.000 |
.000 |
.000 |
|
900 |
900 |
900 |
Figure 4. Correlation result of Spectral Centroid, Spectral Roll-Off, and Zero Crossing Rate against genre
Spectral centroid, spectral roll-off, and zero crossing rate features have a strong correlation. From the correlation result of all features, every features that has a significance value above 0.05 will be eliminated because values above this significance’s threshold have no significant impact on classification results.
-
3.3. Classification Result
From the correlation results, 4 different scenarios will be tested in classification step:
-
a. Classification without feature selection
-
b. Classification with vector features selection of chroma frequencies
-
c. Classification with vector features selection of MFCC
-
d. Classification with vector features selection of both chroma and MFCC.
The test results for each scenario using K-Nearest Neighbor method with K=13 and K-fold cross validation by 9 fold to distribute the test data can be seen in the table below:
Table 1. Accuracy of classification results on each scenario
Scenario
1 2 3 4
|
Fold 1 |
0.70 |
0.77 |
0.74 |
0.84 |
|
Fold 2 |
0.76 |
0.76 |
0.78 |
0.79 |
|
Fold 3 |
0.84 |
0.83 |
0.85 |
0.82 |
|
Fold 4 |
0.69 |
0.73 |
0.65 |
0.72 |
|
Fold 5 |
0.64 |
0.75 |
0.68 |
0.74 |
|
Fold 6 |
0.77 |
0.75 |
0.76 |
0.79 |
|
Fold 7 |
0.82 |
0.81 |
0.80 |
0.81 |
|
Fold 8 |
0.75 |
0.77 |
0.73 |
0.77 |
|
Fold 9 |
0.73 |
0.75 |
0.70 |
0.80 |
|
Average |
0.75 |
0.77 |
0.75 |
0.79 |
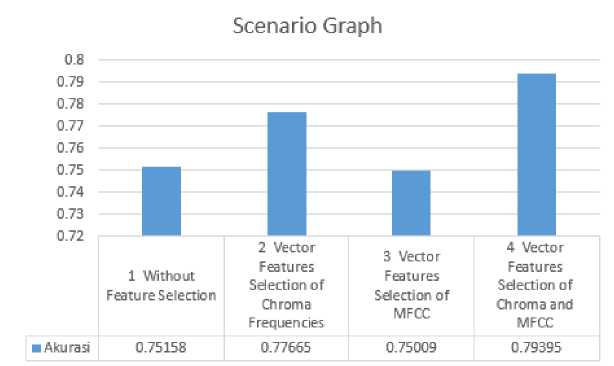
Figure 5. Bar chart of each scenario’s result
Table 1. Shows a table of the accuracy obtained from the classification results of 4 types of scenarios while Figure 5 is a bar graph of the average accuracy of each scenario. Based on the graph above, the average accuracy from 4 different type scenarios ranging between 75.0% -79.3%. The lowest average accuracy is 75.0% for the scenario 3 which tests the MFCC vector features selection while the highest average accuracy is 79.3% for the scenario 4 which tests both MFCC and chroma frequencies vector features. The average accuracy of the scenario 1 is 75% which tests without involving feature selection.
Bivariate Pearson correlation is a method that used for feature selection. In this study, feature selection using Bivariate Pearson correlation tends to give a direct impact on the accuracy results of music genre classification. From the study that has been successfully carried out to test 4 scenarios, it shows that scenario which tests classification with feature selection tends to produce higher average accuracy with the highest average accuracy is 79.3% obtained by selecting vector features from both MFCC and chroma frequencies (scenario 4). For further research development, it is recommended to use other feature extraction methods, especially methods that have a single feature vector such as spectral centroid, spectral roll-off, and zero crossing rate.
References
-
[1] T. H. Simanjuntak, W. F. Mahmudy, Sutrisno, “Implementasi Modified K-Nearest Neighbor Dengan Otomatisasi Nilai K Pada Pengklasifikasian Penyakit Tanaman Kedelai” Pengembangan Teknologi Informasi dan Ilmu Komputer, Vol. 1, No. 2, p. 75-79, 2017.
-
[2] K. D. Prebiana, I. G. S. Astawa, “Influence Optimization Feature Against Liver Disorders Diagnostic Results Using Artificial Neural Network” Jurnal Elektronik Ilmu Komputer Udayana, Vol. 8, No.3, p. 261-267, 2020.
-
[3] N. M. Patil, M. U. Nemade, “Music Genre Classification Using MFCC, K-NN, and SVM Classifier” Computer Engineering in Research Trends, Vol. 4, Issue 2, p. 43-47, 2017.
-
[4] K. Yeager, P. Bhattacharya, V. Reynolds, “Kent State University Library”, 22 September 2020. [Online]. Available: https://libguides.library.kent.edu/SPSS. [Accessed 19 September 2020]
-
[5] D. A. Nasution, H. H. Khotimah, N. Chamidah, “Perbandingan Normalisasi Data Untuk Klasifikasi Wine Menggunakan Algoritma K-NN” Computer Engineering System and Science, Vol. 4, No. 1, p. 78-82, 2019.
554
Discussion and feedback