Influence Optimization Feature Against Liver Disorders Diagnostic Results Using Artificial Neural Network
on
p-ISSN: 2301-5373
e-ISSN: 2654-5101
Jurnal Elektronik Ilmu Komputer Udayana
Volume 8, No 3. February 2020
Influence Optimization Feature Against Liver Disorders Diagnostic Results Using Artificial Neural Network
Kiki Dwi Prebiana1, I Gede Santi Astawa2
-
1,2Informatics Engineering Program, Faculty of Mathematics and Natural Sciences, University of Udayana
Jl. Raya Kampus Udayana University Bukit Jimbaran, Badung, Bali. Postal Code: 80364. Indonesia
Abstract
The diagnosis is a classification of a person based on a disease or abnormality . One classification technique that can be used is Artificial Neural Networks. ANN is an information processing system that has characteristics similar to human nerves, in ANN training data is needed in learning. The learning process in Artificial Neural Networks related to the length of time the learning is done. One way to reduce computing time can be done with the selection feature. In this study, an analysis of the results of the diagnosis of liver disorders using Artificial Neural Networks with feature selection and without feature selection. The test results show that the accuracy of the data obtained by performing feature selection tends to be more stable when compared to the value of data accuracy without feature selection, which is between 68.57% to 71.42%. Besides the learning time required by the data that do feature selection tends to be faster than data that does not do the feature selection, in the data that does not do the highest computational time selection feature is 0:00:21 while the data that does the biggest computation time feature selection is 0:00:14.
Keywords:Artificial Neural Network (ANN), Liver Disorders Diagnosis, Feature selection, Classification, Accuracy
Diagnosis is the classification of a person based on a disease or abnormality that he is suffering from. One classification techniques that can be used in the diagnosis of Liver Disorders are the Artificial Neural Networks, Artificial Neural Network or ANN is an information processing system that has characteristics resembling human nerve. In the classification process with ANN learning processes are needed in order to solve a problem In this study 70% ratio will be used as training data and 30% as test data. 70% of training data is used, because the data has been able to represent the overall type of data available.
The advantage of Artificial Neural Networks is being able to map the relationship between input and output based on previous learning processes. However, in the use of Artificial Neural Networks or ANN the learning process will affect the computational time performed. In previous studies, Dian Restiani in 2018 combined the c-ripper algorithm to diagnose liver disease with two different treatments for the features used, namely feature reduction and without feature reduction. With a different treatment at the preprocessing stage the research conducted yielded an accuracy value of 80% without reducing features and an accuracy of 70% with a reduction in features with the same dataset namely ILPD or Indian Liver Patient Dataset (Restiani, 2018). In 2014, Sulistiyasni and Edi Winarko conducted a classification process using Backpropagation Artificial Neural Networks, and obtained an
accuracy rate of 87.5%. In the research conducted, Backpropagation Artificial Neural Networks are used to get a balance to recognize patterns given in training and respond to input provided in the training process, with 70% of the training data from 110 existing data, and using 30% of the data such as testing data (Sulistiyasni, 2014). And in 2017, Niswatul Arifah T, Agus Murnomo, and Agus Suryanto also implemented a Neural Network in matlab, which is used to estimate electricity consumption in the Ponorogo district in East Java. In the journal entitled Neural Network Implementation in Matlab for Electricity Consumption Forecast in Ponorogo Regency, East Java, it is explained about the application of Artificial Neural Networks in matlab and how to obtain accuracy from the forecasting process carried out with ANN. With the use of the matlab tool, the researcher does not need to do the coding process from the beginning so that it can speed up the research process (Niswatul Arifah T, 2017),
From the literature study that has been conducted to determine the effect of the features used on learning of Artificial Neural Networks in this study will be analyzed the results of the diagnosis of liver disorders with two different treatments, namely without feature selection and with feature selection. The feature selection process is carried out by means of analyzing the significance of the attributes of a class using the SPSS tool.
In this research the feature optimization process will be carried out, the feature optimization process will be carried out at the data preprocessing stage, in the form of feature selection, data sharing into training data and testing data, then the diagnostic process is carried out by classifying data using Backpropagation Artificial Neural Networks on Matlab with two different treatments, namely without feature reduction and with feature reduction. Overview of research methodology or process can be seen in the image below:
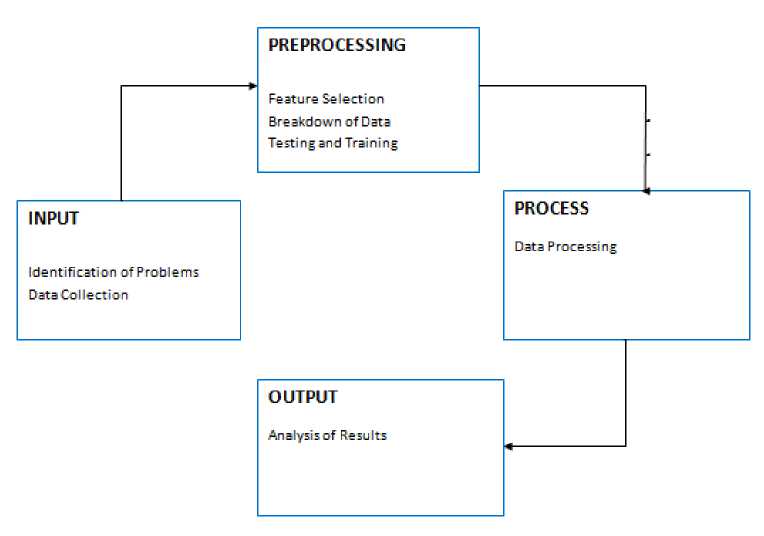
Picture 1 Flow Methods
From the picture above, it can be explained that for each stage are as follows: 2.1 Identification of problems
Identification of the problem is an attempt to find out the problems and algorithms to be used in the diagnosis of liver disease.
-
2.2 Data collection
In this study, the data used are secondary data obtained from thw UCI Learning Repository Machine, the Indian Liver Patient Dataset. Consisting of 583 records with patient status 414 had sick status, and 169 patients with healthy status. With a total of 10 attributes, they are :
Table 1. ILPD Attribute Description
|
Attribute Name_______________________________I |
Description |
|
Age |
Age and Patient |
|
Gender |
Patient’s Gender |
|
TB |
Total Bilirubin |
|
DB |
Direct Bilirubin |
|
Alkphos |
Alkaline Phosphotase |
|
Sgpt |
Amartotransferse |
|
Sgot |
Aspartate |
|
TP |
Total Protiens |
|
ALB |
Albumin |
|
A/G Ratio |
Albumin and Globullin Ratio |
|
Class |
Dividing Data Into Two Classes : 1 : Suffering or Liver Disease 2: Do Not Suffer From Liver |
-
2.3 Feature selection
Analysis of the significance of the value of each feature, then the reduction of features that have no effect on the results of the classification. Reduced attributes are attributes that have a significance value below 0.05. Because features that have a significance value close to 0 indicate that the feature is increasingly influential on class determination in the classification process. Neither on the contrary, getting closer to value 1 indicates that the feature is not significant or has no effect.
-
2.4 Distribution of Testing Data and Training Data
Pada pembagian data menjadi data testing dan training, digunakan perbandingan 7:3, yaitu 70% untuk data Training dan 30 % untuk data Testing.
-
2.5 Data processing
In this data processing, two treatments were carried out on the ILPD dataset used. The first treatment is carried out the learning training data using all the attributes of the dataset without feature selection. And the second treatment is done by feature selection. Then tested using 30% testing data that has been separated with training ddata. The learning process in both data uses the same number of neurons is 10. The target of processing the dataset is the classification of “positive liver” or “negative liver”. The following is the architecture used for the dataset learning :
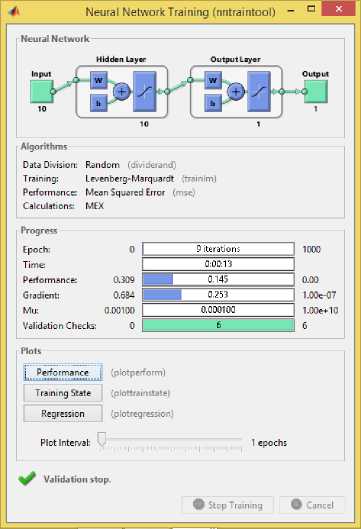
Figure 2. Training Process
-
2.6 Analysis of Results
Analysis of the results is the final process of this research. The analysis carried out in the form of an analysisi of the learning time used by machine learning time used by machine learning as well as the accurancy value of the data that perform feature selection or that do not do feture selection :
Conducting a preliminary study by studying the literature related to the research carried out (Restiani, 2018) (Sulistiyasni, 2014) (Niswatul Arifah T, 2017), namely " Influence Optimization Feature Against Liver Disorders Diagnostic Results Using Artificial Neural Network. "
The dataset used is secondary data obtained from the UCI Machine Learning Repository, with the dataset name that is ILPD or Indian Liver Patient Dataset. The amount of data is the data 583 people, with 11 attributes or features and one class classification class that is positive and negative liver. Out of 583 patient data, 414 were patient positive liver data and 159 patient negative liver data. The attributes in the ILPD dataset are shown in table 1, with the data type used being numerical, except for the Gender attribute which has categorical data type. In the positive liver variabel class is marked with a value of 1 and negative liver is marked with a value of 2.
Feature selection is done by conducting bivariate correlation analysis using SPSS tool. From the results of the correlation analysis conducted showed that of all the attributes that exist, the attribute that has the strongest relationship to class variables is DB or Direct Billirubin with a
correlation value of -0.246. And attributes that have the weakest relation to class is TP or Total Protiens 0.35.
In the significance analysis conduted, a feature has a significant effet on a class when the significant effect on a class when the significane value is less than 0.05. The closer to 0 the significance results obtained indicate that there is a relationship between attributes and classes. From the analysis conducted, it shows that there are two attributes that have a significance value> 0.05. The two attributes are Gender and TP, it shows that the two attributes do not affect the class determination. The results of the significance test show that the attributes that can be reduced as new conditions in the second treatment are Gender and TP attributes with significance values of 0.47 and 0.399, respectively. The following are the results of the feature selection:
Table 1. Result Feature Selection
|
Attribute Name |
Description |
|
Age |
Age and Patient |
|
TB |
Total Bilirubin |
|
DB |
Direct Bilirubin |
|
Alkphos |
Alkaline Phosphotase |
|
Sgpt |
Amartotransferse |
|
Sgot |
Aspartate |
|
ALB |
Albumin |
|
A/G Ratio |
Albumin and Globullin Ratio |
|
Class |
Dividing Data Into Two Classes : 1 : Suffering or Liver Disease 2: Do Not Suffer From Liver |
In the distribution of data used a comparision between training and testing data by 70% and 30%. The training data is used as much as 70% because the data can already represent all of the existing data. So this research will use 403 training data and 175 testing data with two different treatments for the features used. Dataset 1 is the original dataset obtained from the UCI Machine Learning Repository and dataset 2 is the result of feature selection using SPSS.
Data processing is carried out by applying Artificial Neural Networks with the matlab tool. Use the same training data with the number of different hidden layers, 1,2,3 and 4, with the same number of neurons, 10 neurons. The following is the learning time obtained from the training data processing that has been carried out, namely:
-
a. Dataset 1
Table 2. Learning Time Analysis Dataset 1
|
Number of Hidden Layers |
1 |
2 |
3 |
4 |
|
Time |
0:00:21 |
0:00:01 |
0:00:01 |
0:00:07 |
-
b. Dataset 2
Table 3. Learning Time Analysis Dataset 2
|
Number of Hidden layers |
1 |
2 |
3 |
4 |
|
Time |
0:00:03 |
0:00:14 |
0:00:03 |
0:00:01 |
Next is testing data testing, using the same testing data with a number of different hidden layers, different accuracy values are obtained. The accuracy value is sought by calculating the number of values in the ANN results that match the testing data, divided by the entire data multiplied by 100%. Following are the accuracy values obtained for each hidden layer using the testing data:
-
a. Dataset 1
Table 4. Accuracy Analysis Dataset 1
|
Number of Hidden Layers |
1 |
2 |
3 |
4 |
|
Accuracy |
64% |
88.57% |
100% |
70.28% |
-
b. Dataset 2
Table 5. Accuracy Analysis Dataset 2
|
Number of Hidden layers |
1 |
2 |
3 |
4 |
|
Accuracy |
69.71 |
68.57% |
71.42% |
69.14% |
Table 3 and table 4 are the results of data processing performed on Indian Liver Patient Dataset (ILPD) training data with a total of 10 neurons and 4 different numbers of hidden layers, namely 1, 2, 3, and 4. In dataset 1, the range of learning time is between 0:00:01 and 0:00:21. Whereas in dataset 2 (feature selection) the range of learning time is generated between 0:00:01 and 0:00:14. This shows that feature reduction gives a smaller computational time compared to without feature selection.
Tables 5 and 6 are the results of processing the Indian Liver Patient Dataset (ILPD) testing data. The testing data and neurons used are the same data with a number of different hidden layers. In the processing of the testing data obtained different accuracy values, without doing feature selection obtained values of accuracy between 64% to 100%. Whereas by doing feature selection, accuracy is obtained between 68.57% to 71.42%. Accuracy values on data that do not perform feature selection tend to be greater than data testing that does feature selection. However, the accuracy of data that performs feature selection is more stable than data without feature selection.
This study aims to compare the effect of feature optimization on the results of the diagnosis of liver disorders. The data used in this study are secondary data obtained from the UCI repository. Feature comparison is done with two treatments, namely dataset, without feature reduction and feature reduction. Feature reduction is done by analyzing the significance of features performed using the SPSS tool.
In the training data analysis shows that the data without feature selection tends to require a longer learning time than the data that does feature selecton. In the data that does not do the highest computational time selection feature is 0:00:21 while the data that does the biggest computation time feature selection is 0:00:14.
In testing data analysis, data that does not perform feature selection produces an accuracy value that tends to be greater than data that performs feature selection between 64% to 100%. However, the accuracy value obtained in data that performs feture selection is more stable than the accuracy value in data that does not perform feture selection, which is between 68.57% to 71.42%.
A Jumarwanto, RH (2009). Backpropagation Neural Network Application for Prediction of ENT at Mardi Rahayu Hospital of the Holy. Journal of Electrical Engineering, 11.
Niswatul Arifah T, AM (2017). Implementation of Neural Network in Matlab. Journal of Electrical Engineering, 8-12.
Prasetyo, E. (2012). Data Mining Concepts and Applications Using Matlab. Yogyakarta: ANDI. Restiani, D. (2018). The combination of C-Ripper Algorithm for Diagnosing Liver Diseases.
Journal of Information Engineering, 31-36.
Sulistiyasni, EW (2014). Fingerprint Pattern Classification Using Neural Network Backpropagation. Periodic Mathematics, 215-224.
Authority, MS (2016). Effect of Activation Functions, Optimization and Network Performance Total Epoch Against Counterfeit Sayaraf. Journal of Systems and Information Technology, 1-8.
267
Discussion and feedback