Performance Analysis of MANET Proactive and Reactive Routing Protocols Using Network Simulator 2
on
Jurnal Elektronik Ilmu Komputer Udayana
Volume 8, No 3. February 2020
p-ISSN: 2301-5373
e-ISSN: 2654-5101
Performance Analysis of MANET Proactive and Reactive Routing Protocols Using Network Simulator 2
I Wayan Adi Saputraa1, I Komang Ari Mogia2
aInformatics Department, Udayana University
Bali, Indonesia 1adisaputra23iwayan@g mail.com 2 arimogi@unud.ac.id
Abstract
The development of Mobile ad hoc networks (MANET) has the nature and character of a fast, cost- effective. The development of Mobile ad hoc networks (MANET) has the nature and character of a fast, cost-effective deployment and able to manage the topology independently. This has caused in recent years, MANET to be an interesting and popular thing to study. MANET can be applied even in difficult areas, forest fire detection, military operations and even health monitoring. Changes in the topology dynamically on MANET, limited energy consumption, and built without existing infrastructure are a problem in MANET. Problems especially dynamic topology changes make routing very important in MANET design. This article aims to analyze AODV, DSDV and DSR routing protocols based on quality of service (QoS). The test scenario is based on the number of nodes, packet size, area of simulation, simulation time, simulation speed, mobility model, and propagation model. The simulation that has been done produces 4 graphs, each of which explains the packet delivery ratio, throughput, network routing load, and delay. Simulation results are obtained using NS2 network simulators through *. Tcl files and generate *. Tr (trace) and *.nam (animator) files. Simulation results show that the DSR routing protocol has better performance than AODV and DSDV in terms of PDR, throughput, network routing load, and delay. The average value of the DSR routing protocol is 657,498 on throughput and 0.244 milliseconds on delay.
Keywords: MANET, AODV, DSDV, DSR, Quality of Service.
MANET (Mobile ad hoc Network) in recent years has experienced very rapid development and has become popular and interesting to study because of its rapid availability but able to manage changes in topology independently, saving the spread of cost savings [1]. MANET offers convenience and speed in network deployments with difficult conditions though. An ad hoc network consists of hosts that are connected by routers without a fixed infrastructure and can be dynamically managed [4].
MANET (Mobile Ad Hoc Network) network is an autonomous system of mobile nodes that are connected wirelessly, each node works as an end system and router for every other node in the [2] network.
The problems encountered in MANET are nodes that move freely and are difficult to predict causing redundancy of packet delivery at each neighboring node, high power consumption and limited power supply because MANET often uses [1] batteries. In addition, several other problems related to dynamic topology, real-time communication and packet broadcast overhead [5]. To overcome problems, especially dynamic topology in MANET, the selection of routing protocols becomes very important in the design of MANET.
The topic of the MANET routing protocol has been proposed in several studies divided into reactive and proactive routing protocols. The tests include several stages of testing, namely packet radio delivery (PDR) or packet delivery fraction [11], end to end delay, throughput, routing load, packet dropped [8], [9], [10], routing} overhead [7], control overhead [4] and jitter
[2].
Packet delivery ratio (PDR) testing in several experiments conducted by OLSR protocol has a better ratio in packet delivery in the scenario of the number of different nodes [2], but in sending packets of different sizes and different intervals, DSR works better than AODV and DSDV [6]. Whereas DSR is
better in terms of delay than AODV [7], and AODVM is only superior in terms of delay [8]. Based on the quality of service (QoS) parameters of AODV, DSR and TORA performance using OPNET shows that AODV is better than DSR and TORA in packet delivery ratio (PDR), throughput, delay [1]. But in routing overhead (RO), TORA is superior compared to AODV and DSR [9].
Protocol performance analysis from several previous studies shows that the AODV routing protocol in some scenarios of 10 to 50 nodes using UDP and random way points for mobility have better PDR than OLSR and DSDV [4] [6]. But in [1] [2] with UDP scenario, the method of twoway ground and random way point, OLSR performance is better than AODV, DSR and DSDV when the number of nodes increases to 150 the number of nodes. From the mobility scenario DSR produces a better packet delivery ratio than AODV which experiences the worst performance [4], whereas if mobility followed by destination node changes, increasing the number of nodes and node speed} changes, AODV produces packet sending ratio is similar to DSR, whereas DSDV has the lowest performance [6] [7].
Analysis in the performance of throughput of 10 to 15 AODV nodes does not work as well as DSDV, AODV experiences an increase in throughput when the number of nodes is 40-50 and more [4] [2]. In the scenario the size of the packet sent is getting bigger, the performance of AODV and DSR results in a fairly similar throughput, whereas DSDV has the lowest performance. AODV also produces a fairly good throughput when there is an increase in mobility compared to DSDV and DSR [6] [7]. With the scenario of UDP and CBR usage and random way point mobility throughput from DSDV when network load occurs, increased mobility and increased network size have better performance than AODV and DSR [4]. OLSR produces better throughput than AODV, DSDV and DSR when communication using UDP, the method of twoway ground and random way points and the increasing number of nodes} This can be achieved because OLSR uses topology control [1].
Routing protocol performance on packet loss in OLSR produces better performance than DSR, AODV and DSDV on each number of nodes that increase [1] [2]. This can be achieved because OLSR uses MPR optimally in reducing topology control packets. Whereas for the resulting performance there is OLSR delay which shows better results than AODV, DSDR and DSDV, the performance of AODV is almost similar to the results from OLSR [1] [2] [4], but DSDV works better on the number of nodes} from 150 to 200 [1]. In the scenario of adding mobility DSR produces the delay with the smallest average compared to other protocols [6] [7], and is inversely proportional when the size of the packet sent is enlarged, DSR overcomes the delay with the worst results compared to AODV, OLSR and DSDV [4]. The resulting jitter shows OLSR with the lowest jitter compared to AODV and DSDV [3].
This article aims to analyze the performance of proactive routing network protocols (DSDV, OLSR) and reactive routing protocols (AODV, DSR) with a number of nodes that vary from 25 to 150. The parameter used to analyze the performance of the routing protocol} is QoS like PDR, throughput, packet loss and delay. The discussion of this article is organized as follows. The introduction discusses problems and solutions that can improve the quality of routing protocols and research related to MANET. Research Methods discusses the methodology, Result and Discussion discusses the simulation results and Conclusion will discuss the conclusions of the research results obtained from this article.
The methodology in this research article is simulation based. Fig. 1 shows the stages of the research carried out in this article.
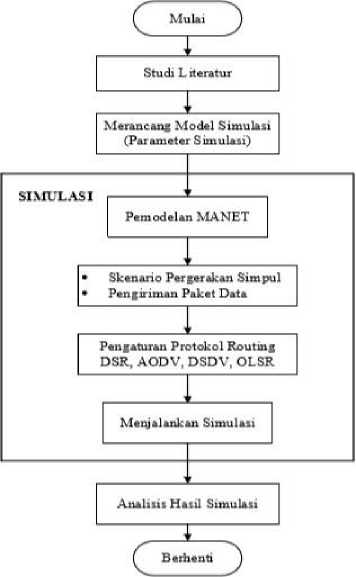
Figure 1. Flowchart Research Stages
The stages begin from conducting a literature study by studying several research articles related to reactive and proactive routing protocols. The results of the research study will be used as a reference in designing simulation models, such as programs, number of nodes used, packet size, mobility models and models of propagation used.
Data communication uses the concept of user datagram protocol (UDP) with the consideration that the process of sending data packets takes place without a complex set of processes. So that the data received can be processed directly by the application layer without checking the packets received accordingly or not.
The routing protocol will be simulated based on reactive routing protocols and proactive routing protocols namely AODV, DSR, DSDV, and OLSR. In a simulation scenario, the routing protocol will be given the same treatment, the number of nodes to be simulated varies from 25, 50, 75, 100, 150 to 200. The purpose of using the same number of nodes in each routing protocol is to ensure the accuracy obtained by the protocol the routing. The simulation speed is set at 20m / sec with a duration of 150 seconds. The addition of the number of nodes in the simulation is done to determine changes in the performance of the routing protocol to the addition of the number of nodes. The number of nodes that increase automatically makes the distance between nodes shorter and other nodes. This will affect the routing protocol in conducting route discovery and sending messages from the source node to the destination node.
The MANET routing protocol simulation is performed using NS2 on the Ubuntu 16.04 operating system. Simulation files using the TCL language are then visualized in the form of *.nam files and information data that occurs in the routing process is stored in a *.tr file as a trace file which is then analyzed using Gawk and the help of Microsoft Excel. The next stage is the analysis of routing protocol simulations based on QoS such as PDR, throughput, packet loss and delay. The results obtained from simulations run using NS2 based on parameters will provide conclusions about the performance of the reactive routing protocol and the proactive routing protocol based on the parameters used in Table 1.
Table 1. System Simulation Characteristic
|
Parameter |
Parameter Values |
|
Simulation Program |
NS 2.35 |
|
Operating System |
Ubuntu 16.04 LTS |
|
Routing Protocols |
AODV, DSR, DSDV |
|
Number of Nodes |
25, 50, 75, 100, 150, 200 |
|
Area |
500m x 400m |
|
Simulation Speed |
20m/s |
|
Radio Propagation Model |
Two Way Ground |
|
Transport Protocol |
User Datagram Protocol |
|
Packet Size |
512 Bytes |
|
MAC Protocols |
IEEE 802.11 |
|
RTS/CTS |
None |
|
Mobility Model |
Random Way Point |
|
Simulation Time |
150s |
The simulation is done by adding incremental nodes from 25 to 200 nodes. The main purpose of this simulation is to compare the performance of two types of routing protocols, reactive routing protocols and proactive routing protocols. Following will be displayed one of each scenario in the simulation process for each protocol.
Figure 2 shows the AODV protocol simulation scenario process with 100 nodes, the process is run according to the simulation parameters. The source node will send packets to the destination node with the one built through the AODV protocol. The results of each scenario in the AODV protocol will be displayed in graphical form.
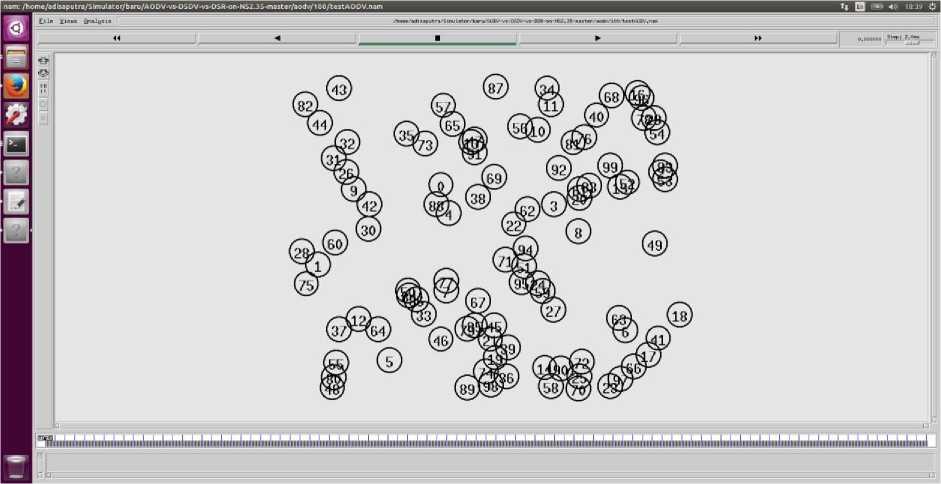
Figure 2. Simulation of AODV with 100 nodes
Figure 3 shows one of the scenarios of the DSR protocol simulation process. Movement of 50 nodes will affect the process of generating DSR protocol communication lines. Increasing the number of nodes in other scenarios will also affect the results of tests conducted on the simulation process.
! Wiθαdl<e
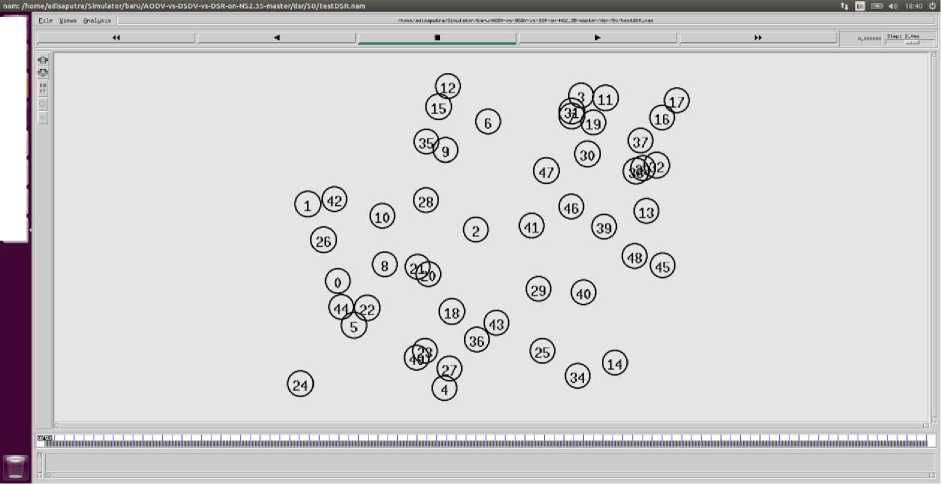
Figure 3. DSR simulation with 50 nodes
Figure 4 is a display of the simulation process scenario in the DSDV protocol. The simulation scenario that is displayed is the simulation process with 25 nodes. The movement of nodes with the number 25 will better show the process of generating communication lines in the simulation. The path generated in the simulation process will affect the test results on the simulation.`
<> JBI ®
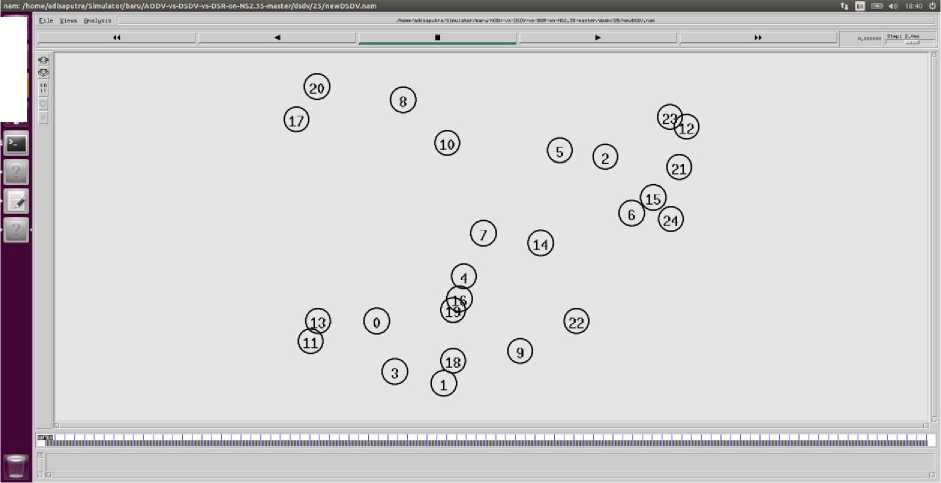
Figure 2. DSDV simulation with 25 nodes
PDR is one of the Quality of Service (QoS) parameters that demonstrate the success of the routing protocol. Fig. 5 shows that the DSR routing protocol has consistent performance, so the packet delivery ratio is higher than the AODV and DSDV routing protocols. The average ratio results generated by each routing protocol shows that besides DSR the performance of DSDV is very good when the number of nodes is 25 to 75, but decreases when the node exceeds 75, while AODV increases when the number of nodes is between 100 to 150 node.
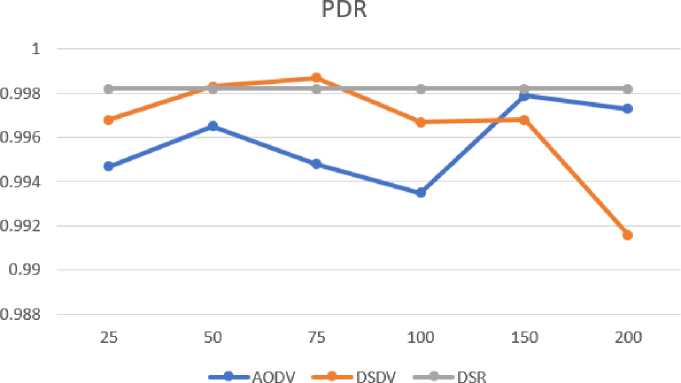
Figure 3. Graph of Packet Delivery Ratio simulation results
-
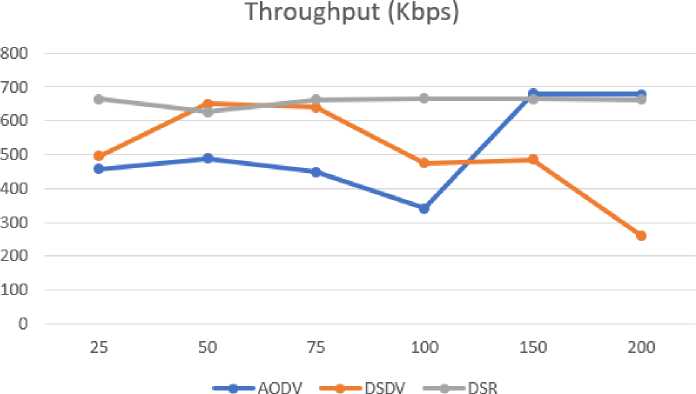
3.2. Throughput
Fig. 6 shows that the DSR routing protocol has the best performance in sending data, so that the total packet received by the node becomes the biggest compared to other routing protocols. DSDV performance increases when nodes are between 25 to 50 nodes, but decreases when the number of nodes exceeds 75 nodes. AODV increases when the number of nodes is more than 100 nodes. Following the average throughput generated from each node, DSR of 657,498 Kbps, AODV of 515,271 Kbps and DSDV of 501,146 Kbps.
Following are the performance results based on network routing load, DSDV produces
Figure 4. Graph of throughput performance of simulation results
the highest load when there are more nodes, while AODV increases when nodes number 25 to 100
NRL Load
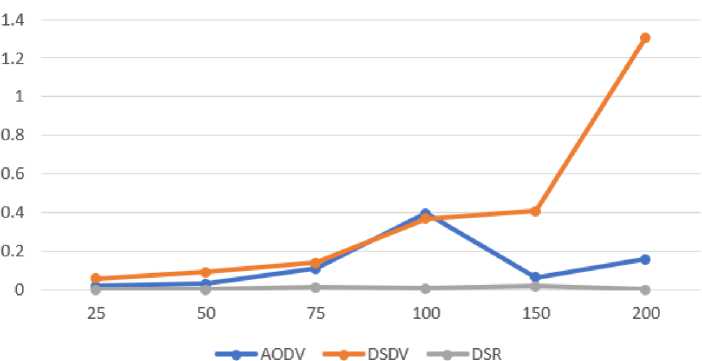
Figure 5. Grafik Network Routing Load
then decreases between 100 nodes and 150 nodes. DSR works very well, producing the lowest load.
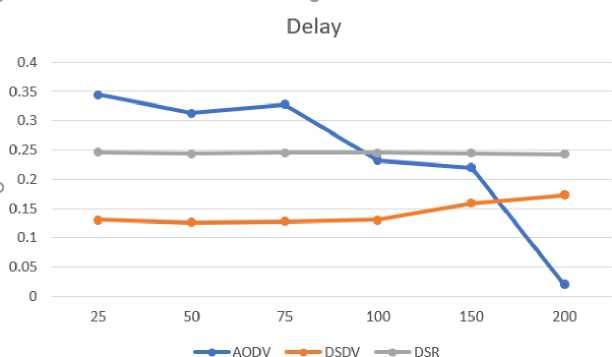
Fig. 8 shows that AODV has an increase in delay handling when there are more nodes, compared to stagnant DSR and DSDV performance is slightly more than DSR. The average delay value produced by the routing protocol is tested as follows, AODV is 0.242 milliseconds, DSR is 0.141 milliseconds, and DSDV is 0.244 milliseconds.
Every protocol that is simulated in this article uses the same parameters, this aims to ensure the accuracy of the simulation produced. This article aims to provide an analysis of the performance of protocols on MANET namely reactive protocols (AODV, DSR) and proactive protocols (DSDV) based on Quality of Service or QoS. QoS includes PDR, throughput,
-
Figure 6. Graph protocol performance against delay
Network load, and delay. Simulation results show that the DSR routing protocol has better performance than the AODV and DSDV protocols for several parameters.
The simulation process shows that the increase in the number of nodes affects the quality of communication carried out, the quality is measured based on PDR, Throughput, NRL and Delay. PDR produced by each scenario in the simulation process produces a DSR protocol with 0.9982 or around 99.82% over the other protocols. Then the DSR protocol throughput also has the best quality which is an average of 657,489 Kbps, but in terms of delay the AODV protocol has the lowest delay which is an average of 0.242938333 miliseconds. Based on the results of the study, that in the test scenario, the DSR protocol has better quality for communicating.
References
-
[1] Adam, N., Ismail, M. Y., & Abdullah, J. (2010, April). Effect of node density on
performances of three MANET routing protocols. In 2010 International Conference on
Electronic Devices, Systems and Applications (pp. 321-325). IEEE.
-
[2] Alamsyah, A., Setijadi, E., Purnama, I. K. E., & Purnomo, M. H. (2018). Analisis Kinerja
Protokol Routing Reaktif dan Proaktif pada MANET Menggunakan NS2. Jurnal Nasional Teknik Elektro dan Teknologi Informasi (JNTETI), 7(2), 138-143
-
[3] Araghi, T. K., Zamani, M., & Mnaf, A. B. A. (2013, September). Performance analysis in
reactive routing protocols in wireless mobile ad hoc networks using DSR, AODV and AOMDV. In 2013 International Conference on Informatics and Creative Multimedia (pp. 81-84). IEEE. tujuh
-
[4] Azwar, H., Batool, M., & Farooq, U. (2017). Performance analysis of AODV, DSR, OLSR and DSDV Routing Protocols using NS2 Simulator. International Journal of Technology and Research, 5(3), 56-59.empat
-
[5] Bai, Y., Mai, Y., \& Wang, N. (2017, April). Performance comparison and evaluation of the proactive and reactive routing protocols for MANETs. In 2017 Wireless Telecommunications Symposium (WTS) (pp. 1-5). sembilan
-
[6] Ghosekar, P., Katkar, G., & Ghorpade, P. (2010). Mobile ad hoc networking: imperatives and challenges. IJCA Special issue on MANETs, 3, 153-158.. sepulu
-
[7] Jha, R. K., & Kharga, P. (2015). A comparative performance analysis of routing protocols in MANET using NS3 simulator. International Journal of Computer Network and Information Security, 7(4), 62
68. delapan
-
[8] Kembuan, O., Widyawan, W., & Kusumawardani, S. S. (2012). Analisis kinerja reactive routing protocol dalam mobile ad-hoc network (MANET) menggunakan NS-2 (Network Simulator). Jurnal Nasional Teknik Elektro dan Teknologi Informasi (JNTETI), 1(1), 1-7.
-
[9] Palaniappan, S., & Chellan, K. (2015). Energy-efficient stable routing using QoS
monitoring agents in MANET. EURASIP Journal on Wireless Communications and Networking, 2015(1), 13.
-
[10] Tuteja, A., Gujral, R., & Thalia, S. (2010, June). Comparative performance analysis of DSDV, AODV and DSR routing protocols in MANET using NS2. In 2010 International Conference on Advances in Computer Engineering (pp. 330-333). IEEE.
-
[11] Vyas, K., & Chaturvedi, A. (2014, July). Comparative analysis of routing protocols in MANETS. In 2014 International Conference on Signal Propagation and Computer Technology (ICSPCT 2014) (pp. 692-697). IEEE.
2.1
Parameters tested in the simulation in this article include:
-
a. Packet Delivery Ratio (PDR)
PDR is a comparison of the number of packets successfully received by the destination node with the total packets sent by the source node.
PDH= (rρakcet( (Ipacket) * IOOpersen
(1)
-
b. Throughput
Is the total number of data packets received in a unit of time and illustrates the speed of sending data from a network. The higher the value of throughput, indicates that the performance of the routing protocol is getting better. Throughput values can be calculated using the following formula:
, , Ibityanyditerima * 8)
thmughput = (∕αmαs⅛⅛
(2)
c.
d.
Network Routing Load
Represents the number of routing packets that are transmitted per packet sent to the destination node. Basically, it considers the route and overhead of Media Access Control (MAC).
End to End Delay
Delay is a time delay for packets sent from the source node to the destination node.
i MalDclay
ETiatoeriaUelay = ---——---—
' total n Packet
(3)
-
259
Discussion and feedback