The Psychology of Risk Influence and Investor Sentiment on Investment Decision Making in the Indonesian Stock Market
on
Jurnal Ilmiah Akuntansi dan Bisnis
Vol. 18 No. 2, July 2023

AFFILIATION:
1,2,3Faculty of Administrative Sciences, Universitas Brawijaya, Indonesia
*CORRESPONDENCE:
THIS ARTICLE IS AVAILABLE IN:
DOI:
10.24843/JIAB.2023.v18.i02.p01
CITATION:
Sinaga, M. A. W., Nuzula, N. F. & Damayanti, C. R. (2023). The Psychology of Risk Influence and Investor Sentiment on Investment Decision Making in the Indonesian Stock Market. Jurnal Ilmiah Akuntansi dan Bisnis, 18(2), 197215.
ARTICLE HISTORY Received:
April 2 2023
Revised:
July 5 2023
Accepted:
July 17 2023
The Psychology of Risk Influence and Investor Sentiment on Investment Decision Making in the Indonesian Stock Market
Muhammad Apri Wirawan Sinaga1*, Nila Firdausi Nuzula2, Cacik Rut Damayanti3
Abstract
This study aims to provide empirical evidence concerning the influence of risk psychology and investor sentiment on investment decision-making. The focus of this research is individual investors in Malang, who participate in the Indonesian stock market. Data collection was conducted from December 2022 to February 2023, utilizing a proportionate stratified random sampling method. The sample size meeting the specified criteria was 100 respondents, whose data was subsequently analyzed using variance-based structural equation modeling, commonly referred to as SEM-PLS. The findings suggest that risk psychology has a positive, albeit insignificant, effect on investment decision-making. However, risk psychology significantly influences investor sentiment, which in turn has a substantial and positive effect on investment decision-making. The study also provides empirical evidence of a robust indirect effect of risk psychology on investment decision-making.
Keywords: psychology of risk, investor sentiment, investment decision
Introduction
The Indonesian Central Securities Depository Company (KSEI) reported that the number of share investors in the Indonesian capital market reached 4,002,289 in the first semester of 2022. This represents an increase of 15.96% from the previous year, with local individual investors making up 99.79% of the total. From 2019 to June 2022, these individual investors have grown annually by an average of 57.68% (ksei.co.id, 2022). The rise in individual investors can largely be attributed to the rapidly advancing technology that enables stock investment activities to be conducted anytime and anywhere via internet-connected smartphones. In addition, the Indonesia Stock Exchange (IDX), along with other member companies of the stock exchange, plays a significant role in promoting and educating about the capital market, thereby increasing the appeal of stock investment among the Indonesian population (idx.co.id, 2020).
In the process of evaluating stock prices, investors typically employ technical and fundamental analyses (Almujamed et al., 2011). These analyses guide investors towards making objective and rational investment decisions. However, investment decisionmaking is not straightforward, as these decisions can lead to either profits or losses depending on market performance (Diskartes, 2019). Consequently, investment decisionmaking remains a topic of active debate in academia and a significant issue in financial literature (Harjito, 2009).
In classical financial studies, such as Fama's (1970), markets are often presumed to be efficient, an assumption known as the efficient market hypothesis (EMH). This hypothesis posits that stock prices continually incorporate all available information, thereby preventing investors from realizing returns above average market performance. EMH also assumes that investors are rational, an assumption supported by the expected utility theory (EUT). Developed by Neumann & Morgenstern (1944), EUT seeks to define rational behavior when individuals face uncertainty, advocating that individuals should behave in a certain way when confronted with decision-making under uncertainty. As such, the theory is normative, prescribing how people should behave rationally, rather than descriptive, which would describe how people do behave.
Traditional financial theory considers the financial decision-maker as a rational homo economicus who makes highly rational decisions, applying limitless processing power to any available information, and maintains preferences well explained by expected utility theory (Bloomfield & Anderson, 2010). In contrast, Simon's (1997) bounded rationality theory argues that human beings are not fully rational due to cognitive limitations, limited knowledge, and the computational capacities of decisionmakers.
Irrational behavior among investors can be elucidated by the concept of behavioral finance. Research in behavioral finance shows that the investment decisionmaking process is influenced by a variety of behavioral biases that lead investors to deviate from rationality and make irrational investment decisions (Kumar & Goyal, 2015). As described by Ricciardi & Simon (2000), behavioral finance is an emerging field resulting from the amalgamation of psychology (the study of behavior and mental processes), sociology (the study of humans as social and group beings), and finance (related to values and decision-making).
More specifically, Pompian (2021) categorizes research in behavioral finance into micro and macro segments. This research falls under the purview of micro behavioral finance (BFMI), which aims to examine individual investor behavior or bias that deviates from the rational individual as outlined in standard finance. The central theory that underpins BFMI research is Prospect theory (Pompian, 2021).
Kahneman & Tversky's (1979) Prospect theory elucidates how individuals make decisions that deviate from rationality by evaluating gains and losses through two distinct cognitive processes: editing and evaluation. During the editing process, choices are ranked according to heuristic rules of thumb based on estimates or prior experience. In the evaluation process, reference points form the basis for assessing gains and losses differently, with individuals tending to feel the impact of losses more acutely than gains based on the same reference point.
Perfect market conditions, as postulated in economic and finance theory, don't always materialize in the actual stock market. Anomalies within the stock market can be
discerned through a thorough understanding of investor psychology. This observation led to the emergence of the discipline of behavioral finance, which examines how investors can deviate and make irrational decisions (Zahera & Bansal, 2018).
Financial decisions significantly impact asset liquidity, as explained by Charoenrook & Daouk (2005), pioneers in examining the impact of short-selling decisions globally. Short selling describes investor transactions that involve borrowing funds to sell shares they do not own at a high price, with the hope of repurchasing them when the share price drops. They note that stock market liquidity (ease of buying/selling shares) is significantly higher in countries where short-selling activity is permitted and practiced. Indonesia is one such country that allows short selling activities, although this policy was temporarily revoked in early March 2020 due to significant selling pressure in the market (cnbcindonesia.com, 2021). Moreover, short selling can incite panic selling, leading to a collapse in market performance (Rui Ma et al., 2016).
If we consider the performance of the IDX Composite, it remained relatively stable since 2019, showing no signs of market downfall even in the early phase of the coronavirus crisis in 2020. However, when the World Health Organization (WHO) declared the coronavirus a pandemic in March 2020. panic ensued among investors. Fear that share prices would continue to drop caused substantial selling pressure, leading to a significant dip in Indonesia's stock market performance and necessitating a temporary halt to trading (cnbcindonesia.com, 2022). The selling decisions during this period led to losses of up to -30%, despite the significant rebound in stock performance in the subsequent months. This suggests that the fundamental conditions were not as dire as indicated by the stock performance at that time. Supporting this view are data indicating an average daily trading volume for shares in March 2020 of 7,163.21 million shares, with a stock price index of 4,538.93, while in December 2019 the stock price index was still at 6,299.54 (ojk.go.id, 2022).
This research will focus on financial behavior, which can offer novel insights into understanding the phenomenon of financial decision-making (Baker & Nosfinger, 2010). Issues like panic selling elucidate how investors make irrational investment decisions, which can affect asset liquidity, market performance, and result in investor losses. As standard financial studies assume rational agents and market efficiency, they fail to explain some market anomalies. Thus, the relevance of a behavioral finance perspective is to clarify the various factors influencing investor behavior in making investment decisions (Nigam et al., 2018).
One of the theories in behavioral finance that explains how individuals deviate from rational decisions is the availability heuristic (Slovic et al., 1979). This theory proposes that individuals form risk perceptions of an event based on how readily available the information is to remember or visualize. When one has to make a judgment about the risk type or risk level of an investment asset, the brain employs several strategies to make a quick and correct decision. The availability heuristic assists investors in making swift decisions based on readily accessible information. However, this can introduce bias into investment decisions as it does not utilize comprehensive information (Tversky & Kahneman, 1973).
Risk can be defined as the magnitude of loss, potential loss, and uncertainty of loss (Yates & Stone, 1992). Ricciardi (2008) explains that in behavioral finance, the concepts of risk psychology and risk perception are essentially synonymous. This is based
on the understanding that individual risk assessments vary when confronted with risky choices. The significance of the loss is relative to the individual's circumstances. For instance, a $5,000 loss may be insignificant to a billionaire, but devastating to a lower-middle-class family. This perspective is supported by Heimer (1988) who asserts that risk psychology concerns how individuals perceive choices or decisions in the face of uncertain outcomes. The risk psychology of individual investors is vital for further research, given the escalating number of individual investors in the stock market, despite stocks being among the highest-risk assets in the capital market (ksei.co.id, 2022; Budiman, 2014).
Recent empirical reviews, such as that by Fridana & Asandimitra (2020), who studied individual investors in the Indonesian stock market, demonstrated that risk perception significantly affects investment decision-making. Their findings were corroborated by Pratama et al. (2020). However, Ahmed et al. (2022) found that perceived risk impacts investment decision-making for individual investors in the Pakistan stock market, but the effect was not significant. Based on these theoretical explanations, empirical research, and identified research gaps, the first hypothesis of this study is articulated as follows.
H1: Risk psychology significantly impacts investment decision-making.
With the increasing number of investors, competition in the stock market intensifies. Continuous share transactions through arbitrage influence prices, causing price volatility and resulting in market inefficiency (Burghardt, 2011). This inefficiency is often driven by investor sentiment (Baker & Wurgler, 2007). Investor sentiment refers to the propensity to speculate between optimism or pessimism based on individual beliefs and disregarding existing facts (Baker & Wurgler, 2006). Burghardt (2011) simplifies this concept, stating that investor sentiment is about how individuals form their beliefs about future market and security prices. Prior research has primarily focused on investor sentiment and market inefficiency (Baker & Wurgler, 2007; Haritha & Rashmi, 2020b). Hence, this research will center on the behavioral aspects of investor sentiment and investment decision-making.
Barberis et al. (2005) reference the theory of representativeness heuristic to explain how beliefs influence investment decisions. Established by Tversky & Kahneman (1974), this theory postulates that individuals affected by this heuristic perceive patterns in randomness. They then evaluate the likelihood of an event by its resemblance to another, thus forming beliefs based on the similarity of past information and hoping for repeat occurrences.
Empirical research by Haritha & Rashmi (2020a, 2020b) found that investor sentiment significantly affects the investment decision-making of individual investors in the Indian stock market. Similar results were presented by Pratama et al. (2020) in their research on the Indonesian stock market. Contrasting findings were reported by Koesoemasari et al. (2022), who found that optimistic investor sentiment had no significant impact on the Indonesian stock market. Therefore, based on these theoretical explanations, empirical research, and research gaps, the second hypothesis in this study is as follows.
H2: Investor sentiment significantly impacts investment decision-making.
Theoretical and empirical explanations suggest that risk perception and investor sentiment influence investment decision-making. Other empirical research indicates that risk perception significantly affects investor confidence in the Indonesian stock market
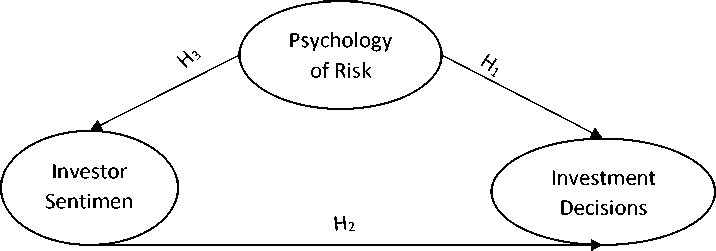
Figure 1. Research Model
Source: Processed Data, 2023
(Yuliani et al., 2017). This suggests that risk psychology can impact investor sentiment in the stock market, a phenomenon explained by cognitive dissonance theory. Cognitive dissonance is a psychological phenomenon that occurs when newly acquired information conflicts with pre-existing understanding, causing discomfort (Festinger, 1957). For example, an investor may decide to buy a stock product based on their positive risk perception. However, when the investor learns new information that contradicts their initial perception, cognitive dissonance occurs, pushing the investor to convince themselves that their decision was valid to alleviate discomfort ( Pompian, 2021). This leads to the third hypothesis in this study as follows.
H3: Risk psychology significantly affects investor sentiment.
Every investor's risk psychology perceives stock price movements differently, depending on their financial condition and other influencing factors. Meanwhile, investors rely on their sentiments when making decisions, especially when information is limited. This can sometimes contribute to poor market performance and result in sustained losses. Research on this topic is critical to understanding how investors follow market sentiment and take risks according to their perceptions and psychological factors when making investment decisions. Based on the theoretical flow and empirical research, the model for this research can be outlined accordingly as follows.
Research Method
This research utilizes quantitative methods and is categorized as explanatory research. Primary data were obtained using a questionnaire. The subjects of this study were individual investors in Malang who invest in the Indonesian stock market. Malang City was selected due to its distinction as one of the cities with the highest number of capital market investors in East Java (ojk.go.id, 2022). According to the Central Depository and Book Entry Settlement (C-BEST), there are 57,261 individual investors in Malang City (ojk.go.id, 2022). The minimum sample size for this study was calculated using the Slovin formula, yielding a sample size of approximately 100 respondents. This number is in alignment with Haryono (2016), who postulates that research using Structural Equation Modeling (SEM) analysis necessitates a sample of at least five times the number of indicator variables used. Data was collected from 28th December 2022 to 6th February 2023, resulting in a total of 137 samples, with 100 meeting the research criteria.
The study employed probability sampling using a proportionate stratified random sampling method, a random sampling technique that takes existing strata levels into
account. This technique is highly recommended for quantitative research as it enhances the validity of the resulting research data (Adnyana, 2021). The criteria for research respondents are as follows. The criteria for individual investors in this research refers to those who are directly involved in their investment decisions, without the intervention of private fund asset managers, focusing primarily on those aged 30 years and below. According to data from ksei.co.id (2022), 59.01% of individual investors in the capital market fall within this age bracket. Additionally, these investors should be active participants in the Indonesia Stock Exchange (IDX), as this indicates a familiarity with current market and economic conditions, ensuring that the respondents can provide relevant, up-to-date data. Moreover, the targeted individuals should possess at least 6 months of experience in stock investment. This requirement guarantees that they have a foundational understanding of stock investments, allowing them to effectively engage with and respond to the research questionnaire.
The variables studied in this study consisted of exogenous and endogenous variables. The psychology of risk is included in exogenous variables and is measured through indicators adapted from empirical research by Yuliani et al (2017), namely: 1) risk-averse, investors who tend to avoid risk, this type of investor usually prefers to play in low-risk investment instruments such as bonds or deposits, 2) risk taker/risk-seeking, are aggressive investors, namely investors who have a high level of risk tolerance and are in line with the expected returns, 3) moderate, this type investors are investors who tend to be rational and careful in selecting and making investment decisions.
Furthermore, endogenous variables consist of investor sentiment measured through indicators, 1) optimism or pessimism about the economy, this indicator is used to see investors' confidence in investing based on investors' optimism or pessimism about economic conditions, 2) optimism or pessimism about the stock market, this indicator is used to see investor confidence based on investor optimism or pessimism behavior toward stock market performance, 3) riskiness of the stock market, this indicator is used to find out whether investors act on their beliefs in facing risks in the stock market. (Bandopadhyaya & Jones, 2006), and investment decision-making is measured through indicators, 1) short-term investment decision, short-term investment is the purchase of temporary assets that aim to be re-marketed and can be converted into cash in a relatively short time. In other words, these are stocks that are held by investors to get a quick return and plan to sell them in the current accounting period, 2) long-term investment decision, long-term investments are non-current assets that are not used in operating activities to generate income. In other words, long-term investments are assets that investors want to own for more than one year or within a certain period (Ahmad, 2020).
The measurement scale employed in this study is the Likert scale, using a 1-5 interval to represent responses ranging from strongly disagree to strongly agree. To verify the validity and reliability of the research instruments, a pilot study was first conducted with 30 respondents. At this stage, validity is measured by the product-moment correlation method, which correlates the score of each item with the total score of the research instrument. An item is declared valid if the validity value is r ≥ 0.36, and the significance of the correlation value is ≤ 95%, or α = 0.05 and α = 0.01. Subsequently, the reliability of the research variables is assessed using Cronbach's alpha method, under the provision that the alpha value must be ≥ 0.70. The measurements at this stage are facilitated by the IBM SPSS Statistics 22 application on a computer device.
For data analysis, this study uses a variance-based structural equation model (SEM), also known as a partial least square (PLS). PLS-SEM is selected for its ability to work optimally with small sample sizes and complex models simultaneously. The SEM-PLS approach is divided into two stages of model evaluation: first, the evaluation of the measurement model (outer model), followed by the evaluation of the structural model (inner model).
In this study, variables are assessed using indicators, and each indicator is further evaluated using statement items. Accordingly, the measurement model used in this study is implemented in two stages. The first measurement model centers on the relationship between indicators and measuring items, known as lower-order constructs (LOC). The second measurement model concentrates on the relationship between variables and indicators, referred to as higher-order constructs (HOC). During the LOC measurement phase, the repeated indicator approach is employed, while the two-stage approach is utilized at the HOC measurement stage. Sarstedt et al. (2019) highly recommend this method, terming it the "embedded two-stage approach." The data analysis process in this study is facilitated by the SMART PLS 4 application on a computer device.
Result and Discussion
The results of the descriptive statistical analysis of the psychology of risk that show in Appendix 1 the average respondent's answers to each indicator are risk averse (3.59), risk taker (3.07), and moderate (4.01). This means that individual investors in Malang do not like risk and tend to be rational when assessing risk. Furthermore, the results of descriptive statistical analysis of investor sentiment that show in Appendix 1 the average respondent's answers to each indicator are optimism or pessimism about the economy (3.45), optimism or pessimism about the stock market (3.97), and riskiness of the stock market (4.23). This means that individual investors in the city of Malang are optimistic about economic conditions also with the stock market, and know the risks inherent in the stock market. Meanwhile, according to the Appendix 1 the results of descriptive statistical analysis of investment decision-making variables show the average response of respondents to each indicator of short-term investment decisions (3.20), and long-term investment decisions (3.73). This means that individual investors in Malang prefer to invest in the long term.
Evaluation of the measurement model was first carried out at LOC, then proceed to the HOC to evaluate the validity and reliability of each level. To evaluate the convergent validity of the provisions, the factor loading value is ≥ 0.50 (Chin, 1998), and the recommended average variance extracted (AVE) value is ≥ 0.50 (Hair et al, 2019). Discriminant validity in this study was evaluated based on the heterotrait-monotrait (HTMT) value, the recommended HTMT threshold value is ≤ 0.90 above it, and it is considered to have no discriminant validity (Henseler et al., 2015). The last is to test reliability by evaluating the value of composite reliability. The composite reliability value of 0.70-0.90 can be categorized as satisfactory to good. Meanwhile, the composite reliability value > 0.95 is considered excessive, thereby reducing construct validity (Hair et al, 2019).
Based on Table 1 the factor loading value of each item is >0.5 and the AVE value is >0.5 indicating that the LOC has met convergent validity. Furthermore, the composite reliability value as a whole shows a value of > 0.70 meaning that the LOC has good
Table 1. Factor loading Values, Composite Reliability, AVE (LOC)
|
Dimension/Indicators |
Items |
Factor Loading |
Composite Reliability |
AVE | |
|
Psychology |
Risk Averse |
X1.1.2 |
0.847 |
0.827 |
0.705 |
|
of Risk |
X1.1.5 |
0.832 | |||
|
Risk Taker |
X1.2.4 |
0.901 |
0.768 |
0.625 | |
|
X1.2.5 |
0.560 | ||||
|
X1.2.6 |
0.605 | ||||
|
Moderate |
X1.3.1 |
0.717 |
0.847 |
0.650 | |
|
X1.3.2 |
0.813 | ||||
|
X1.3.3 |
0.735 | ||||
|
X1.3.4 |
0.605 | ||||
|
X1.3.5 |
0.522 | ||||
|
Investor |
Optimism or pessimism about |
X2.1.1 |
0.745 |
0.717 |
0.574 |
|
Sentiment |
the economy |
X2.1.2 |
0.616 | ||
|
X2.1.3 |
0.625 | ||||
|
Optimism or pessimism about |
X2.2.1 |
0.921 |
0.914 |
0.825 | |
|
the stock market |
X2.2.2 |
0.895 | |||
|
Riskiness of the stock market |
X2.3.1 |
0.794 |
0.809 |
0.586 | |
|
X2.3.2 |
0.733 | ||||
|
X2.3.3 |
0.765 | ||||
|
Investment |
Short-term investment |
Y1.1.1 |
0.676 |
0.757 |
0.512 |
|
Decisions |
decision |
Y1.1.2 |
0.755 | ||
|
Making |
Y1.1.3 |
0.560 | |||
|
Y1.1.4 |
0.565 | ||||
|
Long-term investment decision |
Y1.2.1 |
0.677 |
0.813 |
0.521 | |
|
Y1.2.2 |
0.654 | ||||
|
Y1.2.3 |
0.763 | ||||
|
Y1.2.4 |
0.786 |
Source: Processed Data, 2023
reliability. While the HTMT correlation value for all indicators in Table 2, also shows a value of <0.90. which means that it also meets discriminant validity.
Based on Table 2 the AVE value of each variable in the study was >0.5 and the composite reliability value was at intervals of 0.7-0.9. It can be concluded that each HOC variable has convergent validity and good reliability. Furthermore, in Table 3 the correlation of HTMT values between variables shows a value of <0.90. Then the HOC is also considered to have met discriminant validity. Thus, both LOC and HOC are considered to have met the measurement model standards, so they will proceed to the evaluation of the structural model.
In the structural model, the coefficient model of the relationship between constructs is derived from the estimation results of a series of regression equations. So before assessing the structural relationship, collinearity must be checked first to ensure the regression results are not biased. Collinearity can be assessed by evaluating the VIF value. VIF values greater than 5 indicate possible collinearity problems between predictor constructs. Ideally, VIF values should be closer to 3 or lower (Hair et al., 2019). Table 4
Table 2. HTMT Correlations (LOC)
|
Correlations |
HTMT |
Correlations |
HTMT | |
|
0.526 |
Riskness stock market <-> Risk Taker |
0.882 | ||
|
Moderate <-> Economy Optimism |
0.605 |
Short-term decision <-> Optimism |
Economy |
0.720 |
|
Moderate <-> Long-term decision |
0.333 |
Short-term decision <-> term decision |
Long- |
0.605 |
|
Risk Averse <-> Economy Optimism |
0.701 |
Short-term decision <-> Moderate |
0.401 | |
|
Risk Averse <-> Long-term decision |
0.373 |
Short-term decision <-> Averse |
Risk |
0.279 |
|
Risk Averse <-> Moderate |
0.512 |
Short-term decision <-> Taker |
Risk |
0.807 |
|
Risk Taker <-> Economy Optimism |
0.849 |
Short-term decision <-> stock market |
Riskness |
0.801 |
|
Risk Taker <-> Long-term decision |
0.354 |
Stock Market Optimism Economy Optimism |
<-> |
0.566 |
|
Risk Taker <-> Moderate |
0.471 |
Stock Market Optimism term decision |
<-> Long- |
0.437 |
|
Risk Taker <-> Risk Averse |
0.199 |
Stock Market Optimism Moderate |
<-> |
0.474 |
|
Riskness stock market <-> Economy Optimism |
0.692 |
Stock Market Optimism Averse |
<-> Risk |
0.169 |
|
Riskness stock market <-> Long-term decision |
0.408 |
Stock Market Optimism Taker |
<-> Risk |
0.283 |
|
Riskness stock market <-> Moderate |
0.691 |
Stock Market Optimism Riskness stock market |
<-> |
0.775 |
|
Riskness stock market <-> Risk Averse |
0.185 |
Stock Market Optimism Short-term decision |
<-> |
0.380 |
Source: Processed Data, 2023
shows the VIF correlation value for all variables <3, so it can be concluded that there is no collinearity problem between the variables studied.
If collinearity is not a problem, the next step is to examine the R2 value of the endogenous construct. R2 measures the variance explained in each endogenous variable, therefore R2 can be called either the explanatory power of the model or the predictive power of the sample. R2 values range from 0 to 1, higher values indicate greater explanatory power. As a guideline, R2 values of 0.75, 0.50. and 0.25 can be considered to have substantial, moderate, and weak explanatory power (Hair et al., 2019). Based on Table 4, in general, the R2 value of each endogenous variable is in the 0-1 interval, which means that each endogenous variable has explanatory power in the model.
More specifically, the investor sentiment variable has an adjusted R2 value of 0.205, meaning that 20.5% of the investor sentiment variable can be explained by exogenous variables, namely psychology of risk, while the remaining 79.5% is influenced by other factors outside the model. Investment decision-making has an adjusted R2 value of 0.208, meaning that 20.8% of investment decision-making variables can be explained
|
Table 3. AVE, Composite Reliability (HOC) and HTMT (HOC) | ||
|
Variable |
AVE |
Composite reliability |
|
Psychology of Risk |
0.632 |
0.774 |
|
Investor Sentiment |
0.572 |
0.799 |
|
Investment Decisions Making |
0.710 |
0.830 |
|
Correlations |
HTMT | |
|
Investment Decisions Making <-> Investor Sentiment |
0.735 | |
|
Psychology of Risk <-> Investor Sentiment |
0.844 | |
|
Psychology of Risk <-> Investment Decisions Making |
0.651 | |
|
Source: Processed Data, 2023 | ||
by the psychology of risk and investor sentiment variables, and the remaining 79.2% is influenced by other factors outside the model.
Next is to assess the effect size in each path model by evaluating the value of f2 (F-square). F2 is calculated by recording every change in R2 when a certain construct is eliminated from the model. As a reference, values greater than 0.02, 0.15, and 0.35 describe small, medium, and large effect sizes (Hair et al., 2019).
Based on the f2 value shown in Table 4 when certain constructs are eliminated from the model, the investor sentiment variable has a small effect size on the investment decision-making variable, as well as the psychology of risk effect size on investment decision making which is included in the small category. Meanwhile, the size of the psychological effect of risk on investor sentiment is included in the medium category.
Next is to evaluate the predictive power in the model using PLSpredict, this test focuses on the measurement errors of all endogenous variable construct indicators.
Predictive power is evaluated based on a comparison of the error values produced by the PLS-SEM model and the linear regression model (LM). Research can compare the root mean squared error (RMSE) or mean absolute error (MAE) values to evaluate predictive power. But before that, the Q2 value must be evaluated first. If the Q2 value is positive it means that PLS-SEM produces smaller prediction errors and offers better predictive performance (Shmueli et al., 2019).
|
Table 4. VIF - Inner Model, R-Square Adjusted, F-Square | ||
|
Inner model Investor Sentiment |
Investment Decisions Making | |
|
Investor Sentiment |
1,270 | |
|
Psychology of Risk |
1,000 |
1,270 |
|
R-square adjusted R-Square |
R-Square Adjusted | |
|
Investor Sentiment |
0.213 |
0.205 |
|
Investment Decisions Making |
0.224 |
0.208 |
|
F-square Investor Sentiment |
Investment Decisions Making | |
|
Investor Sentiment |
0.148 | |
|
Psychology of Risk |
0.270 |
0.024 |
|
Source: Processed Data, 2023 | ||
Table 5. Comparison of RMSE PLS-SEM with LM
|
PLS-SEM |
LM |
Total | ||
|
Q2predict |
RMSE |
RMSE | ||
|
Short-term decision |
0.117 |
0.949 |
0.952 |
-0.003 |
|
Long-term decision |
0.050 |
0.984 |
0.992 |
-0.008 |
|
Economy optimism |
0.112 |
0.952 |
0.962 |
-0.010 |
|
Stock market optimism |
0.057 |
0.980 |
0.962 |
0.018 |
|
Riskness stock market |
0.334 |
0.825 |
0.827 |
-0.002 |
Source: Processed Data, 2023
Based on Table 5 the Q2 value on all endogenous indicators shows a positive number, meaning that PLS-SEM generally produces smaller prediction errors. Further proof is carried out by comparing the RMSE values. The total score in the table is obtained based on the subtraction results between RMSE on PLS-SEM and LM, a negative total score indicates that PLS-SEM produces a smaller prediction error and vice versa. Four of the five indicators produce negative values so the majority of the RMSE generated by PLS-SEM has a smaller prediction error. So that conclusions can be drawn based on the PLSpredict estimation results, the proposed research model has good predictive power in the medium category.
After evaluating the explanatory power and predictive power of the model, the last step is to assess the statistical significance and relevance of the path coefficient to test the research hypothesis through the bootstrapping method. The path coefficient values are standardized in the range of values 1 to -1, with a coefficient value close to 1 representing a stronger positive relationship and a coefficient value close to -1 representing a strong negative relationship (Hair et al., 2019). The significance of the relationship can also be evaluated through p-values <0.05 which indicate a significant relationship and p-values >0.5 indicating an insignificant relationship (Sarstedt et al., 2019). The results of hypothesis testing as shown in Table 6. will be explained as follows.
The analysis reveals a series of interconnected findings. The psychology of risk has a path coefficient value of 0.155 on investment decision-making, suggesting a positive Table 6. Path Coefficient-Direct Effect and Indirect Effect
|
Original Sample |
Sample Mean |
STDEV |
T statistics |
P values |
Significance Test | |
|
Psychology of Risk -> |
0.155 |
0.150 |
0.121 |
1,278 |
0.101 |
Not |
|
Investment Decisions Making Investor Sentiment - |
0.382 |
0.388 |
0.099 |
3,866 |
0.000 |
Significance Significance |
|
> Investment Decisions Making Psychology of Risk -> |
0.461 |
0.483 |
0.084 |
5,494 |
0.000 |
Significance |
|
Investor Sentiment Psychology of Risk -> |
0.176 |
Indirect Effect 0.188 0.061 |
2,873 |
0.002 |
Significance | |
Investment Decisions
Making
Source: Processed Data, 2023
influence. This means that as the psychology of risk increases, investment decisionmaking also rises, with every increment in the psychology of risk enhancing investment decision-making by 15.5%. However, the associated P-value of 0.101, being greater than 0.05, denotes an insignificant effect, leading to the rejection of hypothesis H1. In the context of investor sentiment's impact on investment decision-making, the path coefficient value stands at 0.382. This suggests a direct correlation where an uptick in investor sentiment results in a 38.2% increase in investment decision-making. Given the P-value of 0.000 is below 0.05, this effect is deemed significant and hypothesis H2 is accepted. Lastly, regarding the influence of the psychology of risk on investor sentiment, the path coefficient value is 0.461. This indicates that a rise in the psychology of risk amplifies investor sentiment by 46.1%. With a P-value of 0.000. which is less than 0.05, this relationship is significant, leading to the acceptance of hypothesis H3.
Based on the results of hypothesis testing, the psychology of risk variable directly has a positive but not significant effect on the investment decision-making variable. The results of this study are supported by Ahmed et al. (2022) who examined individual investors in the Pakistan stock market, where their findings also said that perceived risk did not have a significant effect on investment decisions. The research explained that this can happen for several reasons, 1) most investors in Pakistan are not very sensitive to losses that affect their investments, and 2) Investors in the Pakistan stock market tends to like investing in blue-chip stocks because of the smaller chance of loss. Ayudiastuti (2021), who examined investors in the investment gallery at Universitas Nusantara PGRI Kediri, Indonesia, also found a positive but not significant influence between perceived risk and investment decisions. These findings also support the results of this study and in the research explained that this can happen because investors in the Universitas Nusantara PGRI investment gallery tend to be more courageous when making investment decisions so they don't consider risk too much when making decisions.
The psychology of risk in this study is measured by how individuals take risks, avoid risks, or risk moderate. From the perspective of financial behavior, investors will tend to take risks or avoid risks based on subjective risk assessments as described in the prospect theory (Kahneman & Tversky, 1979). However, this study found that on average investors are included in the moderate risk category which tends to be more rational in making decisions. In terms of making investment decisions, investors also tend to prefer long-term investments and this can reduce the impact on psychology when experiencing losses because long-term investment investors do not enter the market too often (Ahmed et al., 2022). The results of this study are also supported by the expected utility theory of Neumann & Morgenstern (1944). This theory is normative which explains how individuals should behave rationally when faced with making decisions under risk. It can be concluded that individual investors in the city of Malang tend to be rational in risk assessment when faced with making direct investment decisions.
Nevertheless, the results of the indirect effect test show that there is a positive and significant indirect effect of the psychology of risk on investment decision-making. This means that investors are also not fully rational, as described in the theory of bounded rationality by Simon (1997) this is due to cognitive limitations, limited knowledge, and computational capacity of decision makers. So even though investors tend to be rational in assessing risk, investors also depend on their beliefs which can cause investors' investment decisions to deviate from rationality.
Based on the results of hypothesis testing, the investor sentiment variable has a large tendency to directly influence investment decision-making. The results of this study are in line with the research findings of Haritha & Rashmi (2020a) and Haritha & Rashmi (2020b) who examined individual investors in the Indian stock market, as well as Pratama et al. (2020), who examined retail investors on the Indonesia Stock Exchange in general, also found that there was a significant influence of investor sentiment on investment decision making.
Investor sentiment in this study is defined as the irrational behavior of investors who act based on their beliefs in assessing the market so that it has an impact on making decisions that are less than optimal. This belief can be shown by investors' optimism or pessimism about economic conditions or the stock market (Baker & Wurgler, 2006). The representativeness heuristic theory discovered by Tversky & Kahneman (1974) explains that individuals can form beliefs based on similar information from the past and then make decisions in the hope that the same thing will happen again. This means that the availability of information plays a very important role when forming investor confidence. This theory supports the findings of this study where investors form optimism or pessimism in the stock market based on the availability of company information and the ease of obtaining market information from various media.
Based on the results of hypothesis testing, the psychology of risk variable has a large tendency to directly influence investor sentiment. The results of this study are in line with the findings of research by Yuliani et al., (2019) which explain that perceived risk has a significant and positive effect on investor confidence in the stock market. The higher the risk perception of investors in investing in stocks, the higher their confidence in investing in the stock market.
The psychology of risk can be interpreted as an individual's subjective assessment (perception) regarding the level of risk, while investor sentiment is identical to how investors form their beliefs in the stock market (Ricciardi, 2008; Burghardt, 2011). The psychology of risk, which is measured by how investors tend to avoid risk, take risks, or moderately, is proven to increase investor confidence in investing in stocks. The findings of this study are supported by the cognitive dissonance theory discovered by Festinger (1957).
This theory explains psychological phenomena regarding the discomfort that arises when an individual's perception is not under his or her beliefs so that the individual forms new beliefs. This means that even if investors fall into the category of risk averse, risk takers, or rational investors, they will still increase investor confidence in the stock market. This is done to avoid the psychological discomfort experienced related to the risk of investing in stocks.
To best of the authors’ knowledge, research on financial behavior related to investment decision-making in the Indonesian stock market is still limited and only focuses on examining one-way influences. This research does not only focus on the direct effect but also the indirect effect of the psychology of risk on investment decision-making. So even though this research has not succeeded in proving that there is a significant direct effect of the psychology of risk on investment decision-making, this research provides new findings that the psychology of risk has a significant indirect effect on investment decision-making. The ability of individual investors in the city of Malang in assessing stock investment risk which tends to be rational in assessing investment risk has been proven
to encourage investor confidence to invest in stocks. This can be a lesson for individual investors not to rely too much on their beliefs when investing in stocks because this can be biased and make investment decisions that are not optimal.
Conclusion
The results of this study have not been able to prove that there is a significant psychology of risk influence on investment decision-making. This explains that individual investors in the city of Malang are quite good at evaluating risk and tend to be rational in assessing risk when investing in the stock market. The results of this study prove that there is a significant influence of investor sentiment on investment decision-making. The optimism of investors in Malang City towards economic development, stock market performance, and stock market risk are proven to be able to encourage investors to invest in these assets. The results of this study also prove that there is a significant influence of the psychology of risk on investor sentiment. The ability of individual investors in the city of Malang in assessing stock investment risk which tends to be rational in assessing investment risk has been proven to encourage investor confidence to invest in stocks.
This study provides empirical evidence that there is a positive and significant indirect effect of psychology of risk on investment decision making. This explains that although individual investors in Malang tend to be rational in assessing investment risk, they will not invest in something they do not believe in. Nevertheless, this research does not test whether investor sentiment mediates between psychology of risk variables and investment decision making, so this is expected to be a suggestion for future research and add other relevant variables so that the concept of financial behavior can develop and become the basis for making investment decisions better for individual investors.
References
Adnyana. (2021). Populasi dan Sampel. In T. S. Tambunan (Ed.), Metode Penelitian Pendekatan Kuantitatif (pp. 103-130). bandung: Media Sains Indonesia.
Ahmad, M. (2020). Does underconfidence matter in short-term and long-term investment decisions? Evidence from an emerging market. Management Decision, 59(3), 692709. doi:https://doi.org/10.1108/MD-07-2019-0972
Ahmed, Z., Rasool, S., Saleem, Q., Ali Khan, M. A., & Kanwal, S. (2022). Mediating Role of Risk Perception Between Behavioral Biases and Investor’s Investment Decisions. SAGE Open, 12(2), 1-18. doi:https://doi.org/10.1177/21582440221097394
Almujamed, Fifield, & Power. (2011). An investigation of the role of technical analysis in Kuwait. Qualitative Research in Financial Markets, 5(1), 43-64.
doi:https://doi.org/10.1108/17554171311308959
Ayudiastuti, L. (2021). Analisis Pengaruh Keputusan Investasi Mahasiswa. Jurnal Ilmu Manajemen (JIM), 9(3), 1138-1149.
doi:https://doi.org/10.26740/jim.v9n3.p1138-1149
Baker, H. K., & Nosfinger, J. R. (2010). Behavioral Finance (Investor, Corporations, and Markets). New Jersey: John Wiley & Sons, Inc.
Baker, M., & Wurgler, J. (2006). Investor Sentiment and Cross-Section of Stock Returns.
Journal of Finance, LXI(4), 1645-1680. doi:https://doi.org/10.1111/j.1540-
Baker, M., & Wurgler, J. (2007). Investor Sentiment in the Stock Market. Journal of Economic Perspectives, 21(2), 129-151. doi:https://doi.org/10.1257/jep.21.2.129
Bandopadhyaya, A., & Jones, A. L. (2006). Measuring Investor Sentiment in Equity Market. Journal of Asset Management, 7(3/4), 208–215.
doi:https://doi.org/10.1057/palgrave.jam.2240214
Barberis, N., Schleifer, A., & Vishny, R. W. (2005). A Model of Investor Sentiment. In R. H. Thaler (Ed.), Advances in Behavioral Finance (pp. 423-459). New York: Russell Sage Foundation.
Bloomfield, R., & Anderson, A. (2010). Experimental Finance. In H. K. Baker, & J. R. Nosfinger (Eds.), Behavioral Finance (Investor, Corporations, and Markets) (pp. 113-130). New Jersey: John Wiley & Sons, Inc.
Budiman, R. (2014). Strategi Manajemen Portofolio Investasi Saham. Jakarta: Gramedia.
Burghardt, M. (2011). Retail Investor Sentiment and Behavior (1st ed.). Germany: Springer Fachmedien Wiesbaden.
Charoenrook, A., & Daouk, H. (2005). A study of market-wide short-selling restrictions. SSRN 687562. doi:http://dx.doi.org/10.2139/ssrn.687562
Chin, W. W. (1998). The Partial Least Squares Approach to Structural Equation Modeling. Modern Methods for Business Research, 2, 295-336.
cnbcindonesia.com. (2021, February 1). Retrieved December 6, 2022, from
cnbcindonesia.com: https://www.cnbcindonesia.com/market/20210201112334-17-220085/short-selling-batal-diberlakukan-lagi-ini-alasan-bursa-efek
cnbcindonesia.com. (2022, January 19). IHSG Pernah Beberapa Kali Dihentikan, Apa Itu Trading Halt? Retrieved October 12, 2022, from cnbcindonesia.com:
https://www.cnbcindonesia.com/market/20220119092416-17-308581/ihsg-pernah-beberapa-kali-dihentikan-apa-itu-trading-halt
Diskartes, A. (2019). TAKE PROFIT Mencari Untung di Pasar Modal Secara Rasional. Jakarta: Gramedia.
Fama, E. F. (1970). Efficient capital markets: A review of theory and empirical work. The journal of Finance, 25(2), 383-417. doi:https://doi.org/10.2307/2325486
Festinger, L. (1957). A theory of cognitive dissonance. Stanford University Press.
Fridana, & Asandimitra. (2020). Analisis Faktor yang Memengaruhi Keputusan Investasi. Studi ini dilakukan pada mahasiswi di Surabaya. Jurnal Muara Ilmu Ekonomi dan Bisnis, 4(2), 396-405. doi:https://doi.org/10.24912/jmieb.v4i2.8729
Hair, J. F., Risher, J. J., Sarstedt, M., & Ringle, C. M. (2019). When to use and how to report the results of PLS-SEM. European Business Review, 31(1), 2-24.
doi:https://doi.org/10.1108/EBR-11-2018-0203
Haritha, P. H., & Uchil, R. (2020a). Influence of investor sentiment and its antecedent on investment decision-making using partial least square technique. Management Research Review, 43(11), 1441-1459. doi:https://doi.org/10.1108/MRR-06-2019-0254
Haritha, P. H., & Uchil, R. (2020b). Impact of investor sentiment on decision-making in Indian stock market: an empirical analysis. Journal of Advances in Management Research, 17(1), 66-83. doi:https://doi.org/10.1108/JAMR-03-2019-0041
Harjito, A. (2009). Harjito, A. 2009. Keuangan Perilaku (Menganalisis Keputusan Investor) (1st ed.). Yogyakarta: Ekonesia.
Haryono, S. (2016). Metode SEM untuk Penelitian Manajemen dengan AMOS, LISREL, PLS. Jakarta: Intermedia Personalia Utama.
Heimer, C. A. (1988). Social Structure, Psychology, and the Estimation of Risk. Annual Reviews Inc., 14, 491-519. Retrieved from https://www.jstor.org/stable/2083329
Henseler, J., Ringle, C. M., & Sarstedt, M. (2015). A new criterion for assessing discriminant validity in variance-based structural equation modeling. Journal of the Academy of Marketing Science,, 43(1), 115-135. doi:https://doi.org/10.1007/s11747-014-0403-8
idx.co.id. (2020. December 3). Retrieved Juny 20. 2020. from
https://www.idx.co.id/berita/press-release-detail/?emitenCode=1423
Kahneman, D., & Tversky, A. (1979). Prospect theory: an analysis of decision under risk.
Journal of the Econometric Society, 47(3), 263-291.
doi:https://doi.org/10.2307/1914185
Koesoemasari, D. P., Haryono, T., Trinugroho, I., & Setiawan, D. (2022). Investment Strategy Based on Bias Behavior and Investor Sentiment in Emerging Markets. ETIKONOMI, 21(1), 1-20. doi:https://doi.org/10.15408/etk.v21i1.22290
ksei.co.id. (2022, July 9). Retrieved October 22, 2022, from
https://www.ksei.co.id/files/uploads/press_releases/press_file/id-
id/208_berita_pers_didominasi_milenial_dan_gen_z_jumlah_investor_saham_t embus_4_juta_20220725182203.pdf
Kumar, S., & Goyal, N. (2015). Behavioural biases in investment decision making–a systematic literature review. Qualitative Research in financial markets, 7(1), 88108. doi:https://doi.org/10.1108/QRFM-07-2014-0022
Nigam, R. M., Srivastava, S., & Banwet, D. K. (2018). Behavioral Mediators of Financial Decision Making – A Meta-Analysis. Review of Behavioral Finance., 10(1), 2-41. doi:https://doi.org/10.1108/RBF-07-2016-0047
ojk.go.id. (2022). Retrieved December 6, 2022, from ojk.go.id:
https://www.ojk.go.id/id/kanal/pasar-modal/data-dan-statistik/statistik-pasar-modal/default.aspx
Pompian, M. M. (2006). Behavioral Finance and Wealth Management: How to Build Optimal Portfolio that account for Invest Biases. Canada: John Willey & Sons Inc.
Pompian, M. M. (2021). Behavioral Finance And Your Portfolio: A Navigation Guiede for Building Wealth. New Jersey: John Wiley & Sons Inc.
Pratama, A. O., Purba, K., Jamhur, J., & Tri Prasetyo, P. B. (2020). Pengaruh Faktor Perilaku Investor Saham Terhadap Keputusan Investasi di Bursa Efek Indonesia. Moneter: Jurnal Akuntansi dan Keuangan, 7(2).
doi:https://doi.org/10.31294/moneter.v7i2.8659
Ricciardi, V. (2008). The psychology of risk. In F. J. Fabozzi (Ed.), Investment management and financial management (Vol. 2, pp. 85–111). Hoboken: John Wiley & Sons.
Ricciardi, V., & Simon, H. K. (2000). What is behavioral finance? Business, Education & Technology Journal, 2(2), 1-9.
Rui Ma, Anderson, H. D., & Marshall, B. R. (2016). International stock market liquidity : a review. Manegerial Finance, 42(2), 118-135. doi:https://doi.org/10.1108/MF-04-2015-0096
Sarstedt, M., Hair, J. F., Cheah, J.-H., & Becker, J. M. (2019). How to specify, estimate, and validate higher-order constructs in PLS-SEM. Australasian Marketing Journal. doi:https://doi.org/10.1016/j.ausmj.2019.05.003
Shmueli, G., Sarstedt, M., Hair, J. F., Cheah, J., Ting, H., Vaithilingam, S., & Ringle, C. M. (2019). Predictive model assessment in PLS-SEM: guidelines for using PLSpredict. Working Paper. doi:https://doi.org/10.1108/EJM-02-2019-0189
Simon, H. A. (1997). Models of bounded rationality: Empirically grounded economic reason (Vol. III). Cambridge: MIT Press.
Slovic, P., Fischhoff, B., & Lichtenstein, S. (1979). Perceived of Risk: Psychological Factors Implications. Decision Research.
Tversky, A., & Kahneman, D. (1973). Availability: A heuristic for judging frequency and probability. Cognitive Psychology, 5, 207–232. doi:https://doi.org/10.1016/0010-0285(73)90033-9
Tversky, A., & Kahneman, D. (1974). Judgment under uncertainty: heuristics and biases.
Science, 185, 1124-1131. doi:https://doi.org/10.1007/978-94-010-1834-0_8
Von Neumann, J., & Morgenstern, O. (1944). Theory of games and economic behavior, Science Editions. New York: John Wiley and Sons Inc.
Yates, J. F., & Stone, E. R. (1992). The risk construct. In J. F. Yates (Ed.), Risk-taking behavior (pp. 1-25). John Wiley & Sons.
Yuliani, Isnurhadi, & Jie, F. (2017). Risk perception and psychological behavior of investors in emerging market: Indonesian Stock Exchange. Investment Management and Financial Innovations, 14(2), 347-358. doi:http://dx.doi.org/10.21511/imfi.14(2-2).2017.06
Zahera, S. A., & Bansal, R. (2018). Do investors exhibit behavioral biases in investment decision making? A systematic review. Qualitative Research in Financial Markets, 10(2), 210-251. doi:https://doi.org/10.1108/QRFM-04-2017-0028
Appendix
Appendix 1. Descriptive Statistic
|
Res Variables Items 1 2 |
pons 3 |
e (%) 4 |
5 |
Mean |
|
Descriptive statistic of Psychology of Risk | ||||
|
X.1.1.1 Probability of a future price increase 0 2 |
8 |
28 |
62 |
4,5 |
|
X.1.1.2 Set targets every stock transaction 1 9 |
25 |
39 |
26 |
3,8 |
|
X.1.1.3 Stability of big companies’ stock 3 10 |
33 |
41 |
13 |
3,51 |
|
X.1.1.4 Tend to short-term investment 6 22 |
11 |
31 |
30 |
3,57 |
|
X.1.1.5 Sell the stock when the price fall 17 35 Risk Averse |
26 |
17 |
5 |
2,58 3,59 |
|
X.1.2.1 The growth of economic country 20 38 |
28 |
12 |
2 |
2,38 |
|
X.1.2.2 Inflation rate 7 48 |
26 |
14 |
5 |
2,62 |
|
X.1.2.3 Company financial reports 19 37 |
22 |
20 |
2 |
2,49 |
|
X.1.2.4 High returns oriented 0 3 |
20 |
47 |
30 |
4,04 |
|
X.1.2.5 Speculative trading 5 22 |
29 |
29 |
15 |
3,27 |
|
X.1.2.6 Dissatisfied with small returns 2 12 Risk Taker |
32 |
27 |
27 |
3,65 3,07 |
|
X.1.3.1 Always be careful 3 2 |
9 |
26 |
60 |
4,38 |
|
X.1.3.2 Collect all relevant information 1 3 |
6 |
44 |
46 |
4,31 |
|
X.1.3.3 Balanced return and risk oriented 1 3 |
14 |
34 |
48 |
4,25 |
|
X.1.3.4 Small returns it’s fine 6 22 |
28 |
29 |
15 |
3,25 |
|
X.1.3.5 Long-term investment 0 7 |
18 |
36 |
39 |
4,07 |
|
X.1.3.6 Price reflects the information 2 12 Moderate |
17 |
42 |
27 |
3,8 4,01 |
|
Descriptive statistic of Investor Sentiment | ||||
|
X.2.1.1 Perspective of current economic 1 8 |
26 |
42 |
3,78 |
4,5 |
|
policies | ||||
|
X.2.1.2 Economic conditions for the next six 1 12 |
38 |
41 |
3,43 |
3,8 |
|
months | ||||
|
X.2.1.3 Current job availability 8 27 Optimism or pessimism about the economy |
20 |
31 |
3,16 |
3,51 3,45 |
|
X.2.2.1 Availability of company information 0 2 |
12 |
49 |
37 |
4,21 |
|
X.2.2.2 Ease of getting information 0 3 |
4 |
42 |
51 |
4,41 |
|
X.2.2.3 Ask for feedback from others 9 21 Optimism or pessimism about the stock market |
19 |
34 |
17 |
3,29 3,97 |
|
X.2.3.1 Know the risks of stock investment 0 3 |
7 |
38 |
52 |
4,39 |
|
X.2.3.2 High risk high return 0 6 |
17 |
30 |
47 |
4,18 |
|
X.2.3.3 Liquidity of stock 0 7 Riskiness of the stock market |
14 |
39 |
40 |
4,12 4,23 |
|
Descriptive statistic of Investment Decision Making | ||||
|
Y1.1.1 Invest in the stock market rather than in 2 10 |
22 |
46 |
20 |
3,72 |
|
fixed income securities | ||||
|
Y1.1.2 Engage in stock portfolio management 9 35 |
26 |
21 |
9 |
2,86 |
activities at least twice a week
|
Y1.1.3 |
Put at least half of my investment money into the stock market |
22 |
27 |
25 |
21 |
5 |
2,6 |
|
Y1.1.4 do your own investment research instead of resorting to outside advice Short-term investment decision |
5 |
13 |
21 |
34 |
27 |
3,65 3,20 | |
|
Y1.2.1 |
Save at least 10% of gross income |
0 |
6 |
20 |
42 |
32 |
4 |
|
Y1.2.2 |
Has a portfolio that focuses on several asset classes |
2 |
8 |
16 |
47 |
27 |
3,89 |
|
Y1.2.3 |
invest some money in long-term assets where the money will be tied up and will not be accessed for many years |
4 |
17 |
33 |
33 |
13 |
3,34 |
|
Y1.2.4 Manage portfolio for long term returns to avoid repeat purchase tax Long-term investment decision |
3 |
5 |
32 |
38 |
22 |
3,71 3,73 | |
Source: Processed Data, 2023
Jurnal Ilmiah Akuntansi dan Bisnis, 2023 | 215
Discussion and feedback