How Performance Mediate the Effects of Participation and Control Environment on Transparency
on
Jurnal Ilmiah Akuntansi dan Bisnis
Vol. 17 No. 1, January 2022

AFFILIATION:
1,2,3,4 Faculty of Economics and Business, Universitas Jambi, Indonesia
*CORRESPONDENCE:
THIS ARTICLE IS AVAILABLE IN:
DOI:
10.24843/JIAB.2022.v17.i01.p05
CITATION:
Rahayu, S., Yudi, Rahayu, Jumaili, S. (2022). How Performance Mediate the Effects of Participation and Control Environment on Transparency. Jurnal Ilmiah Akuntansi dan Bisnis, 17(1), 66-83.
ARTICLE HISTORY Received:
20 December 2021
Revised:
18 January 2022
Accepted:
19 January 2022
How Performance Mediate the Effects of Participation and Control Environment on Transparency
Sri Rahayu1*, Yudi2, Rahayu3, Salman Jumaili4
Abstract
This study examines the effect of participation and the internal environment on transparency with performance as a mediator. PLS 3.0 was used to analyze the research data. We were collecting data using a questionnaire. The research respondents were principals, teachers, and employees of public elementary schools. The number of respondents was as many as three participants. The results showed that participation and control environment had a positive effect on performance. Performance has a positive impact on transparency. Performance can mediate the effect of participation and control environment on transparency. Schools and local governments can use performance measurement with educational scorecards to assess school performance. School performance is evaluated comprehensively, not only from the management of academic activities. Schools must pay attention to financial management performance as well. School transparency must also be considered to increase the trust of all stakeholders.
Keywords: educational scorecard, school, stakeholders, academic, finance
Introduction
It is compulsory for citizen aged 7-15 years to attend primary education. Basic education in Indonesia is elementary school and junior high school (Article 17, Law No. 20 of 2003). Education is the door to the future of the younger generation (Kasali, 2014). Education increase the possibility for someone to generate income (Saraswati, 2011). The OECD (2018) shows that the quality of education in Indonesia still faces many problems, so primary education is crucial.
Performance measurement at the school level is still not widely done. The measure of educational performance is often done from an academic point of view and at the regional level. The Human Development Index (HDI) is often one of the benchmarks for achieving educational performance. For 2019, the HDI of Jambi Province has reached 70.65, not too far behind compared to the National HDI of 71.39 (Kemendikbud, 2020). In addition, the Gross Participation Rate (GPR) /Angka Partisipasi Kasar (APK) and Net Participatory Rate (NER)/ Angka Partisipasi Bersih (APM) are also commonly used as other measures of educational performance achievement.
GER is the level of population participation at a level of education, regardless of the age of the population. GER is a complementary indicator of NER. NER shows the percentage of the population who attends school on time or shows how much of the population attends school at an age that is in accordance with the provisions of the school-age group at a certain level of education. The average GER of all districts/cities in Jambi Province is in the 100% position (Kemdikbud, 2018). This does not indicate good performance because it shows the potential possibility that children who are not yet seven years old have entered the elementary school level (Rahayu et al., 2021). Ideal GER score should be 100% (Kemendikbud, 2021). This is evident from the APM, which has not yet reached 100%. The GER and NER for elementary school level in Jambi City are higher than other areas in Jambi Province, even though the junior high school level is in the lowest position.
The government carries out efforts to improve the quality of education through the allocation of the education budget. The education budget is also a mandatory priority at both the national and regional levels. The amount of budget disbursed is one of the benchmarks for the government's alignment with the community and commitment to the quality of human resources (Rahayu, 2020). The obligation to budget funds for the education sector at least 20% is a mandate from the law. The amount of budget allocated by the government each year for the Education Sector continues to increase. The budget is quite large, as evidenced by the 2018 national education budget allocation reaching 444.1 trillion rupiahs and increasing to 492.5 trillion rupiahs in 2019 (Kemendikbud, 2020). The minimum requirement for an education budget allocation of 20% also applies at the local government level. Local governments that pay attention to the quality of education will allocate education budgets according to or close to the mandate. Jambi Province occupies the 6th position as the region with the highest budget allocation for education affairs nationally. This is evidence that Jambi Province continues to strive to improve the competence of its human resources and is committed to fulfilling the mandate of the 1945 Constitution.
At the district and city levels in Jambi Province, Jambi City has the highest commitment to allocating the education budget. The budget allocation evidence this for the Education Affairs Program from the 2019 Pure APBD, which reached 16.49% (an increase of 1% compared to 2018). The budget allocation for the Education Affairs Program with regional transfers in 2019 reached 29.55% (Kemendikbud, 2020). The Jambi City education budget is still far above the Regency/City in Jambi Province. In addition to these funds, districts and cities in Indonesia also can receive allocations of government aid funds (Bantah). This fund is more focused on physical development. In 2017-2018, the City of Jambi was also the recipient of the highest allocation of rebuttal funds compared to the Regency/City in Jambi Province.
Since the enactment of Law no. 20 of 2003 and the allocation of School Operational Assistance (SOA) funds in 2005, schools are also required to be able to manage funds effectively and efficiently. The SOA funds disbursed starting in 2005 became the main trigger for the implementation of SBM in Indonesia. SBM is the systematic decentralization of school-level authority and responsibility for decisionmaking on matters relating to school operations. The implementation of SBM requires the ability of schools to plan, implement and evaluate, and be accountable for transparent fund management to the community and government (Mulyasa, 2002). Schools have wider financial management autonomy so that Schools today are not only
providers of education. Although relatively new to schools, schools must go through all stages of budgeting in schools. The principal is the manager who is responsible for managing school finances.
Elementary and junior high schools are the holders of the mandate to create a quality generation of the nation. Indonesian education is currently experiencing many problems. Two national figures, Baswedan (2014) and Basri & Putra (2016) stated that education and the quality of Indonesian human resources are in critical and emergency conditions. So it is necessary to make improvements to improve the quality of our education. The quality of education is related to the academic aspect and in terms of financing and financial management. Education is the government's responsibility and the responsibility of all because education is a long-term investment for a country.
Financing has an influence and is interrelated with the quality of education (Saraswati, 2011). Indonesian education continues to be shackled to a low budget (Darmaningtyas & Subkhan, 2012). Saraswati (2011) states that neighboring countries continuously increase their education spending allocations, such as Malaysia reaching 25.2% and Thailand 25%. The Indonesian government has increased the education budget allocation since the enactment of Law no. 20 of 2003. However, the government includes an element of educator salaries in the budget allocation (Saraswati, 2011). The average percentage of primary education spending on GDP in OECD countries is 6.1% on average. Indonesia is one of the countries with an allocation below 4%, only 2.9% (OECD, 2013). Even in 2015, it decreased to 2.5% (OECD, 2018).
Study about financial management in schools has not been widely studied in Indonesia (Rahayu, 2020; Saraswati, 2011). Research in educational institutions so far has mostly looked at academic aspects such as curriculum and learning processes. At the same time, financial management is also an important aspect of achieving quality education. One of the differences with performance research often conducted in government organizations is that the performance measurement used is a comprehensive perspective (financial, internal processes, customers, and learning and growth) and from various perspectives, namely schools, employees, and teachers. This measurement is the model used in the performance of educational services measured by the educational scorecard (Aljardali et al., 2012; Rahayu et al., 2021). This model has not been found by many researchers to be used in Indonesia. The educational scorecard model is a development of the balanced scorecard, which academics and accounting practitioners have often used to assess the performance of both private and government organizations.
Jensen & Meckling (1976) explained agency problems that arise in the company's relationship between agents and principals. Agents are parties who carry out their duties as mandated by the owners of capital. The agent is the company's management. The principal is the party who gives the trust, entrusts the money to be run by the agent. The relationship between government organizations (example: school) and society is similar to relationship between agents and principals (Nor et al., 2019). Problems in the relationship between the two arise because of the information asymmetry between the two parties. Agents have wider access to information on organization activities because they directly manage its operations. Due to opportunistic behavior, agents often take advantage of this access to information to benefit themselves or certain groups. This attitude, of course, can harm the principal.
Schools are the recipients of the mandate to manage public funds to carry out educational activities. Agency theory's point of view is schools as agents while society as principals. Early development of Agency theory by Jensen & Meckling (1976) in private organizations. Problems with the relationship between agents and principals also occur in government agencies. Halim dan Abdullah (2006) state that agency problems in local government are continuous and interrelated at all levels. Schools as trustees schools must manage funds in an accountable and transparent manner. Schools cannot be separated from their environment because schools are influenced and affect their environment. Schools that are given greater autonomy and can work with their stakeholders will be successful (OECD, 2013).
In this agency relationship, it can become a problem if the school management, in this case, is led by the principal, being opportunistic like the company management. Participation and transparency must be increased in school financial management mechanisms. Participation and transparency are consequences of implementing SBM. SBM provides management autonomy to schools from an operational and financial perspective (Mulyasa, 2002). In implementing SBM, cooperation between schools and all stakeholders is needed to determine the programs and activities run by the school.
The achievement of the implementation of programs and activities is a measure of performance. The work of public sector organizations is directly related to providing goods and services to meet the wants and needs of the community. Therefore, participation is needed to support the achievement of the performance of government organizations. Collaboration between the Indonesian government and civil society organizations to generate ideas and actions to encourage the implementation of values in order to create clean, effective, democratic, and reliable governance. Rahayu (2020) proves that principals who are closed and tend not to open up to the involvement of others have lower performance than schools that apply participatory principles. The performance of public organizations must be seen comprehensively in their success in meeting the community's needs. The performance of government organizations can not only be measured from the financial. The non-financial measure is the most important. This relates to the duties and functions of government organizations is to provide quality services to the community.
Kaplan & Norton (1992) introduced the Balanced Scorecard (BSC) concept, which is a comprehensive performance measurement tool for companies. Previously, companies were only measured from financial aspects such as Return on Assets (ROA), Return on Investment (ROI), profit levels, or other economic measures. BSC adds three more perspectives: internal business aspects, learning and growth aspects, and customer aspects. These four perspectives then developed into performance indicators with the BSC concept.
The educational scorecard is a school performance assessment developed from the BSC. The BSC for educational institutions has been developed by Aljardali et al. (2012), which is also known as the Educational scorecard (Griggs et al., 2012). This model is used in Lebanon to measure the performance of the public university. Its development is used in higher education institutions. In this study, researchers tried to use the scorecard for primary education institutions, referring to Rahayu et al. (2021) and Aly & Mansour (2017), and Rompho (2020).
Four Perspectives on the Educational scorecard, namely the customer perspective, try to see how customers, especially parents, assess the performance of
education services in schools. Some of the indicators used are school programs and activities with high scores, parental satisfaction, the number of complaints from parents or the community towards the school, the professionalism of teachers and staff, and the quality of instruction used by the school. Internal Business Perspective looks at how schools develop services, facilities, resources, facilities for students, teachers, and staff, quantity and quality of internal and external coordination meetings attended by schools, and provide customer complaint response services. The Perspective of innovation and learning looks at how schools create and innovate in the learning process. Some things that can be used as indicators are innovation and curriculum changes, the level of innovation made by teachers in learning, motivation, and self-development of staff, and academic activities supporting professionalism followed by staff or teachers. Financial Perspective looks at the effectiveness and efficiency of school financial management. This can be seen from the quality of budget allocations, financial support for academic and extracurricular activities, and policies in budget allocations. A comprehensive evaluation will provide an overview of the organization's performance in real terms so that it is expected to be the basis for making appropriate policies for both schools and local governments. The control environment is support for achieving school performance. Government organizations are required to implement transparency. Some of the benefits for government organizations that implement transparency include increased trust and mutual control with stakeholders to ensure that funds are used for the benefit of the community (Rahayu, 2020). Transparency is the openness of access to information for the public to the required information. Transparency means the accessibility of stakeholders to all management and implementation information from both administrative and management aspects, including finance. Public agencies must be open in conveying various public information (Nor et al., 2019). Transparency for government organizations is a response to regulations. every organization must send information including financial to stakeholders as part of signaling organizational performance (Hadi et al., 2018). Two aspects of the principle of public policy transparency, namely (1) public communication by the government and (2) the public's right to access information (Rahayu, 2020). These two aspects also influence the transparency of public policies. Both will be very difficult to do if the government does not handle its performance properly. Public communication demands government efforts to open and disseminate relevant information and activities. Transparency must be balanced, with the need for institutional confidentiality and information that affects individual privacy rights. Good performance will encourage transparency to customers (Rahayu, 2020). One of the elements of good governance is participation as a determining factor in achieving performance in government. Because, it can improve individual performance, job crafting behaviors and can reduce role conflict and stress (Berdicchia & Masino, 2019). Participation is the involvement of all parties in problemsolving and decision-making (Wagner, 1994). Participation can improve performance (Berdicchia & Masino, 2019) in government organizations and can streamline spending. Wardhani et al. (2017). In addition to improving performance, participation has also been shown to increase employee satisfaction (Wagner, 1994) and reduce conflict (Berdicchia & Masino, 2019). The active participation of parents, teachers, and school employees can increase the achievement of school performance (Rahayu, 2020).
H1: Participation has a Positive Effect on Performance
The control environment is the most important element of the internal control system in government organizations. The control environment forms the basis for the other control components. The control environment creates a conducive organizational structure and environmental conditions that impact other elements of internal control. However, the internal control system is essential for public and private organizations (Ayimpoya et al., 2020). Internal control can improve the performance of higher education institutions in Zanzibar. The element of internal control that can affect performance is the control environment because it has an impact on operations and other system elements (Omar & Yussuf, 2021). Ayimpoya et al. (2020) also proves that the internal control environment can improve organizational performance.
-
H2: Control Environment Positively Affects School Performance
Transparency can be done by the government through the delivery of information to the public. Submission of information through the website is a trend that is widely used by the government today. This is often referred to as the implementation of e-government. The performance of e-government has a significant positive impact on the government (Reddick, 2004). E-government is a form of interaction between the government and stakeholders. E-government is a form of increasing transparency.
Good government financial performance will improve information delivery to the public (Laswad et al., 2005). High performance is a signal of good public management (Christiaens, 1999). Local governments with poor performance will avoid voluntary disclosure (such as voluntary internet-based disclosure) and will prefer to limit access to information for the public (Craven & Marston, 1999). The audit opinion is also often seen as a performance for local governments. Local governments with good audit opinions tend to be more transparent (Nor et al., 2019). Local governments with high public welfare are required to be more transparent for financial and non-financial information (Rahim & Martani, 2016).
-
H3: Performance has a Positive Effect on Transparency
The results of previous studies have proven that participation affects performance (Berdicchia & Masino, 2019; Wagner, 1994; Wardhani et al., 2017), including in educational organizations such as schools (Rahayu, 2020). The effect of performance on transparency has also been proven by (Laswad et al., 2005; Nor et al., 2019). Previous research has positioned performance as the dependent variable of participation and the independent variable to transparency. Therefore, this study uses performance as a mediating variable for the effect of participation on transparency. H4: Performance Can Mediate the Effect of Participation on Transparency
Implementation of the internal control environment is the responsibility of management, but the role of internal parties also determines its implementation (Rahayu et al., 2021). A good control environment will improve performance (Ayimpoya et al., 2020; Omar & Yussuf, 2021). Implementing the government's internal control system, including the control environment, has a positive influence on increasing transparency (Listari et al., 2018). The performance also positively influences transparency (Craven & Marston, 1999; Rahim & Martani, 2016). Previous research has proven that performance is the dependent variable of the control environment and the independent variable in relation to transparency. Therefore,
H 5: Performance Can Mediate the Effect of Control Environment on Transparency
Research Method
The respondents of this study were principals, teachers, and employees of public elementary schools in Jambi City. Jambi City was chosen because it is one of the regional governments with the highest education budgets in Jambi Province. The total population of this study was 3,220 people. The researcher used Yamane's formula to determine the minimum sample size. The precision used in this study is 5%, so the minimum sample calculated is 355.80, then it is fulfilled to be 356 people. This sample size will be allocated proportionally based on the number of schools and teachers, staff, and principals for six school areas in Jambi City.
The type of data used in this study is primary data collected by the survey questionnaire method. This study used a survey design with closed questionnaires. The questionnaire used a semantic differential with seven alternatives: starting from very dissatisfied (1) until very satisfied (7). Researchers distributed 356 questionnaires. The number of returned questionnaires was 324, but there were 22 questionnaires that could not be processed. So that only 320 questionnaires can be processed further in this study. Based on the questionnaires that have been collected by the research team, it can be seen that the number of questionnaires that can be further processed in this study is 320 questionnaires. This response rate is relatively high.
The research team collected data by coming to school. However, due to the conditions during the Covid 19 pandemic and Jambi City being at level 3 and Level 4 during the research data collection period, the research team also used the data collection method using the google form. The Research Team also collaborates with the school operator team which is divided into coordinators for each region/district. The google form link is sent through the sub-district group and what apps group for each school.
The variable in this study is the performance of school education services using the concept of a special Balanced scorecard for educational institutions used by Aljardali et al. (2012), which is also called the Educational scorecard (Griggs et al., 2012; Rahayu et al., 2021). The educational scorecard is the development of the four perspectives of the balanced scorecard from Kaplan & Norton (1992). The four perspectives are financial Perspective, customer perspective, internal business process perspective, innovation, and learning process. Researchers used eighteen indicators of school performance measurement. The Transparency Participation variable is a development of the characteristics of good governance of government organizations according to the State Administration Agency (LAN) and Lembaga Administrasi Negara (2000), which researchers for schools adjust. The participation variable uses five measurement indicators, while the Transparency variable uses four measurement indicators. The four indicators for the internal control environment variables refer to government regulations No. 60 of 2008 and refer to Rahayu et al. (2021).
The research data will be tested with Structural Equation Modeling (SEM)-PLS using the SEM-PLS 3.0 application. Consequently, the researcher will assess the outer model and inner model. Convergent validity test based on loading factor (correlation between item score/component score with construct score) indicators that measure the construct. The rule of thumb used for convergent validity is outer loading > 0.7, communality > 0.5 and average variance extracted (AVE) > 0.5 (Hair et al., 2019). Reliability test using Cronbach alpha and composite reliability. The rule of thumb is that the value of alpha or composite reliability must be greater than 0.7. In practice, the
value of 0.6 is still acceptable. Hypothesis testing was obtained from the bootstrapping results with a significance threshold of 0.05.
Result and Discussion
The number of questionnaires that can be further processed in this study was 302 questionnaires. The response rate of the respondents for this study was 84.83%. This response rate is relatively high. The research team collected data by coming to school. The team has obtained permission and recommendations to research the Jambi City Education Office. However, due to the conditions during the Covid 19 pandemic and Jambi City being at level 3 and Level 4 during the research data collection period, the research team also used the Google form's data collection method. The research team collaborates with the school operator team, divided into coordinators for each region/district. The google form link is sent through the sub-district group and what apps group for each school.
This research was conducted in eleven sub-districts in Jambi City with a different number of schools. The most number of questionnaires that were distributed and returned to be processed were from South Jambi District, 60 questionnaires followed by the District of East Jambi as many as 53 questionnaires. The least questionnaires collected came from the Pelawangan District with six questionnaires and Lake Sipin with nine questionnaires. This difference occurred because the number of questionnaires distributed per sub-district was different. The number of schools in the sub-district also Table 1. Outer Loading Test Results
Indicators Control Env Participation Performance Transparency
|
CE1 |
0.887 |
|
CE2 |
0.905 |
|
CE3 |
0.862 |
|
CE4 |
0.786 |
|
P1 |
0.835 |
|
P2 |
0.894 |
|
P3 |
0.870 |
|
P4 |
0.831 |
|
P5 |
0.862 |
|
SP_1 |
0.820 |
|
SP-2 |
0.813 |
|
SP-3 |
0.856 |
|
SP_4 |
0.877 |
|
SP-5 |
0.870 |
|
SP-6 |
0.840 |
|
SP-7 |
0.795 |
|
T1 |
0.874 |
|
T2 |
0.910 |
|
T3 |
0.914 |
|
T4 |
0.897 |
Table 2. Average Variance Extracted Test Results
|
Variable |
AVE . value |
|
Control Env |
0.742 |
|
Participation |
0.737 |
|
Performance |
0.705 |
|
Transparency |
0.808 |
Source : Processed Data, 2021
varies. The districts of Jambi Selatan, Jambi Timur, and Telanaipura are included in the large population in Jambi City, and the number of schools is also categorized as large.
The research team also distributed a different number of questionnaires to groups of respondents for each sub-district. The amount is determined based on the proportional number of each group in the sub-district. Three groups of respondents in the school consist of the Principal, Teachers, and Employees. Most of the respondents came from the teacher group, as many as 72.52 percent or 219 teachers. Then followed by the employee group as many as 63 people or 20.86 people and finally from the main group as many as 20 people or 6.62 percent.
The dominant age of the respondents was in the age group of 26-35 years, as many as 92 people or 30.55%. The dominant respondents are women, namely 79.10%. This is following the current condition of the education world, which shows that the profession of teachers and employees in schools and principals is mostly carried out by women. Most of the respondents in this study were in the group of more than 15 years. This can be used as one of the benchmarks to show the respondent's work experience. The number of respondents with more than 15 years of service was 123 people or 40.7%.
The results of the convergent validity test are carried out using outer loading. The threshold used is 0.7, meaning that the indicator is considered valid if a factor loading value is above 0.7. The results of the outer loading test are presented in Table 1.
Based on Table 1., it can be seen that all indicators have been declared valid because they already have an outer loading value of more than 0.7. The research team tested convergent validity by measuring the Average Variance Extracted (AVE) value. The AVE value of all variables has an AVE value of more than 0.5. The Average Variance Extracted (AVE) value is presented in Table 2. Convergent validity is also measured using the AVE value, which must be more than 0.5. AVE values for all variables in Table 2. more than 0.5.
The research team then tested discriminant validity using Fornell-Larcker. The Fornell-Larcker Criterion value requires that the correlation value of the research variable being tested with the research variable itself be greater than the correlation between the research variable being tested and other research variables. Researchers
Table 3. Fornell-Larcker Criterion Results
|
Control Env. |
Participation |
Performance |
Transparency | |
|
Control Env. |
0.816 | |||
|
Participation |
0.744 |
0.859 | ||
|
Performance |
0.792 |
0.801 |
0.839 | |
|
Transparency |
0.671 |
0.799 |
0.736 |
0.899 |
Source : Processed Data, 2021
Table 4. Results of Heterotrait-Monotrait Ratio (HTMT)
|
Variable |
Control Env |
Participation |
Performance Transparency |
|
Control Env. Participation |
0.818 | ||
|
Performance |
0.871 |
0.859 | |
|
Transparency |
0.740 |
0.868 |
0.786 |
|
Source : Processed Data, 2021 | |||
conducted four stages of discriminant validity testing with the Fornell-Larcker Criterion.
The results of the first Fornell-Larcker Criterion test can be seen in Table 3
Based on Table 3., it can be seen that the correlation value of all variables with the variable itself is higher than the correlation value of the variable with other variables. This shows that the discriminant validity with Fornell's lacker criterion has been met. Another test to assess discriminant validity is the Heterotrait-Monotrait Ratio (HTMT) presented in Table 4
All HTMT values less than 0.9 mean that they have met the criteria for discriminant validity. The next researcher is to evaluate the correlation between indicators through cross-loading testing. The test results can be seen in Table 5. The value of all indicators from the cross-loading test has met the requirements. Testing the reliability of the data is indicated by the Cronbach Alpha and Composite Reliability values that have also met
Table 5. Cross Loading Results
Indicator Control Env Participation Performance Transparency
|
CE1 |
0.887 |
0.649 |
0.694 |
0.622 |
|
CE2 |
0.905 |
0.681 |
0.730 |
0.678 |
|
CE3 |
0.862 |
0.672 |
0.703 |
0.510 |
|
CE4 |
0.786 |
0.554 |
0.592 |
0.490 |
|
P1 |
0.677 |
0.835 |
0.697 |
0.601 |
|
P2 |
0.638 |
0.894 |
0.655 |
0.676 |
|
P3 |
0.612 |
0.870 |
0.684 |
0.661 |
|
P4 |
0.502 |
0.831 |
0.570 |
0.685 |
|
P5 |
0.731 |
0.862 |
0.795 |
0.791 |
|
SP_1 |
0.637 |
0.674 |
0.820 |
0.678 |
|
SP_2 |
0.674 |
0.699 |
0.813 |
0.768 |
|
SP_3 |
0.658 |
0.662 |
0.856 |
0.569 |
|
SP_4 |
0.681 |
0.673 |
0.877 |
0.538 |
|
SP_5 |
0.667 |
0.670 |
0.870 |
0.518 |
|
SP_6 |
0.715 |
0.673 |
0.840 |
0.564 |
|
SP_7 |
0.614 |
0.641 |
0.795 |
0.648 |
|
T1 |
0.645 |
0.698 |
0.685 |
0.874 |
|
T2 |
0.594 |
0.704 |
0.660 |
0.910 |
|
T3 |
0.596 |
0.756 |
0.682 |
0.914 |
|
T4 |
0.573 |
0.711 |
0.613 |
0.897 |
Source : Processed Data, 2021
Table 6. Croanbach Alpha & Composite Reliability Nilai
|
Variable |
Cronbach 's Alpha |
rho_A |
Composite Reliability |
|
Control Env |
0.883 |
0.890 |
0.920 |
|
Participation |
0.911 |
0.918 |
0.933 |
|
Performance |
0.930 |
0.931 |
0.943 |
|
Transparency |
0.921 |
0.922 |
0.944 |
Source : Processed Data, 2021
the requirements above 0.7. These are presented in Table 6. The measurement model is presented in Figure 1.
After all testing the validity and reliability have been completed, the researcher proceeds to the stage of testing the hypothesis. The results of testing the research hypothesis can be seen in Table 7. Based on Table 7., the results of the direct effect test show that hypothesis 1, hypothesis 2, and hypothesis 3 are acceptable. Indirect influence through performance as a mediating variable (hypothesis 4 and hypothesis 5) is also accepted.
Predictive relevance is a test performed to show how good the observed value is by using the blindfolding procedure by looking at the value of Q2. If the value of Q2> 0, then it can be said to have a good observation value, but if the value of Q2< 0, it can be stated that the observed value is not good. Q2 predictive relevance for structural models, measuring how well conservation values are generated by the model and also the estimated parameters. Q2 value > 0 indicates the model has predictive relevance; conversely, if the value of Q2 0 suggests that the model lacks predictive relevance. The Q2 value from the results of this study is presented in Table 8.
This value reflects the model in this study has a relevant predictive value, where the model used can explain the information contained in the research data. The R2 value from the results of this study is presented in Table 8. Furthermore, the NFI value is
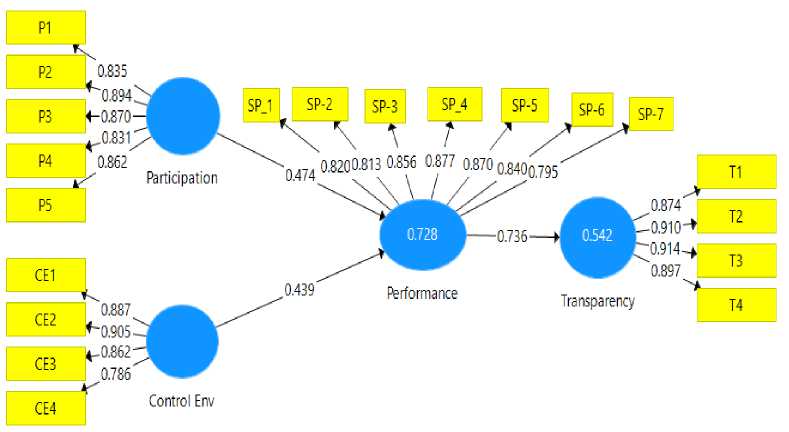
Figure 1. Measurement model
Rahayu, Yudi , Rahayu & Jumaili
How Performance Mediate the Effects of Participation and Control Environment on Transparency
Table 7. Hypothesis Testing Results
|
Hypothesis |
Original Sample (O) |
Sample Mean (M) |
Standard Deviation (STDEV) |
T Statistics (|O/STDEV|) |
P Values |
Sign |
|
Participation -> Performance |
0.736 |
0.739 |
0.044 |
16.751 |
0.000 |
Yes |
|
Control Env->Performance Performance -> |
0.474 |
0.474 |
0.048 |
9.792 |
0.000 |
Yes |
|
Transparency Participation -> |
0.439 |
0.440 |
0.048 |
9.135 |
0.000 |
Yes |
|
Performance -> Transparency |
0.349 |
0.351 |
0.046 |
7.589 |
0.000 | |
|
Control Env_ -> Performance -> Transparency |
0.323 |
0.325 |
0.041 |
7.854 |
0.000 |
Yes |
Source : Processed Data, 2021
0,802. This research model is declared fit because the SRMR or Standardized Root Mean Square value is 0.072 smaller/<0.10 or <0.08, and the NFI value is 0.802. The resulting model is at the level of 77.40% fit.
Testing the hypothesis 1 shows a coefficient value of 0.736 with a p-value of 0.000 less than 0.05. This means that the hypothesis is proven, meaning that participation can affect school performance. Increased participation will be able to improve school performance positively. The results of this study are in line with Rahayu (2020), proving that schools with good stakeholder participation have good school performance as well. Vice versa, schools that do not involve teachers, employees, and parents in their financial management, have poor performance. Participation is proven to improve the performance of both individual and organizational performance (Duncan et al., 2012; Berdicchia & Masino, 2019). In addition, participation can also reduce role conflict in the organization (Berdicchia & Masino, 2019). Wagner (1994) also proves that participation will be able to increase performance and satisfaction. Although, Jatmiko & Lestiawan (2016) and Karsam (2015) found that participation has not been able to improve performance.
The most expected stakeholder participation is the parents of students. The contribution of parents can be in the form of involvement in school activities. In financial management, parents are expected to be actively involved in the planning process through meetings to formulate school programs and activities. Parents can propose activities for the school budget to allocate. It is also known whether the available or unfunded school activity plans are available in the planning process. Parents can
|
Table 8. Q2 Value and R Square Q² (=1-SSE/SSO) R Square R Square Adjusted | |
|
Control Env |
0.556 |
|
Participation Performance |
0.598 0.599 0.728 0.726 |
|
Transparency |
0.659 0.542 0.540 |
Source : Processed Data, 2021
contribute together to finance activities needed by the school but cannot be financed in the relevant year. One example is the farewell activity of students who have completed their studies. In the implementation process, parents can be actively involved in the process of implementing school activities. Forms of involvement include being on a committee and participating in school activities. In addition, parents can also monitor the implementation of the school budget.
Testing the hypothesis 2 shows a coefficient value of 0.474 with a p-value of 0.000 less than 0.05. This means that the hypothesis is proven, meaning that the controlled environment can positively affect school performance. The better the internal control environment, the higher the school's performance. The internal control environment indicators include a commitment to the quality of human resources, placement and assignment under their competencies, a clear division of duties and responsibilities, and commitment to ethical enforcement. A good control environment can certainly be a driving force for school performance to increase. Principals who have integrity will be more appreciated by parents, stakeholders, and authorized officials. Integrity simply shows the compatibility between actions and words. Principals with a character of integrity will also gain trust and must commit to achieve school performance. School performance is not only academic but also non-academic.
Commitment and clear division of authority from control environment indicators will be able to support increased transparency. Principals who are committed to providing opportunities for all stakeholders to participate actively will certainly increase transparency. This, of course, will be inversely proportional, with the principal closing himself off to involve other parties in the management of school finances. A clear division of duties between the principal's role as manager, school treasurer, and the recording and reporting department will also increase school accountability. Schools will process school financial reports faster with a good distribution of authority. This, of course, will also improve the school's internal control. One of the causes of frequent delays in financial reporting is that the functions are carried out by one person, so there is no mutual control between the implemented functions. Transparency in school financial management also requires the principal's commitment to be brave and open to stakeholders. The results of this study are in line with Ayimpoya et al. (2020) and Omar & Yussuf (2021). The control environment has an important role in improving performance. The active role of internal auditors is very important to support a good control environment (Laela, 2016).
Testing the hypothesis 3 shows a coefficient value of 0.439 with a p-value of 0.000 less than 0.05. This means that the hypothesis is proven, meaning that performance is able to affect school transparency positively. The higher the performance, the school's transparency will also increase. The results of this study are in line with (Christiaens, 1999; Laswad et al., 2005; Nor et al., 2019), which also proves that performance affects transparency.
Technical guidelines for managing school finances contained in the Minister of Education and Culture Regulation regulate the form of transparency of school funds. Schools are required to be transparent in managing school operational funds and other funds. The use of funds must be under the school's financial budget plan. The form of transparency, especially school finances, is conveyed through meetings with parents, announcements on school bulletin boards, or in writing. Up-to-date information about the implementation of school programs and activities and the position (source and use)
of school funds will increase parents' trust. Parents will finally support school activities well, so they will actively participate in achieving school performance. Otherwise, if there is no disclosure of information will have an impact on distrust and indifference of parents to school activities. Parents feel they are not involved, so they don't need to be too active. This, of course, will have an impact on the relationship between the school and parents.
Based on testing the hypothesis 4, the coefficient value is 0.349 with a p-value of 0.000, which is smaller than 0.05. This means that the hypothesis is proven, meaning that school performance can mediate the effect of participation on school performance. Direct participation can also affect school transparency. Therefore, school performance becomes a mediator in the form of partial mediation.
The results of this study reflect that performance can be an intervening variable of participation in school transparency. Schools do require the participation of all school stakeholders, both internal and external. The internal parties of the school include teachers and school staff. At the same time, external parties can be parents, committees, parties from the Education Office and the community, and other stakeholders. The school's financial budget plan is not prepared independently by the principal but involves teachers, employees, and other stakeholders. Rahayu (2020) found that stakeholders can participate in the planning, implementation and supervision stages of school activities. Contribution of thoughts and suggestions for school activities at the planning stage. At the implementation stage, helping schools organize activities. Participation in the supervision stage can be in the form of ensuring that the activities carried out by the school remain according to the mutually agreed plan. This participation can encourage commitment to achieve good school performance as well.
Based on testing the hypothesis 5, the coefficient value is 0.330 with a p-value of 0.000, smaller than 0.05. This means that the hypothesis is proven, meaning that performance can become a mediator for the influence of the control environment on school transparency. The mediating role of school performance in this relationship is partial mediation. A good control environment will support performance which will ultimately increase school transparency. Good internal control will be reflected in a good internal control environment so as to create a safe, orderly, and conducive working atmosphere for employees and teachers as well as a comfortable environment for students to go to school. A comfortable work environment will provide opportunities for employees to increase creativity and not experience stress. This will have an impact on individual performance (Omar & Yussuf, 2021). The indicator that has the highest influence on the control environment is the commitment of the school principal/leader to enforce discipline and deviation. The principal's commitment is to determine the school can achieve good performance and finally dare to be transparent. The principal is the manager, the determinant of the direction of school policies and activities (Rahayu, 2020).
Conclusion
This study proves that participation affects school performance. This means that the higher the level of participation, the higher the school's performance. The internal control environment affects school performance. A good internal environment will be able to encourage the improvement of school performance. Performance affects school transparency. Schools with good performance tend to increase transparency to
stakeholders. School performance has also been shown to be a mediator for the influence of the control environment on transparency. In addition, school performance has also been shown to mediate the effect of participation on school transparency.
The limitations of this study include that data collection is only done predominantly using a questionnaire via a google form link. Researchers cannot conduct direct interviews with respondents because the research was conducted during the Covid 19 pandemic. Reinforcement of information that can be obtained through interviews cannot be obtained through closed questionnaires. This study also only uses one element of the internal control system, namely the control environment. Although the control environment is the most important element in the internal control system, it is still not able to reflect all other elements of internal control. The implications of this research for schools must open space for stakeholders to participate. The condition of the control environment must also continue to be improved because it can improve school performance. A conducive schoolwork environment will also provide comfort for students. Local governments must pay attention to school performance comprehensively (financial and non-financial). Further researchers can develop this research by adding other elements of internal control, namely risk assessment, information and communication systems, control, and monitoring activities as additional variables. One of the theoretical implications of this research is the concept and indicators of school performance measurement that combines financial and nonfinancial. The results of this study prove that the balanced scorecard can also be used in public school organizations. The research model generated from this study is also a separate finding. This model can be developed further in further research.
References
Aljardali, H., Kaderi, M., & Levy-Tadjine, T. (2012). The Implementation of the Balanced Scorecard in Lebanese Public Higher Education Institutions. Procedia - Social and Behavioral Sciences, 62, 98–108. https://doi.org/10.1016/j.sbspro.2012.09.018
Aly, A. H., & Mansour, M. E. (2017). Evaluating the sustainable performance of corporate boards: the balanced scorecard approach. Managerial Auditing Journal, 32(2), 167–195. https://doi.org/10.1108/MAJ-04-2016-1358
Ayimpoya, R. N., Akolgo, D. A., Mbilla, S. A. E., & Gbegble, M. K. (2020). Effects of Risk Assessment, Control Environment and Control Activities on Performance of Listed Banks in Ghana. Asian Journal of Economics, Business and Accounting, 18–33. https://doi.org/10.9734/ajeba/2020/v14i430200
Basri, F., & Putra, G. A. (2016). Escaping the Middle Income Trap in Indonesia. An Analysis of Risks, Remedies and National Characteristics. Friedrich Ebert Stiftung. http://library.fes.de/pdf-files/bueros/indonesien/12509.pdf
Baswedan, A. (2014). Gawat Darurat Pendidikan Indonesia.
http://kemdikbud.go.id/kemdikbud/node/3552
Berdicchia, D., & Masino, G. (2019). The Ambivalent Effects of Participation on Performance and Job Stressors: The Role of Job Crafting and Autonomy. Human Performance, 32(5), 220–241. https://doi.org/10.1080/08959285.2019.1669038 Christiaens, J. (1999). Financial Accounting Reform in Flemish Municipalities: An
Empirical Investigation. Financial Accountability and Management, 15(1), 21–40. https://doi.org/10.1111/1468-0408.00072
Craven, B. M., & Marston, C. L. (1999). Financial reporting on the Internet by leading UK
companies. European Accounting Review, 8(2), 321–333. https://doi.org/10.1080/096381899336069
Darmaningtyas, & Subkhan, E. (2012). Manipulasi Kebijakan Pendidikan. Resist Book.
Duncan, K., Kenworthy, A., & McNamara, R. (2012). The Effect of Synchronous and Asynchronous Participation on Students’ Performance in Online Accounting Courses. Accounting Education, 21(4), 431–449.
https://doi.org/10.1080/09639284.2012.673387
Griggs, V., Blackburn, M., & Smith, J. (2012). The educational scorecard: The Start of our Journey. Electronic Journal of Business Research Methods.
https://eprints.leedsbeckett.ac.uk/id/eprint/532/
Hadi, A., Handajani, L., & Ardana, I. N. N. (2018). Financial disclosure based on Web-ICT determinants: Its implications for local government financial performance in Indonesia. International Research Journal of Management, IT & Social Sciences, 5(1), 72–85. https://sloap.org/journals/index.php/irjmis/article/view/32
Hair, J. F., Risher, J. J., Sarstedt, M., & Ringle, C. M. (2019). When to use and how to report the results of PLS-SEM. European Business Review, 31(1), 2–24. https://doi.org/10.1108/EBR-11-2018-0203
Halim dan Abdullah. (2006). Hubungan Dan Masalah Keagenan Di Pemerintah Daerah: Sebuah Peluang Penelitian Anggaran dan Akuntansi. Jurnal Akuntansi Pemerintahan, 2. https://www.researchgate.net/profile/Syukriy-Abdullah-2/publication/273257684_Hubungan_dan_Masalah_Keagenan_di_Pemerintahan_ Daerah/links/54fc74690cf270426d10296a/Hubungan-dan-Masalah-Keagenan-di-Pemerintahan-Daerah.pdf
Undang-Undang No. 20 Tahun 2003 Tentang Pendidikan Nasional, (2003).
Jatmiko, B., & Lestiawan, H. Y. (2016). Good governance government andthe effect on local governmentperformance (Survey on gunung kidul district government of Indonesia). International Journal of Applied Business and Economic Research, 14(14), 981–997.
http://repository.umy.ac.id/bitstream/handle/123456789/14442/JURNAL 2.pdf?sequence=1
Jensen, M. C., & Meckling, W. H. (1976). Theory of the firm: Managerial behavior, agency costs and ownership structure. Journal of Financial Economics, 3(4), 305– 360. https://doi.org/10.1016/0304-405X(76)90026-X
Kaplan, R. S., & Norton, D. P. (1992). The balanced scorecard--measures that drive performance. Harvard Business Review, 70(1), 71–79.
http://www.ncbi.nlm.nih.gov/pubmed/10119714
Karsam, K. (2015). Pengaruh Penekanan Anggaran dan Motivasi Terhadap Hubungan Antara Partisipasi Anggaran Dengan Senjangan Anggaran Serta Dampaknya Pada Kinerja Manajerial (Studi Pada Yayasan Pendidikan dan Koperasi Propinsi Banten). Jurnal Dinamika Akuntansi Dan Bisnis, 2(1), 29–44.
https://doi.org/10.24815/jdab.v2i1.3604
Kasali, R. (2014). Let’s Change: Kepemimpinan, Keberanian dan Perubahan. Kompas. Kemdikbud. (2018). Neraca Pendidikan Daerah 2018. http//.npd.kemdikbud.go.id, Kemendikbud. (2020). Neraca Pendidikan Daerah 2019. http//.npd.kemdikbud.go.id Kemendikbud. (2021). APK/APM PAUD, SD, SMP & SM Tahun 2020/2021 (Termasuk
Madrasah dan Sederajat), Pusat Data dan Teknologi Informasi.
http://publikasi.data.kemdikbud.go.id
Laela, S. F. (2016). Peran Auditor Internal dalam Meningkatkan Value Perusahaan dan Tantangannya Di Masa Depan: Suatu Tinjauan Teoritis. Jurnal Dinamika Akuntansi Dan Bisnis, 3(2), 77–88. https://doi.org/10.24815/jdab.v3i2.5388
Laswad, F., Fisher, R., & Oyelere, P. (2005). Determinants of voluntary Internet financial reporting by local government authorities. Journal of Accounting and Public Policy, 24(2), 101–121. https://doi.org/10.1016/j.jaccpubpol.2004.12.006
Lembaga Administrasi Negara. (2000). Akuntabilitas dan Good Governance. Modul Sosialisasi Sistem Akuntabilitas Kinerja Instansi Pemerintah (AKIP), 2. https://doi.org/10.4135/9781446214817.n18
Listari, S., Hermanto, & Martiningsih, S. P. (2018). The Influence of The Goverment Internal Control System, Goverment Accounting Standards, Role of Internal Auditors And The Completion of The Audit Findings To Good Goverment Governance (Emprical Study on Inspectorate And Badan Pemeriksa Keuangan (Bpk) In W. IOSR Journal of Business and Management (IOSR-JBM), 20(2), 66–79. https://doi.org/10.9790/487X-2002026679
Mulyasa, E. (2002). Manajemen Berbasis Sekolah: Konsep, Strategi dan Implementasi. PT. Remaja Rosdakarya.
Nor, W., Hudaya, M., & Novriyandana, R. (2019). Financial statements disclosure on Indonesian local government websites. Asian Journal of Accounting Research, 4(1), 112–128. https://doi.org/10.1108/AJAR-06-2019-0043
OECD. (2013). What Makes schools successful? Resources, Policies and Practices – Volume IV. School Governance, Assessments and Accountability. https://www.oecd.org/pisa/keyfindings/Vol4 Ch4.pdf
OECD. (2018). Ikhtisar Survei Ekonomi OECD Indonesia Tahun 2018.
http://www.oecd.org/eco/surveys/Indonesia-2018-OECD-economic-survey-overview-Bahasa.pdf. Diakses pada tanggal 3 Februari 2019
Omar, F. S., & Yussuf, S. (2021). Effect of Control Environment on the Financial Performance of Higher Learning Public Institutions in Zanzibar. International Journal of Scientific and Technical Research in Engineering (IJSTRE), 6(3). http://www.ijstre.com/Publish/6302021/754235568.pdf
Rahayu, S. (2020). Penganggaran dana bantuan operasional sekolah : perspektif new institutional sociology. In A. Kamayanti (Ed.), Penganggaran dana bantuan operasional sekolah : perspektif new institutional sociology. Penerbit Peneleh. https://doi.org/10.52893/peneleh.2020.17.sr
Rahayu, S., Yudi, & Rahayu. (2021). Educational Scorecard Indicator for Basic Education Institutions. Nusantara Journal of Social Sciences and Humanities, 1(1), 116–125. https://lekantara.com/journal/index.php/njsh/article/view/15
Rahim, W. M., & Martani, D. (2016). Analisis Pengaruh Tingkat Akses Internet, Kompetisi Politik, Opini Audit, Karakteristik Pemda, Dan Karakteristik Demografi Terhadap Pengungkapan Informasi Keuangan Dan Non-Keuangan Website Pemerintah Daerah.
Reddick, C. G. (2004). A two-stage model of e-government growth: Theories and empirical evidence for U.S. cities. Government Information Quarterly, 21(1), 51–64. https://doi.org/10.1016/j.giq.2003.11.004
Rompho, N. (2020). The balanced scorecard for school management: case study of Thai public schools. Measuring Business Excellence, 24(3), 285–300. https://doi.org/10.1108/MBE-02-2019-0012
Saraswati, E. (2011). Dampak Efisiensi Belanja Publik Pendidikan terhadap Kesejahteraan (Welfare). Universitas Indonesia, Jakarta.
Wagner, J. A. (1994). Participation’s Effects On Performance and Satisfaction: A Reconsideration Of Research Evidence. Academy of Management Review, 19(2), 312–330. https://doi.org/10.5465/amr.1994.9410210753
Wardhani, R., Rossieta, H., & Martani, D. (2017). Good governance and the impact of government spending on performance of local government in Indonesia. International Journal of Public Sector Performance Management, 3(1), 77. https://doi.org/10.1504/IJPSPM.2017.082503
Jurnal Ilmiah Akuntansi dan Bisnis, 2022 | 83
Discussion and feedback