The Effect Of Greenhouse Gas Emissions Disclosure And Environmental Performance On Firm Value: Indonesia Evidence
on
106 Jurnal Ilmiah Akuntansi dan Bisnis, Vol. 14, No. 1, Januari 2019, hal 106-119
The Effect of Greenhouse Gas Emissions Disclosure and Environmental Performance on Firm Value: Indonesia Evidence
Gabrielle 1
Agus Arianto Toly 2
1,2Faculty of Economic and Business, Petra Christian University, Indonesia email: angelagabrielle9@gmail.com
DOI: https://doi.org/10.24843/JIAB.2019.v14.i01.p10
ABSTRACT
Jurnal Ilmiah Akuntansi dan Bisnis
(JIAB)
https://ojs.unud.ac.id/index.php/jiab/ user/profile
Volume 14
Nomor 1
Januari 2019
Halaman 106-119
p-ISSN 2302-514X e-ISSN 2303-1018
INFORMASI ARTIKEL
This study aimed to investigates the effect of greenhouse gas emissions disclosure and environmental performance on firm value. The samples were companies participating in the Performance Rating Assessment Programme on Environment Management (PROPER/Program Penilaian Peringkat Kinerja Perusahaan) of the Ministry of Environment Republic of Indonesia that are listed in the Indonesia Stock Exchange (BEI) 2014-2017 period. The data used were secondary data from annual reports and/or sustainability reports. This study uses moderated regression analysis with panel data processed by using EViews. The results of this research found that greenhouse gas emissions disclosure and environmental performance have a positive effect on firm value. Environmental performance can moderate the relationship between greenhouse gas emissions disclosure and firm value. Debt to equity ratio and net operating income as control variables have a positive effect on firm value, but firm size has a negative effect on firm value.
Keywords: Carbon disclosure; greenhouse gas emissions; environmental performance; firm value
Pengaruh Pengungkapan Emisi Gas Rumah Kaca dan Kinerja Lingkungan Terhadap Nilai Perusahaan di Indonesia
ABSTRAK
Tanggal masuk: 16 Nopember 2018 Tanggal revisi:
17 Desember 2018 Tanggal diterima: 02 Januari 2019
Penelitian bertujuan menginvestigasi pengaruh pengungkapan emisi gas rumah kaca dan kinerja lingkungan terhadap nilai perusahaan serta peran kinerja lingkungan dalam memoderasi hubungan antara pengungkapan emisi gas rumah kaca dan nilai perusahaan. Sampel penelitian adalah perusahaan yang berpartisipasi dalam PROPER (Program Penilaian Peringkat Kinerja Perusahaan dalam pengelolaan lingkungan hidup) oleh Kementerian Lingkungan Hidup Republik Indonesia yang terdaftar di Bursa Efek Indonesia (BEI) tahun 20142017. Data yang digunakan adalah data sekunder berasal dari laporan tahunan dan/atau laporan keberlanjutan. Penelitian menggunakan analisis regresi moderasian dengan pengolahan data panel menggunakan EViews. Hasil penelitian menemukan bahwa pengungkapan emisi gas rumah kaca dan kinerja lingkungan berpengaruh positif terhadap nilai perusahaan. Kinerja lingkungan dapat memoderasi hubungan antara pengungkapan emisi gas rumah kaca dan nilai perusahaan. Variabel kontrol debt to equity (DER) ratio dan net operating income berpengaruh positif terhadap nilai perusahaan, namun ukuran perusahaan berpengaruh negatif terhadap nilai perusahaan.
Kata kunci: Pengungkapan karbon; emisi gas rumah kaca; kinerja lingkungan; nilai perusahaan
INTRODUCTION
The phenomenon of global warming caused by uncontrolled accumulation of greenhouse gas (GHG) emissions into the atmosphere has a potentially damaging and irreversible impact. An international body for climate change assessment, Intergovernmental Panel on Climate Change (2014), concluded that human activity is a major cause of increasing global average temperatures and immediate action to reduce global warming into tolerable limit is needed, but this goal will only be achieved by significantly reducing GHG emissions. It also cannot be denied that the increase in global average temperature has been started since the industrial revolution in 1750. This industrial growth is positively related to the amount of GHG emissions produced by companies throughout the world, including Indonesia. The following picture shows an increase in GHG emissions in Indonesia since 1885.
Figure 1 shows that the amount of GHG emissions in Indonesia is significantly increased throughout the year, the highest in 2008, which was 110.725 thousand metric tons of carbon. In 1997, more than 160 countries including Indonesia adopted the Kyoto Protocol, an international agreement aimed at reducing six GHG emissions. The six GHG emissions are carbon dioxide (CO2), methane (CH4), dinitrooxide (N2O), sulfurheksafluoride (SF6),
chlorofluorocarbons (CFC) and perfluorocarbons (PFC). The Kyoto Protocol does not require developing countries like Indonesia to reduce GHG emissions but may do so voluntarily, and are asked to carry out cleaner and more climate-friendly sustainable development. Indonesia ratified the Kyoto Protocol through Law Number 17 Year 2004. Since then various policies and regulations have emerged as a follow up to efforts to reduce GHG emissions, including Presidential Regulation Number 61 Year 2011 concerning National Action Plans for Reducing Greenhouse Gas Emissions and Presidential Regulations Number 71 Year 2011 concerning the Implementation of the National Greenhouse Gas Inventory. Greater world awareness of the threat of GHG emissions then produce the Paris Agreement at the 21st COP in Paris in 2015. The main objective of the Paris Agreement is to keep the global temperature rise of the century below 2 degrees Celsius and to encourage efforts to limit further temperature increases to 1.5 degrees Celsius above the pre-industrial level. Indonesia ratified the Paris Agreement through Law Number 16 Year 2016. President Joko Widodo also conveyed Indonesia’s commitment at 21st COP in Paris to reduce GHG emissions by 29percent in 2030 with its own efforts or by 41percent with international support.
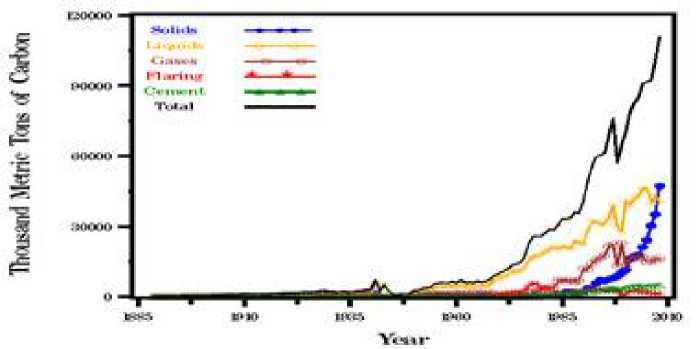
Picture 1. Greenhouse Gas Emissions in Indonesia
Source: Carbon Dioxide Information Analysis Center, 2011
Article 4 of the Presidential Regulation Number 61 Year 2011 stated that business actors are also involved in planning and implementing GHG emissions reductions. Dunlaap & Saarce (1991) states that the public views business activities and firms as the biggest contributors to the current
environmental problems, and thus public demands these firms to disclose information about the impact of their activities to the environment.
Abdel-Rahim (2010) claimed that disclosures through annual reports are the most preferred media because they are considered the most effective and
credible, and these disclosures are expected to lead firms to more environmentally responsible decision making (Choi, Lee and Psaros 2013). Article 66 paragraph (2) point (c) of Law Number 1 Year 1995 concerning Limited Liability Companies stated that firms are required to submit reports on the implementation of social and environmental responsibility in annual reports. In addition, the Statement of Financial Accounting Standards Number 1 stated that firms, apart from financial statements, can submit reports related to the environment, especially for industries that are closely related to environmental factors. The importance of the issue of reducing GHG emissions also causes high demands from investors so that firms provide information on the GHG emissions it produces because this information is valuable for evaluating firms risks (Jaggi, et al. 2018). In line with the theoretical framework by Lambert, Leuz & Verrecchia (2007), which states that investors need information to identify risks related to firm performance, so the higher voluntary disclosure made by the firm, the lower firm’s capital costs are. Reduced costs of capital will be followed by an increase in the value of the firm.
Although in Indonesia the disclosure of GHG emissions is still voluntary, these disclosure are useful for reducing information asymmetry between firms and outsiders, including investors, thereby facilitating the efficient allocation of scarce resources (Healy and Palepu 2001). Firms that voluntarily and transparently disclose their GHG emissions can reduce the rate of return requested by investors because investors can estimate firm-specific information (Diamond 1985) and process their investment decisions adequately (Aerts and Cormier 2009). However, if the firm does not disclose GHG emissions, it is possible that investors will treat these non-disclosure firm as a bad signal and penalize them (Milgrom 1981). In addition, investors tend to seek information on GHG emissions themselves for firms that do not disclose. This information seeking process is costly for investors and thus this also ultimately increases firms costs (Johnston 2005).
Previous research shows that GHG emissions disclosure has a positive effect on firm value (Matsumura, Prakash and Vera-Munoz 2014, Saka and Oshika 2014) and return on assets (ROA) (Ganda 2017). Dhaliwal, Li, Tsang, & Yang (2011) confirm that environmental disclosures are identical to lower costs of equity capital, while Guidry & Patten
(2010) observe positive reactions by the stock market when high-quality sustainability reports are issued. Thus, high disclosure will increase the firm value. However, there are other contradictory research findings where the disclosure of GHG emissions has a negative effect on return on investment (ROI) (Prado-Lorenzo, et al. 2009) and market value added (MVA) (Ganda 2017). Hsu & Wang (2013) found that when firms disclose information that their business raises GHG emissions that contribute to global warming, the public will respond this information negatively because investors concerned that the costs incurred by the firm to reduce global warming can outweigh the benefits it received.
In Indonesia study conducted by Siregar & Deswanto (2018) found that environmental disclosures do not affect the firm value, whereas in the context of GHG emissions, Anggareni (2015) found that GHG emissions disclosure has a positive effects on firm value. Because previous research on the effect of disclosure of GHG emissions information on firm value is still inconclusive, the first hypothesis of this study is:
H1: GHG emissions disclosure affects the firm value.
The impact of environmental performance on firms can be seen from two perspectives (Hassel, Nyquist and Nilsson 2005). First, environment-related costs can be considered investment expenditures which increase competitiveness and profitability (Porter and Linde 1995a). Public views good environmental performance as a good news so firms are competing with each other to show superior environmental performance. This competition ultimately produces more innovation, productivity, and profitability. Cucchiella, Gastaldi, & Miliacca (2017) argue that good environmental management activities (waste management, water consumption, controlling GHG emissions, refining waste and so on) can lead to saving firms’ resources, increasing productivity and income, and ultimately the value of the firm. In other words, a firm can obtain economic and social benefits while protecting the environment by adopting a good environmental strategy (Hart and Ahuja 1996). This view is supported by Al-Tuwaijri, Christensen, & Hughes II (2004), Titisari & Alviana (2012), Tjahjono (2013), Anggraeni (2015), and Suratno, Bondan, Darsono, & Mutmainah (2006) research that found environmental performance has a positive effect on firm performance.
However, opponents of this first view argue that the costs incurred for firms to be environmentally friendly usually exceed the benefits, which results in a waste firms resources and reduce profitability (Jaggi and Freedman 1992). As a result, some investors consider environmental expenditure as an additional cost which reduces income and decreases firm value (Hassel, Nyquist and Nilsson 2005). This is also supported by Lewandowski’s (2017) research, who found that firms with superior environmental performance must pay an expensive fee for such performance.
In line with legitimacy theory, firms disclose information as a reaction to environmental (economic, social and political) pressures and to legitimize the existence and behavior of firms (Guthrie and Parker 1989). Lindblom (1994) defines legitimacy as a condition or status that exists when the value system of an entity is equal to the value system of a large social system in which the entity is a part of it. Disclosure of environmental performance can provide information to the public that the firm cares about the environment and has tried to preserve it and therefore gain legitimacy from the society. Also, in harmony with stakeholder theory, firms must pay attention to the interests of all stakeholders in order to succeed in the long term (Jones 1995). The rise of the issue of global warming has caused environmentally conscious stakeholders to become more aware of firm’s activities related to environmental impacts (Cucchiella, Gastaldi and Miliacca 2017), therefore making firm’s environmental performance as an important aspect.
Measuring environmental performance in Indonesia can be done through the Performance Rating Assessment Programme on Environment Management (PROPER/Program Penilaian Peringkat Kinerja Perusahaan) of the Ministry of Environment Republic of Indonesia. This program aims to encourage firms to comply with environmental regulations and achieve environmental excellence through the integration of sustainable development principles in the production and service processes, by implementing an environmental management system, 3R (Reduce, Reuse and Recycle), energy efficiency, conservation of resources, ethical business conduct, and community responsibility through community development programs (Ministry of Environment 2013). Because the impact of environmental performance on firms can be seen from two perspectives and the results of previous
research on the effect of environmental performance on firm value is still inconclusive, the second hypothesis in this study is:
H2: Environmental performance affects the firm value.
As discussed previously, the disclosure of GHG emissions can be seen both positively or negatively. Positive view of GHG emissions disclosure claimed that disclosure shows that the firm has the capability to manage the environmental impact of their business (Griffin and Sun 2013). Therefore, PROPER rating (environmental performance) can provide an independent and objective assessment (by the Ministry of Environment), of how well the firm’s performance in managing those environmental impact into five color ratings. On the other hand, Anggraeni (2015) claimed that disclosing GHG emissions information indicates that the firm is actually involved in the process of climate change. Hence, the presence of environmental performance can provide assurance to the public that even though firms contribute to climate change, they have also tried to minimize these impacts.
Saka & Oshika (2014) is the first research to examine the interaction between GHG emissions disclosure and environmental performance on firm value. They found that the greater the volume of GHG emissions (environmental performance), the stronger the positive effect of GHG emissions disclosure on firm value. Nevertheless, research conducted by Anggraeni (2015) shows that environmental performance does not affect the relationship between GHG emissions disclosure and firm value. Based on the explanation, this study assumes that the PROPER rating can moderate the effect between GHG information disclosure and firm value. The third hypothesis in this study is: H3: Environmental performance will strengthen/
weaken the effect of GHG emissions disclosure on firm value.
Firms that disclose their environmental information demonstrate transparency, reduce the risk of uncertainty, and provide a competitive advantage. Conversely, firms that disclose little or no disclosure show many risks, such as the risk of litigation, penalties for pollution, future environmental costs, and low future cash flows (Iatidris 2013). Therefore, the main motivation for firms to disclose information is to improve the image and reputation of the firm in
the public eye (Hooghiemstra 2000). Arimura, Hibiki, & Katayama (2008) stated that now customers need “green” products and processes to avoid the risks coming from suppliers (firms) who are less environmentally conscious. Therefore, it is important to know that the public will choose firms that care about the environment. As a consequence, it is important for firms to disclose environmental information in annual reports and/or sustainability reports so that the public will know that the firm cares about the environment, obtains legitimacy to continue its business, and ultimately increases firm value.
Leverage, size, and profitability are also an important aspect in assessing firm value. Leverage, which was measured using debt to equity (DER) ratio, is described as the extent to which a firm’s assets are financed by debt compared to its own capital (Weston and Copeland 1986). According to Brigham & Houston (2007), greater debt shows greater investment risk. Conversely, the lower the leverage ratio, the lower the risk faced by the firm. On the contrary, Mai (2006) in the trade-off theory claimed that the increase of debt ratio to the optimum point will increase the firm value by the amount of the tax burden multiplied by the debt. In addition, the signaling theory states that when the manager believes that the firm’s prospect is good in the future, the manager will use debt so that investors believe that the use debt is a signal that the firm value will rise (Hutchinson 1995).
Kodongo, Mokoaleli-Mokoteli, & Maina (2015) claims that firm size is the main factor that determines firm value. The larger the size of the firm, the more interested investors will be in investing in the firm. Oboh, Filibus, & Adekoya (2012) research found that firm size has a significant positive effect on firm value. Large companies have large economies of scale, the possibility of bankruptcy is lower and diversified so it is easier to get funds. Sujoko & Soebintoro (2007) claimed that firm’s profitability, which was measured using net operating income, is one of the considerations in making investment decisions by investors. High profitability is responded positively by the public, because of the public views these firms as having good management capabilities, and thus making investors more confident in investing in these firms (Lubis, Sinaga and Sasongko 2017).
This study is important as according to data released by the World Resource Institute (WRI) Indonesia ranks the 6th largest GHG emitting country in the world with a total of 1,98 billion tons of CO2
emissions per year, while research on GHG emissions disclosure to companies in Indonesia itself is still limited. This study is also important because there are still many inconsistencies in results among previous studies.
RESEARCH METHODS
The sample of this study was selected using following criteria: (1) Firms listed on the PROPER rating for the 2014-2017 period; (2) Firms listed on the Indonesia Stock Exchange (IDX) for the 20142017 period; and (3) Firms that publish annual reports and/or sustainability reports that can be downloaded through the IDX website or the website of each firm. This study used quantitative data with secondary data sources. Data was obtained from annual reports and/ or sustainability reports which can be found on the IDX’s official website, namely www.idx.co.id or each firm’s website. The list of firms evaluated by the Ministry of Environment was obtained from the official website of the Ministry of Environment for the PROPER program, namely www.proper.menlh.go.id.
Firm value as the dependent variable in this study was measured using the Tobin’s Q in period t+1, to see when firms disclose GHG emissions and environmental performance in period t will have an impact on the firms’ future (t+1) value. Tahir & Razali (2011) states that through Tobin’s Q ratio, firms are said to have succeeded in creating value if the return of investment is greater than the cost of investment. Conversely, firms are called failing to achieve valuemaximizing goals if the value of Tobin’s Q is smaller than 1. March 31st was chosen in line with Capital Market and Financial Institution Supervisory Agency (Bapepam/Badan Pengawas Pasar Modal dan Lembaga Keuangan) Regulation Number KEP-346/ BL/2011 which stated that annual financial reports are submitted to Bapepam no later than the end of the third month.
Tobin1 sQ
MVE + Total Debt Total Asset
MVE = Stock Price on March 31st x Number of Outstanding shares
Data on stock prices and the number of outstanding shares on March 31st can be downloaded through the IDX official website, namely www.idx.co. id in the summary section. Total debt and total asset on March 31st obtained from the statement of financial position of the 1st quarter
financial report which can be downloaded through the IDX official website, namely www.idx.co.id in the listed firm’s financial and annual reports section.
The measurement of GHG emissions disclosure as the first independent variable used the carbon emissions disclosure index by Choi, Lee, & Psaros (2013) with content analysis method. The index adopted from the research of Choi, Lee, & Psaros (2013) consists of five broad categories relating to climate change and carbon emissions as follows: 1) GHG emissions accounting; 2) climate change: risks
and opportunities; 3) Energy consumption accounting; 4) GHG reduction and cost; 5) Carbon emissions accountability.
To measure the extent of GHG emissions disclosure, a checklist consisting of 18 disclosure items was used. Each disclosure item is worth 1 so that if the firm discloses all items (in the annual report and/or sustainability report) then the firm’s score is 18. Carbon emission disclosure index by Choi, Lee, & Psaros (2013) are shown in Table 1.
Table 1. Carbon Emissions Disclosure Index
|
Category |
Item |
Information |
Score |
|
Climate Change: Risks and Opportunities |
CC-1 |
Assessment/description of the risks (regulatory, physical or general) relating to climate change and actions taken or to be taken to manage the risks. |
1 |
|
CC-2 |
Assessment/description of current (and future) financial implications, business implications and opportunities of climate change. |
1 | |
|
GHG-1 |
Description of the methodology used to calculate GHG emissions (e.g. GHG protocol or ISO). |
1 | |
|
GHG-2 |
Existence external verification of quantity of GHG emissions (if so by whom and on what basis). |
1 | |
|
GHG-3 |
Total GHG emissions (metric tonnes CO2-e emitted). |
1 | |
|
GHG Emissions |
GHG-4 |
Disclosure of Scopes 1 and 2, or Scope 3 direct GHG |
1 |
|
Accounting |
emissions.* | ||
|
GHG-5 |
Disclosure of GHG emissions by sources (e.g. coal, electricity, etc.). |
1 | |
|
GHG-6 |
Disclosure of GHG emissions by facility or segment level. |
1 | |
|
GHG-7 |
Comparison of GHG emissions with previous years. |
1 | |
|
EC-1 |
Total energy consumed (e.g. tera-joules or petajoules). |
1 | |
|
EC-2 |
Quantification of energy used from renewable sources. |
1 | |
|
EC-3 |
Disclosure by type, facility or segment. |
1 | |
|
Energy |
RC-1 |
Detail of plans or strategies to reduce GHG emissions. |
1 |
|
Consumption Accounting |
RC-2 |
Specification of GHG emissions reduction target level and target year. |
1 |
|
RC-3 |
Emissions reductions and associated costs or savings achieved to date as a result of the reduction plan. |
1 | |
|
RC-4 |
Cost of future emissions factored into capital expenditure planning. |
1 | |
|
ACC-1 |
Indication of which board committee (or other executive body) has overall responsibility for actions |
1 | |
|
Carbon Emissions |
related to climate change. | ||
|
Accountability |
ACC-2 |
Description of the mechanism by which the board (or other executive body) reviews the firm’s progress regarding climate change |
1 |
|
18 | |||
Source: Choi, Lee, & Psaros (2013)
*Description of Scope 1, Scope 2, and Scope 3 are shown in the following table:
Table 2. Description of Scope 1, 2 and 3
|
Scope 1 |
Direct greenhouse gas (GHG) emissions |
a. b. |
Direct GHG emissions occur from sources that are owned or controlled by the firm. For example, emissions from combustion in owned or controlled boilers, furnaces, vehicles, etc. and emissions from chemical production in owned or controlled process equipment. |
|
Scope 2 |
Electricity indirect GHG emissions |
a. b. c. |
Scope 2 accounts for GHG emissions from the generation of purchased electricity consumed by the firm. Purchased electricity is defined as electricity that is purchased or otherwise brought into the organisasional boundary of the firm. Scope 2 emissions physically occur at the facility in which electricity is generated. |
|
Scope 3 |
Other indirect GHG emissions |
a. b. c. |
Scope 3 is an optional reporting category that allows for the treatment of all other indirect emissions. Scope 3 emissions are a consequence of the activities of the firm but occur from sources not owned or controlled by the firm. Some examples of Scope 3 activities are the extraction and production of purchased materials, the transportation of purchased fuels and the use of sold products and services. |
Source: Choi, Lee, & Psaros (2013)
Weighting formula of this index is as follows:
total score of firm i in period t
GHG =----. , ------x100%
Maximum total score
The second independent variable that also acts as a moderating variable was environmental performance. The firm’s environmental performance was proxied by the Performance Rating Assessment
Programme on Environment Management (PROPER) rating obtained by each firm, which can be obtained from annual reports and/or sustainability reports. The rating consists of five colors, ranging from gold (best), green (very good), blue (good), red (bad), and black (very bad). Environmental Performance was measured based on a ranking system, ranging from 1 to 5 as shown in table 3.
|
Table 3. PROPER Measurement | |
|
Score |
Description |
|
5 4 3 2 1 |
Gold color in PROPER Green color in PROPER Blue color in PROPER Red color in PROPER Black color in PROPER |
The control variable used is leverage, size, and profitability. Leverage, which was measured using debt to equity (DER) ratio, was computed with total debt/total equity which was obtained from statement of financial position. Size, which was measured using total assets, was obtained from statement of financial position. While profitability, which was measured using net operating income, was obtained from
income statement of each firms.
This study used moderated regression analysis. Model 1 was used to test hypotheses 1 and 2, with the following equation:
TOBINSQt+1 = β0 + β1GHGit + β2PROPERit + β3DERit + β4SIZEit+ β5OPINCit + εit
Model 2 is used to test hypothesis 3, with the following equation:
TOBINSQt+1 = β0 + β1GHGit + β2PROPERit + β3GHGxPROPERit + β4DERit + β5SIZEit + β6OPINCit + εit
Where:
TOBINSQt+1 = Firm value on March 31st t+1
GHGit = GHG emissions disclosure
PROPERit = Environmental performance
DERit = Firm’s debt to equity ratio
SIZEit OPINCit εit
= Firm’s size
= Firm’s net operating income
= error
RESULTS AND DISCUSSION
The final sample consisted of 42 firms listed in the PROPER rating during the 2014-2017 period. PROPER participants can be mandatory or voluntary (Ministry of Environment 2013). The sample selection results are presented in the following table:
Table 4. Sample Selection Results
Sample Criteria Number of Observation
|
1. |
Firms listed on the PROPER rating for the 2014-2017 period. |
1.908 |
|
2. |
Firms do not listed on the PROPER rating for the 2014-2017 period. |
(1.866) |
|
3. |
Firms do not publish annual reports and/or sustainability reports that can be downloaded through the IDX website or the website of each firm. |
(0) |
|
Total Sample |
42 |
|
Period |
4 |
|
Total Final Sample |
168 |
Source: Computed Data, 2018
Furthermore, descriptive statistics were computed. Descriptive statistics contained the minimum, maximum, mean and standard deviation
value of the firms in research sample. Descriptive statistics are presented in the following table:
Table 5. Descriptive Statistics
|
Variable |
N |
Minimum |
Maximum |
Mean |
Std. Deviatio |
|
TOBINS’Q |
168 |
0,35 |
21,05 |
2,82 |
4,10 |
|
GHG |
168 |
- |
100,00 |
34,36 |
31,74 |
|
PROPER |
168 |
2 |
5 |
3 |
1 |
|
DER |
168 |
0,09 |
8,71 |
0,97 |
1,11 |
|
SIZE |
168 |
502.990.012 |
92.534.431.078 |
17.012.668.502 |
20.855.853.13 |
|
OPINC |
168 |
- 701.438.493 |
16.179.317.965 |
2.139.192.162 |
3.313.011.14 |
*SIZE and OPINC are in thousands of IDR Source: Computed Data, 2018
Descriptive statistics of each variable are reported in Table 5. The dependent variable in this study, which is firm value (TOBINSQ), has a minimum value of 0,35 and a maximum value of 21,05. The average value of the firms in this study is 2,82, this indicates that the majority of samples in this study are firms with high Tobins’Q value. The standard deviation of 4,10 shows that the firms in this study are very diverse so they can represent all firms in Indonesia.
The first independent variable in this study, namely the disclosure of GHG emissions (GHG) has a minimum value of 0percent and a maximum value of 100percent. The average GHG emissions disclosure in 168 samples is 34,36percent. This shows that the level of GHG emissions disclosure in study sample is still quite low. The standard deviation of 31,74percent indicates that the firms in this study sample is very varied and the distance between firms is very large.
Environmental performance (PROPER) as an independent variable as well as a moderating variable between GHG emissions (GHG) disclosure and firm value (TOBINSQ) has a minimum value of 2 (red color) and a maximum value of 5 (gold color). The firms that became the sample of the study was dominated by the value of 3, namely the blue color rating. This indicates that the average environmental performance in sample firms in Indonesia is already good.
The first control variable in this study is leverage, which was measured using debt to equity ratio (DER), shows the minimum value of 0,09 and the maximum value of 8,71. The average of debt to equity ratio in the sample firms is 0,97 and the standard deviation is 1,11. Second control variable is firm size, which was measured using total assets (SIZE). The minimum value of firm size is 502.990.012.416 IDR and the maximum value of firm size is 92.534.431.078.400 IDR. The average firm size in the study sample is 17.012.668.502.482 IDR and the standard deviation is 20.855.853.135.612
IDR. The last control variable in this study is net operating income (OPINC). The minimum value of firms’ net operating income is -701.438.492.672 IDR and the maximum value of net operating income is 16.179.317.964.800 IDR. The average net operating income is 2.139.192.162.355 IDR and the standard deviation is 3.313.011.141.471 IDR.
Before conducting regression analysis, a series of tests to determine the best model in panel data processing was conducted. Therefore, in this study we applied Chow test and Hausman test. Firstly, we applied Chow test to determine whether pooled Ordinary Least Square (OLS) model or Fixed Effect model is more suitable. The Chow test results show the p-value is lower than 0,05 therefore in favor of the Fixed Effect model. Next, Hausman test is conducted to determine whether Fixed Effect model or Random Effect model is more suitable. The Hausman test results show the p-value is higher than 0,05 therefore in favor of the Random Effect model. The final decision was to use Random Effect model.
Table 6. Regression Test Results Model 1
|
Variable |
Coefficients |
Sig. Value | |
|
(Constant) |
0,2827 |
T sig |
0,6788 |
|
GHG |
5,2122 |
T sig |
0,0000*** |
|
PROPER |
0,3029 |
T sig |
0,0354*** |
|
DER |
0,3710 |
T sig |
0,0496*** |
|
SIZE |
- 5,86E-14 |
T sig |
0,0005*** |
|
OPINC |
2,28E-13 |
T sig |
0,0054*** |
|
F |
F sig |
0,0000*** | |
|
R Square |
0,2033 | ||
***statistically significant at 5 percent level **statistically significant at 10 percent level Source: Computed Data, 2018
The magnitude of the effect of the independent variables GHG (X1), PROPER (X2), DER (X3), SIZE (X4) and OPINC (X5) on the dependent variable TOBINSQ (Y) can be seen from the value of R2 which is equal to 20,33percent, which means the independent variable GHG (X1), PROPER (X2), DER (X3), SIZE (X4) and OPINC (X5) are able to explain the TOBINSQ (Y) of 20,33percent and the remaining 79,67percent is explained by other variables not discussed in this research. Significance value of F which less than 0,05 means that the resulting regression model is suitable to determine the effect of the independent variables GHG (X1), PROPER (X2), DER (X3), SIZE (X4) and OPINC (X5) on the dependent variable TOBINSQ (Y).
Examining the effect of GHG emissions disclosure (GHG) on firm value (TOBINSQ) shows significance value level lower than 0,05, which is 0,0000. This result indicates that partially, GHG emissions disclosure has a positive effect on firm value. A positive regression coefficient indicates that the higher GHG emissions disclosure made by the firm, the higher firm value is. Based on this finding, it can be concluded that the HA1 is accepted. The results showed that the public responded positively to firm’s effort to disclose their carbon emissions. In line with the theoretical framework by Lambert, Leuz & Verrecchia (2007), which states that investors need information to identify risks related to firm performance, so the higher voluntary disclosure
made by the firm, the lower firm’s capital costs are. Reduced costs of capital will be followed by an increase in the value of the firm. When associated with GHG emissions disclosure, it can be concluded that firms which voluntarily and honestly disclose their GHG emissions provide transparent non-financial information to investors about GHG emissions produced by the firm and how well they manage GHG emissions (Najah 2012). This information further reduces the risk of estimation and helps investors to be more confident deciding in which firm they should invest.
The results of this research that prove GHG emissions disclosure has a positive effect on firm value are also in line with research findings by Saka & Oshika (2014), Matsumura, Prakash, & Vera-Munoz (2014) and Anggraeni (2015). Disclosing information about GHG emissions provided an added value to stakeholders because stakeholders can understand how firm’s policies, value, and motives to cope with GHG emissions and their environment (Ahmad and Hossain 2015). This shows that in Indonesia consumers make decisions based on how well firms manage their environmental problem and thus, choosing brands not only by its products quality but also those who are environmentally responsible.
Examining the effect of environmental performance (PROPER) on firm value (TOBINSQ) shows significance value level lower than 0,05, which is 0,0354. These results indicate that partially, environmental performance has a positive effect on firm value. Based on these findings, it can be concluded that HA2 is accepted. The results of this study indicate that the public considers the management of the environment as one indicator in assessing firm performance. Good environmental performance is responded positively by the public so firms compete with each other to show good environmental performance and this competition will result in more innovation, productivity, and profitability (Porter and Linde 1995a). In a sense, by adopting a good environmental strategy, firms can obtain economic and social benefits while protecting the environment (Hart and Ahuja 1996). Cucchiella, Gastaldi, & Miliacca (2017) claimed that good environmental management activities (waste management, water consumption, controlling GHG emissions, refining waste and so on) can lead to saving firm’s resources, increasing productivity and income, and ultimately the value of the firm.
The finding of positive effect of environmental performance on firm value is also in line with legitimacy and stakeholder theory. Disclosure of
environmental performance can provide information to the public that the firm cares about the environment and has tried to preserve it and therefore gain legitimacy from the society. Also, the rise of the issue of global warming has caused environmentally conscious stakeholders to become more aware of firm’s activities related to environmental impacts (Cucchiella, Gastaldi and Miliacca 2017), therefore making firm’s environmental performance as an important aspect. These results are also in line with previous researches by Al-Tuwaijri, Christensen, & Hughes II (2004), Titisari & Alviana (2012), Tjahjono (2013), Anggraeni (2015), and Suratno, Bondan, Darsono, & Mutmainah (2006). Environmental performance measured using PROPER ratings has been responded positively by the majority of people in Indonesia. The increase of public attention to environmental issues and increasingly stringent regulations related to the environment make sustainable environmental management an important aspect of assessment for a firm (Yadav, Han and Rho 2015).
Before conducting regression analysis for model 2 (moderation test), a series of tests to determine the best model in panel data processing was conducted. Therefore, in this study we applied Chow test and Hausman test. Firstly, we applied Chow test to determine whether pooled Ordinary Least Square (OLS) model or Fixed Effect model is more suitable. The Chow test results show the p-value is lower than 0,05 therefore in favor of the Fixed Effect model. Next, Hausman test is conducted to determine whether Fixed Effect model or Random Effect model is more suitable. The Hausman test results show the p-value is higher than 0,05 therefore in favor of the Random Effect model. The final decision was to use Random Effect model.
The magnitude of the effect of the independent variables GHG (X1), PROPER (X2), GHGx PROPER (X3), DER (X4), SIZE (X5) and OPINC (X6) on the dependent variable TOBINSQ (Y) can be seen from the value of R2 which is equal to 22,48percent, which means the independent variable GHG (X1), PROPER (X2), GHGxPROPER (X3), DER (X4), SIZE (X5) and OPINC (X6) are able to explain the TOBINSQ (Y) of 22,48percent and the remaining 77,52percent is explained by other variables not discussed in this research. Significance value of F which less than 0,05 means that the resulting regression model is suitable to determine the effect of the independent variables GHG (X1), PROPER (X2), GHGxPROPER (X3), DER (X4), SIZE (X5) and OPINC (X6) on the dependent
Table 7. Moderation Test Result
|
Variable |
Coefficients |
Sig. Value |
|
(Constant) |
1,0549 T sig |
0,1711 |
|
GHG |
2,0452 T sig |
0,2605 |
|
PROPER |
0,0602 T sig |
0,7418 |
|
GHGxPROPER |
0,9658 T sig |
0,0318*** |
|
DER |
0,3403 T sig |
0,0705** |
|
SIZE |
- 5,65E-14 T sig |
0,0008*** |
|
OPINC |
1,93E-13 T sig |
0,0201*** |
|
F |
F sig |
0,0000*** |
|
R Square |
0,2248 |
***statistically significant at 5 percent level **statistically significant at 10 percent level Source: Computed Data, 2018
variable FV (Y).
Examining the effect of GHG emissions disclosure on firm value (TOBINSQ) which moderated by environmental performance (GHGxPROPER) shows significance values lower than 0,05, which is 0,0318. These results indicate that environmental performance can moderate the relationship between GHG emissions disclosure and firm value, thus it can be concluded that HA3 is accepted. These results are in line with previous research done by Saka & Oshika (2014), but contrary to research done by Anggraeni (2015). The use of Tobin’s Q as a proxy for firm value shows that the public responds positively to the disclosure of GHG emissions which moderated by PROPER ratings. Disclosing GHG emissions shows that the firm has the capability to manage the environmental impact of their business (Griffin and Sun 2013). Therefore, PROPER rating can provide an independent and objective assessment (by the Ministry of Environment) of how well the firm’s performance in managing those environmental impact and this assessment is considered important by the public in the context of disclosure of GHG emissions disclosure by the firm.
As for control variables, debt to equity ratio and net operating income as control variables have a positive effect on firm value but size has a negative effect on firm value. In harmony with Mai (2006) in the trade-off theory, the increase of debt ratio to the optimum point will increase the firm value by the amount of the tax burden multiplied by the debt. In addition, the signaling theory states that when the manager believes that the firm’s prospect is good in the future, the manager will use debt so that investors
believe that the use debt is a signal that the firm value will rise (Hutchinson 1995). These results also in harmony with research done by Saeedi & Mahmoodi (2011), which found that capital structure (measured using debt ratios) had a positive effect on firm value using Tobin’s Q. When the firm uses a debt that is greater than the amount of equity, it can minimize the overall cost of capital because the cost of debt capital tends to be lower than the cost of equity capital, so the firm can enjoy the benefits of tax savings from using debt.
Firm’s profitability, which was measured using net operating income, is one of the considerations in making investment decisions by investors. High profitability is responded positively by the public, because of the public views these firms as having good management capabilities, and thus making investors more confident in investing in these firms (Lubis, Sinaga and Sasongko 2017). The results of this study also found that firm size, which was measured using total assets, has a negative effect on firm value. These results are the opposite with the previous research conducted by Oboh, Filibus, & Adekoya (2012) which found that firm size has a significant positive effect on firm value.
CONCLUSIONS
This study aimed to investigate the effect of greenhouse gas emissions disclosure and environmental performance on firm value. This study also investigates the role of environmental performance in moderating the relationship between them. Based on the results of tests conducted in the previous chapter, the conclusions that can be drawn are as follows: (1) GHG emissions disclosures has a
significant positive effect on firm value. Therefore, the higher the level of GHG emissions disclosure carried out by the firm, the higher the value of the firm; (2) Environmental performance has a significant positive effect on firm value. As a consequence, the better the firm’s environmental performance, the higher the value of the firm; (3) Environmental performance can moderate the relationship between GHG emissions disclosure and firm value. Thus, the use of Tobin’s Q as a proxy for firm value provides a response to the disclosure of GHG emissions in the presence of environmental performance; (4) Debt to equity ratio and net operating income as control variables have a positive effect on firm value but size has a negative effect on firm value.
There are several limitations in this study that might affect the results: (1) This study did not examine many samples, limited only to firms whose performance was evaluated by the Ministry of Environment through the PROPER program; (2) The low value of R Square from the models tested in this study indicates that other variables not used in this study have a greater influence on firm value. Based on the limitations of this study, the authors suggest further research can increase the number of research samples by changing proxies for environmental performance, so it is not limited only to companies that participate in the PROPER program. In addition, it is recommended for further study to consider using other variables that have more influence on the firm value, other than the variables used in this study.
REFERENCES
Abdel-Rahim, Heba, Y. M., and Yousef Abdel-Rahim.
“Green accounting – a proposition for EA/ER conceptual implementation methodology.” Journal of Sustainability and Green Business 1 (2010).
Aerts, W, and D Cormier. “Media legitimacy and corporate environmental communication.” Accounting, Organizations and Society 34, no. 1 (2009): 1-27.
Ahmad, N., N., N., and D., M. Hossain. “Climate change and global warming discourses and disclosures in the corporate annual reports: A study on the Malaysian companies.” Procedia - Social and Behavioral Sciences 172 (2015): 246-253.
Al-Tuwaijri, S.A., T.E. Christensen, and K., E.
Hughes II. “The relations among environmental disclosure, environmental performance, and economic performance: A simultaneous equations approach.” Accounting, Organizations, and Society 29 (2004): 447-471.
Anggraeni, Dian Yuni. “Pengungkapan emisi gas rumah kaca, kinerja lingkungan, dan nilai perusahaan.” Jurnal Akuntansi dan Keuangan Indonesia 12, no. 2 (2015): 188-209.
Arimura, Toshi, H., Akira Hibiki, and Hajime Katayama. “Is a voluntary approach an effective environmental policy instrument?” Journal of Environmental Economics and Management 55, no. 3 (2008): 281-295.
Brigham, E., F., and J., F. Houston. Fundamentals of Financial Management. 11. South-Western, 2007.
Campbell, D., P. Shrives, and H.B. Saager. “Voluntary disclosure of mission statements in corporate annual reports: signaling what and to whom?” Business and Society Review 106, no. 1 (2001): 65–87.
Choi, Bo, Bae, Doowon Lee, and Jim Psaros. “An analysis of Australian company carbon emission disclosures.” Pacific Accounting Review 25, no. 1 (2013): 58-79.
Clarkson, P., Y. Li, G. Richardson, and F. Vasvari. “Revisiting the relation between environmental performance and environmental disclosure: an empirical analysis.” Accounting, Organization and Society 33, no. 4-5 (2008): 303-327.
Cucchiella, F., M. Gastaldi, and M. Miliacca. “The management of greenhouse gas emissions and its effects on firm performance.” Journal of Cleaner Production 167 (2017): 1387-1400.
Dhaliwal, D.S., O.Z. Li, A. Tsang, and Y.G. Yang. “Voluntary nonfinancial disclosure and the cost of equity capital: the initiation of corporate social responsibility reporting.” The Accounting Review 86, no. 1 (2011): 59-100.
Diamond, D, W. “Optimal release of information by firms.” The Journal of Finance 40, no. 4 (1985): 1071-1094.
Dunlap, and Saarce. “Enviromental problems and protection.” Public Opinion Quarterly 55, no. 4 (1991): 651-672.
Ganda, Fortune. “The influence of carbon emissions disclosure on company financial value in an emerging economy.” Environment, Development and Sustainability 20 (2017): 1-10.
Ghozali, I., and A. Chariri. Teori Akuntansi. Semarang: Badan Penerbit Universitas Diponegoro, 2007.
Griffin, P., and Y. Sun. “Going green: Market Reactions to CSR newswire releases.” Journal of Accounting and Public Policy 32, no. 2 (2013).
Guidry, R.P., and D.M. Patten. “Market reactions to the first-time issuance of corporate sustainability
reports: evidence that quality matters.” Sustainability Accounting, Management and Policy Journal 1, no. 1 (2010): 33-50.
Guthrie, J., and L., D. Parker. “Corporate social reporting: a rebuttal of legitimacy theory.” Accounting & Business Research 9, no. 76 (1989): 343-352.
Hart, S, L, and G Ahuja. “Does it pay to be green? An empirical examination of the relationship between emission reduction and firm performance.” Business Strategy and the Environment 5, no. 1 (1996): 30-47.
Hassel, L., S. Nyquist, and H. Nilsson. “The value relevance of environmental performance.” European Accounting Review 14, no. 1 (2005): 41-61.
Healy, P., M., and K., G. Palepu. “Information asymmetry, corporate disclosure, and the capital markets: A review of the empirical disclosure literature.” Journal of Accounting and Economics 31, no. 1-3 (2001): 405-440.
Hooghiemstra, Reggy. “Corporate communication and impression management–new perspectives why companies engage in corporate social reporting.” Journal of business ethics 27, no. 1 (2000): 55-68.
Hsu, A. W., and T. Wang. “Does the market value corporate response to climate change?” Omega 41, no. 2 (2013): 195-206.
Hutchinson, R., W. “The capital structure and investment decision of the small ownermanaged firm: Some explanatory issues.” Journal of Small Business Economics 76 (1995): 231-239.
Iatidris, G., E. “Environmental disclosure quality: Evidence on environmental performance, corporate governance and value relevance.” Emerging Market Review 14 (2013): 55-75.
Intergovernmental Panel on Climate Change. “Climate change 2014: synthesis report.” Contribution of working Groups I, II and III to the fifth assessment report of the Intergovernmental Panel on Climate Change. Geneva: IPCC, 2014.
Jaggi, B, and M Freedman. “An examination of the impact of pollution performance on economic and market performance: pulp and paper firms.” Journal of Business Finance & Accounting 19, no. 5 (1992): 697-713.
Jaggi, Bikki, Alessandra Allini, Riccardo Macchioni, and Annamaria Zampella. “Do investors find carbon information useful? Evidence from Italian firms.” Review of Quantitative Finance and
Accounting 50, no. 4 (2018): 1031-1056.
Johnston, J., S. “Signaling Social Responsibility: on the Law and Economics of Market Incentives for Corporate Environmental Performance.” Working paper 66. University of Pennsylvania Law School, 2005.
Jones, T. M. “Instrumental stakeholder theory - A synthesis of ethics and economics.” Academy of Management Reviews 20 (1995): 404-437.
Jose, A., and S. M. Lee. “Environmental reporting of global corporations: A content analysis based on website disclosures.” Journal of Business Ethics 72, no. 4 (2006): 307-201.
Kodongo, Odongo, Thabang Mokoaleli-Mokoteli, and Leonard, N. Maina. “Capital structure, profitability and firm value: Panel evidence of listed firms in Kenya.” The African Finance Journal, Africagrowth Institute 17, no. 1 (2015): 1-20.
Lambert, R, C Leuz, and R Verrecchia. “Accounting information, disclosure, and the cost of capital.” Journal of Accounting Research 45, no. 2 (2007): 385-420.
Lewandowski, Stefan. “Corporate carbon and financial performance: The role of emission reductions.” Business Strategy and the Environment 26, no. 8 (2017): 1196-1211.
Lindblom, C., K. “The implications of organizational legitimacy for corporate social performance and disclosure.” Paper presented at the Critical Perspectives on Accounting Conference. New York, 1994.
Lubis, Ignatius Leonardus, Bonar M Sinaga, and Hendro Sasongko. “Pengaruh profitabilitas, struktur modal, dan likuiditas terhadap nilai perusahaan.” Jurnal Aplikasi Bisnis dan Manajemen 3, no. 3 (2017): 458-465.
Luo, L., and Q Tang. “Does voluntary carbon disclosure reūect underlying carbon performance?” Journal of Contemporary Accounting & Economics 10, no. 3 (2014): 191-205.
Mai, M., U. “Analisis variabel-variabel yang mempengaruhi struktur modal pada perusahaan LQ-45 di Bursa Efek Jakarta.” Ekonomika, 2006: 228-245.
Matsumura, E. M., R. Prakash, and S. C. Vera-Munoz. “Firm-value effects of carbon Emissions and carbon disclosures.” The Accounting Review 89, no. 2 (2014): 695-724.
Milgrom, P. R. “Good news and bad news: Representation theorems and applications.” Bell Journal of Economics (Autumn), 1981: 380–391.
Ministry of Environment. Performance Rating Assessment Programme on Environment Management. 2013. http://proper.menlhk.go.id.
Ministry of Environment. “Republic of Indonesia Ministry of Environment Regulation Number 6 of 2013 Performance Rating Assessment Programme on Environment Management.” Jakarta, 2013.
Morris, R. “Signalling, agency theory and accounting policy choice.” Accounting and Business Research 18, no. 69 (1978): 47-56.
Najah, M., S., M.,. Carbon risk management, carbon disclosure and stock market effects: An international perspective. University of Southern Queensland, 2012.
Oboh, Collins, Envulu, Isa Filibus, and Adeleke, Clement. Adekoya. “Corporate capital structure and corporate market value: Empirical evidence from Nigeria.” International Journal of Economics and Finance 4, no. 12 (2012): 193-201.
Oliveira, Manuel Au-Yong, and Joćo José Pinto Ferreira. “Facilitating qualitative research in business studies: Using the business narrative to model value creation.” African Journal of Business Management 5, no. 1 (2011): 68-75.
Porter, M, E, and Cvd Linde. “Toward a new conception of the environment- competitiveness relationship.” The Journal of Economic Perspectives 9, no. 4 (1995a): 97-118.
Prado-Lorenzo, J., L. Rodrķguez Domķnguez, I. Gallego Įlvarez, and I. Garcķa Sįnchez. “Factors inūuencing the disclosure of greenhouse gas emissions in companies world-wide.” Management Decision 47, no. 7 (2009): 11331157.
Rokhmawati, Andewi, Milind Sathye, and Suneeta Sathye. “Effect of GHG emission, environmental performance, and social performance on financial performance of listed manufacturing firms in Indonesia.” Procedia -Social and Behavioral Sciences 211 (2015): 461-470.
Saeedi, A., and I. Mahmoodi. “Capital structure and firm performance: Evidence from Iranian Companies.” Int. Research J. Finance and Economics, 2011.
Saka, C., and T. Oshika. “Disclosure effects, carbon
emissions and corporate value.” Sustainability Accounting, Management and Policy Journal 5, no. 1 (2014): 22-45.
Siregar, Sylvia Veronica, and Refandi Budi Deswanto. “Association between environmental disclosures with financial performance, environmental performance, and firm value.” Social Responsibility Journal 4, no. 1 (2018): 180-193.
Sujoko, and U Soebiantoro. “Pengaruh struktur kepemilikan, leverage, faktor intern, dan faktor ekstern terhadap nilai perusahaan (studi empirik pada perusahaan manufaktur dan non manufaktur di bursa efek Jakarta).” Jurnal Manajemen dan Kewirausahaan 9, no. 1 (2007): 41-49.
Suratno, I. Bondan, Darsono, and S. Mutmainah. “Pengaruh Environmental Performance terhadap Environmental Disclosure dan Economic Performance.” Paper presented at Simposium Nasional Akuntansi 9. Padang, 2006.
Tahir, Izah Mohd, and Ahmad Rizal Razali. “The relationship between enterprise risk management (ERM) and firm value: Evidence From Malaysian public listed companies.” International Journal of Economics and Management Sciences 1, no. 2 (2011): 32-41.
Titisari, Kartika, Hendra, and Khara. Alviana. “Pengaruh environmental performance terhadap economic performance.” Jurnal Akuntansi dan Keuangan Indonesia 9 (2012): 56-67.
Tjahjono, Mazda Eko Sri. “Pengaruh kinerja lingkungan terhadap nilai perusahaan dan kinerja keuangan.” Jurnal Ekonomi 4, no. 1 (2013): 38-46.
Weston, John, Fred, and Thomas, E. Copeland. Managerial finance. New York: Dryden Press, 1986.
Wibisono, Yusuf. Membedah konsep dan aplikasi corporate social responsibility (CSR). Gresik: Fascho Publishing, 2007.
Yadav, Prayag Lal, Seung Hun Han, and Jae Jeung Rho. “Impact of environmental performance on firm value for sustainable investment: Evidence from large US firms.” Business Strategy and the Environment 25, no. 6 (2015): 402-420.
Discussion and feedback