The The Effect of Inflation and Investment Growth Rate on Local Income in South Sumatra 2018-2020
on
pISSN : 2301 – 8968
JEKT ♦ 16 [2] : 225-253
eISSN : 2303 – 0186
The Effect of Inflation and Investment Growth Rate on Local
Income in South Sumatra 2018-2020
Sukmini Hartati
ABSTRACT
According to the national development mission, which calls for the realization of an independent, prosperous, and united society based on Pancasila and the 1945 Constitution. One of the strategies for improving the nation's standard of living is economic growth, involving local governments' use of natural resources and initiatives to increase products per capita. This study examines how regional original income in the Regencies/Cities of South Sumatra Province is affected by investment growth and inflation between 2018 and 2020, partially and simultaneously. The analysis in this study is done with panel data, which is a combination of cross-sectional and time-series data. Locally generate revenue is negatively impacted by the inflation rate, as this study demonstrates. Meanwhile, the rate of investment growth has a positive impact on local revenue. Local revenue is positively impacted by both inflation and the investment growth rate simultaneously.
Keywords: Inflation Rate, Investment Rate, Locally Generate Revenue (LGR)
ABSTRAK
Sesuai dengan misi pembangunan nasional yang menyerukan terwujudnya masyarakat yang mandiri, sejahtera, dan bersatu berdasarkan Pancasila dan Undang-Undang Dasar 1945. Salah satu strategi untuk meningkatkan taraf hidup bangsa adalah pertumbuhan ekonomi yang melibatkan penggunaan sumber daya alam oleh pemerintah daerah dan inisiatif untuk meningkatkan produk per kapita. Kajian ini mengkaji bagaimana pendapatan asli daerah Kabupaten/Kota di Provinsi Sumatera Selatan dipengaruhi oleh pertumbuhan investasi dan inflasi antara tahun 2018 dan 2020, baik secara parsial maupun simultan. Analisis dalam penelitian ini dilakukan dengan data panel yang merupakan gabungan dari data cross-sectional dan time-series. Pendapatan Asli Daerah (PAD) terkena dampak negatif dari tingkat inflasi, seperti yang ditunjukkan oleh studi ini. Sementara itu, laju pertumbuhan investasi berdampak positif terhadap pendapatan asli daerah. Penerimaan daerah dipengaruhi secara positif oleh inflasi dan tingkat pertumbuhan investasi secara bersamaan.
Kata Kunci: Tingkat Inflasi, Pertumbuhan Investasi, Pendapatan Asli Daerah (PAD)
INTORDUCTION
The management of existing resources by local governments and theircommunities to promote regional economic development is known as regional economic development. To lessen their reliance on the federal government, local governments must therefore be able to effectively and efficiently manage their local finances. PAD must emerge as the primary source of power in the government area if local governments are to reduce their reliance on the central government.
According to Djaenuri (2012), A measure of an autonomous region's progress in carrying out administrative activities related 225
to government and development is PAD. The Regional Government uses a ratio of PAD to total regional revenue to determine a region's financial independence. PAD continues to be the primary force behind the execution of government initiatives and regional development.
According to Martini, Zaliah, and Winarko's (2018) study, "Regional Original Income of South Sumatra Province from Market Retribution Contribution," the province's capacity to collect regional original income is considered to be fairly satisfactory. PAD's growing role in the Regional
Table 1.1
Realization of PAD 17 Regencies/Cities in South Sumatra Province T.A 2018 to T.A 2020
(In Rupiah)
|
No. |
Districts/Cities |
2018 |
2019 |
2020 |
|
PAD |
PAD |
PAD | ||
|
1. |
Lahat District |
1,916,874,000,902 |
141,161,144,249 |
119,670,768,419 |
|
2. |
Musi Banyuasin District |
3,019,699,825,934 |
286,594,847,516 |
338,792,835,000 |
|
3. |
Musi Rawas District |
1,759,880,995,093 |
128,563,715,133 |
154,244,636,036 |
|
4. |
Muara Enim District |
2,525,583,634,051 |
303,296,321,152 |
251,892,474,784 |
|
5. |
Ogan Komering Ilir District |
2,224,001,831,454 |
195,401,652,978 |
290,303,807,756 |
|
6. |
Ogan Komering Ulu District |
1,412,521,909,219 |
145,563,548,513 |
160,910,882,390 |
|
7. |
Palembang City |
3,485,882,634,350 |
1,081,114,690,868 |
1,844,718,837,000 |
|
8. |
Prabumulih City |
958,368,934,099 |
100,975,564,958 |
105,670,424,500 |
|
9. |
Pagar Alam City |
769,448,437,268 |
60,064,187,982 |
65,337,500,884 |
|
10. |
Lubuk Linggau City |
923,898,833,425 |
100,950,256,994 |
98,035,966,287 |
|
11. |
Banyuasin District |
2,080,649,009,995 |
200,616,348,310 |
184,000,411,308 |
|
12. |
Ogan Ilir District |
1,417,185,838,011 |
86,150,568,158 |
179,192,296,990 |
|
13. |
Ogan Komering Ulu Timur District |
1,627,163,554,868 |
99,017,727,658 |
107,866,678,700 |
|
14. |
Ogan Komering Ulu Selatan District |
1,268,126,824,334 |
57,669,139,990 |
66,233,818,602 |
|
15. |
Empat Lawang District |
978,617,329,498 |
41,672,141,481 |
56,561,822,055 |
|
16. |
Penukal Abab Lematang Ilir District |
1,226,434,373,054 |
84,794,229,883 |
114,458,106,968 |
|
17. |
Musi Rawas Utara District |
922,981,792,439 |
37,574,950,357 |
56,214,544,000 |
Source: Directorate General of Financial Weighing of South Sumatra Province in 2018-2020
As can be seen from the preceding data, PAD's contribution to South Sumatra Province over the past three years 2018- 2020 is still a province that has not been responsible for financing national development in its region. Because of the availability of raw materials from a variety of sources, including the agricultural sector, the plantation sector, the
sector, and excavation products from the earth, as well as the forestry sector, South Sumatra Province is considered to have superior potential in the field of investment, both PMDN and PMA. These raw materials can also be used as a source of benefits for the country's foreign exchange.
mining
From table 1.2 above, it can be seen that the total investment in South Sumatra Province in the last five years. In 2019, it was recorded that more than RP 26 trillion of investment funds entered the South Sumatra region. This amount increased compared to the achievement of investment in 2018 which reached Rp 25 trillion. This fund comes from PMDN around 60 percent, the remaining 40 percent is from PMA. However, there is an advantage for 2020 that South Sumatra Province brings investment worth IDR 38 trillion throughout the Covid-19 period
which is able to exceed the investment
target of only IDR 26 trillion.
With the increase in organizing
activities in South Sumatra Province,
inflation will be caused. Inflation is
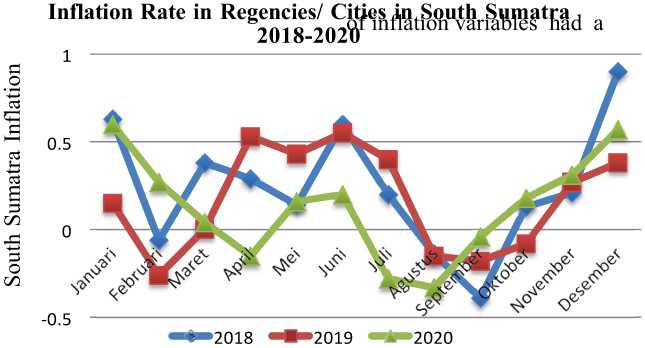
economic instability characterized by a situation where there is an increase in prices for goods/services in general over a long period of time. This will trigger deteriorating economic conditions if no prevention is taken. The District/City Inflation Rate in South Sumatra can be seen in figure 1.1.
Table 1.2
Growth Rate of FDI and PMDN Investment in Regencies/Cities in South Sumatra in 2016-2020
|
Tahun |
PMDN ( Milyar Rupiah ) |
PMA ( Juta US$ ) |
|
2016 |
8534,1 |
2793,5 |
|
2017 |
8200,2 |
1181,9 |
|
2018 |
9519,8 |
1078,6 |
|
2019 |
16921,1 |
736,5 |
|
2020 |
15824,5 |
1543,9 |
Source: Investment Agency and PTSP of South Sumatra Province, 2016-2020
demonstrated that the results of a partial analysis
Source : Data processed from the Central Statistics Agency of South Sumatra, 2018-2020
Revenue and Expenditure Budget (APBD) for 2013– 2015, which has increased on average by
39.35 percent each year, is evidence of this. However, Regional Native Income's contribution to South Sumatra Province
remains modest in comparison to transfers from the central government. This is evident from the following information regarding South Sumatra Province Revenue in the years 20182020:
Figure 1.1 District/City Inflation Rate in South Sumatra in 2018-2020 (%)
According to Chart 1.1, the weakening of people's purchasing power causes the annual inflation rate in South Sumatra Province to decrease or slow while the number of commodity goods stays the same. As a result, businesses tend to raise prices slightly while maintaining the same wages. According to research carried out by Karlina (2013), the outcomes of simultaneous analysis of the independent variables, specifically investment rates and inflation, had a significant impact on the dependent variable, PAD. This was due to the rising value and price of goods and services that contributed to the amount of Regional Original Income (PAD) in Manado city, in contrast to the research carried out by Indra, Anderson, and Jacline (2017), which
positive effect on PAD in Manado city.
In light of the disparities in the results of the study, researchers reexamined the relationship between investment rates and independent variables. Additionally, this study used arise in South Sumatra Province's Regional Native Income (PAD) as a dependent variable. Based on the previous explanation, the title of the study is "The Effect of Inflation Rate and Investment Growth Rate on Regional Original Income (PAD) in Regencies/Cities in South Sumatra Province in 2018-2020".
The following can be derived from the preceding background:
-
1. Is the Original Regional Income in South Sumatra's Regencies and Cities affected by the Inflation Rate in 2018-2020?
-
2. Does the Investment Growth Rate have an impact on Regional Original Income (PAD) in South
Sumatra's Regencies and Cities between 2018 and 2020?
-
3. Between 2018 and 2020, what will be the investment to regional native income (PAD) inflation rate and growth rate in South Sumatra's regencies and cities?
The researcher narrowed the scope of the discussion by focusing on one of the sources of Regional Original Income (PAD), specifically investment and inflation in South Sumatra Province between 2018 and 2020, based on the above formulation of the problem. In addition, the researchers restricted the topic of discussion to regency/city governments in South Sumatra from 2018to 2020 only.
As described above the goals of this study are as follows:
-
1. To test and determine how the rate of inflation affects regional original income in cities and regions in South Sumatra.
-
2. To determine and test the impact of the investment growth rate on regional original income in South Sumatran cities and regions.
-
3. To test and determine how the rate of investment growth and inflation affect regional
original income in South Sumatran cities and regions.
LITERATURE REVIEW
Regional Original Revenue
Regional Original Income (PAD) is money that is collected in accordance with the laws and regulations that are in place,as stated in Article 1 of Law No. Section 33 of the 2004 Constitution, Concerning the Financial Balance Between the Central and Local Governments. "Regional Original Income (PAD) is regional income derived from local tax proceeds, regional levy proceeds, segregated regional wealth management proceeds, and other legitimate Regional Native Revenues," asstated by Badrudin (2017:100). The objective is to seek funding flexibility in accordance with the decentralization principle.
From a portion of the understandings above with respect to PAD, it tends to be expressed that PAD is income gotten by a district obtained from its own domain, for example, the consequences of gathering charges and territorial requires, the aftereffects of overseeing isolated local riches and other genuine Cushion gathered in view of provincial guidelines and pertinent regulations. Legitimate local revenues and the remaining budget from the previous year can be utilized as additional sources of funding for administration of local governments.
The four (4) sources of Regional Original Income are outlined in Article 6, paragraph 1 of Law No. 33 of 2004 Concerning
the Financial Balance Between the Central Government and Regional Governments: Results from regional wealth management that are segregated, taxes in the region, restructuring, and other valid PAD.
Inflation Rate According
"Inflation is a tendency to increase prices for goods and services that generally rise continuously caused by the amount of money in circulation that is too much compared to the goods and ajsa that are available," according to Firdaus (2011:115). Constant expansion in the general cost of labor and products. In general, inflation is the state of a nation's economy when its growth rate is higher than what is required.
Economists are also deeply concerned about inflation as one of the economic issues. As is well known, one of the main objectives of the economy is to maintain a relatively stable price level, which means that economic symptoms usually indicate that the price level is constantly rising. The condition of inflation is that prices in general continue to increase. If a commodity price rises or a commodity price rises due to seasonal factors, then it is not called inflation.
Based on the foregoing, Inflation is
a general upward trend in the cost of goods and services over an extended period of time and is at a high level which causes the economy to develop rapidly from the desired state, which means that there is an inequality in demand between commodity demand or a minimum level of production due to large demand. There are several kinds of inflation theories that include aspects of the inflation process, while the three aspects are quantity theory, keynes theory and structuralist theory.
-
2.1 Investment Growth Rate
"In essence, investment is the beginning of economic development activities," as Mankiw (2014:94) explains. Investments can be made by the private sector, the government, or through government-private partnership. One strategy that the government can employ to foster economic expansion that can ultimately enhance people's standard of living is through investment. According to Noor (2009:4) "investment is an investment activity that can be carried out by various parties, both individual investors, companies or governments in a country, can be in the form of money or other resources with the expectation of getting benefits or benefits in the future". Investment can be sourced from Domestic Investment (PMDN) and Foreign Investment (PMA).
It is explained in Law No. 25/2007 on Investment that; The company's activities in Indonesia are financed by Foreign Direct Investment (FDI). PMDN
is the community's wealth capital. It is made up of people or businesses that have been established in Indonesia in accordance with the relevant laws andregulations.
Based on some of the definitions above, that investment is a commitment to the placement of the amount of funds or other resources such as the purchase of land to erect industrial buildings, the purchase of production equipment and the provision of capital/ raw goods invested at the present time, in the hope of obtaining greater results in the future as compensation for the delay in the use of the invested funds and the risk of loss that may lead to uncertainty of payment/ return in the future.
Relationship of InvestmentGrowth Rate to Regional Native Income (PAD)
In the regional revenue structure, part of PAD is sourced from the management of separate regional wealth. When local governments are trying to increase revenue to fund public services, and people can immediately feel the results, then the management of their own regional assets becomes very important. However, in reality, the results obtained from the segregated assets are very small, so the investments made by local governments on an ongoing basis are only like wasted funds, harming the regional
budget and not contributing to improving services to the community.
BUMD capital participation is part of long-term regional investment, and the cumulative amount is displayed on the asset side balance sheet. In its budget, one or more investments are not recognized as expenditures, but are included in financing expenditures. On the other hand, investment returns are classified as PAD. Therefore, the general policy of the APBD will include an explanation of this income and financing.
According to Raharjo and Manurung (2008:49) in macroeconomic theory, "physical investment is in the form
of goods and capital (factories and equipment), buildings and inventory with these restrictions, the definition of investment can be more clearly defined as expenses that increase the stock of capital goods (capital stock)". The amount of capital goods multiplied by the acquisition price per unit of capital goods is typically used to value the stock of capital goods in order to make the calculations easier. Thus capital goods are a stock concept, because the magnitude is calculated at one particular period.
-
2.2 Previous Research
This research is certainly inseparable as a basis and reference in compiling the framework or direction of this research. A summary of previous research is presented in the form of table 2.1.
Table 2.1
Summary of Previous Research
|
No. |
Researcher's Name (Year) |
Research Title |
Research Variables |
Research Results |
|
1. |
Eni Aryanti & Iin Indrianti (2012) |
Effect of Macro Variables on Regional Original Income for the 2000-2009 Period in Semarang City |
Variable : Gross Regional Domestic Product (GRDP) (X1), Total Population (X2), Inflation (X3), Local Revenue (Y). |
Inflation variables statistically have no effect on PAD receipts, because inflation causes several effects that can reduce real income. |
|
2. |
Muchtolifah (2010) |
Effect of GRDP, Inflation, Industrial Investment and Amount of Labor on Local Income in Mojokerto City |
Variable : Gross Regional Domestic Product (GRDP) (X1), Total Population (X2), Inflation (X3), Industrial Investment (X4), Number of Workers (X5), Local Revenue (Y). |
This study explains simultaneously that Mojokerto City's regional native income (PAD) is positively correlated with inflation and industrial investment. |
|
3. |
Karlina Batik (2013) |
Analysis of the Effect of Investment, GRDP, Total Population, Development Revenue and Inflation on Local Revenues in West Lombok Regency |
Variables : Effect of Investment (X1), GRDP (X2), Total Population (X3), Development Revenue (X4), Inflation (X5), Local Revenue (Y). |
The relationship between the Investment and Inflation Variables and the bound variable, Regional Original Income, is statistically explained to be significant. Regional Native Income is influenced partially by the variables of investment and inflation. |
|
4. |
Pande & Agung (2014) |
Analysis of Variables Affecting Local Revenues in Bali Province |
Variable : Percapita income (X1), Inflation Rate (X2), Investment (X3), Regional Autonomy (X4), Regional Original Income (PAD) (Y). |
In Bali Province, both the inflation rate and the investment rate have a significant impact on local income. Inflation has a negative impact on pad in Bali Province, which is partially explained. In Bali |
|
Province, investment has a positive and significant impact on PAD Revenue. | ||||
|
5. |
Indra Randy Waley, Anderson G. Kumenaung, Jacline I. Sumual (2017) |
Analysis of the Effect of Inflation and Gross Regional Domestic Product (GRDP) on Local Revenues in Manado City |
Variables: Inflation (X1), Gross Regional Domestic Product (GRDP) (X2), Total Local Revenue (Y). |
In Manado City, the inflation variable partially contributes to an increase in Regional Original Income (PAD). |
|
6. |
Sari (2013) |
Analysis of Variables Affecting Local Indigenous Income (PAD) in Bali Province |
Variable : Number of Foreign Tourist Visits (X1), Investment Level (X2), Gross Regional Domestic Product (GRDP) (X3), Regional Original Income (Y). |
Between 1991 and 2009, PAD in Bali Province was positively and significantly influenced by the variable investment level in this study. |
|
7. |
Ayu Mita Utami (2013) |
The Effect of Investment and Economic Growth on Local Indigenous Income (Case Study in Tasikmalaya City Government) |
Variables: Investment (X1), Economic Growth (X2), Local Income (Y). |
Partially explained that PAD is not significantly affected by the Investment Variable. Simultaneously, Investment and Economic Growth together have an influence on increasing the amount of Regional Native Income. |
|
8. |
Enni Sari Siregar (2016) |
Effect of Inflation Rate on Investment in South Sumatra Region |
Variable: Inflation Rate (X), Regional Investment (Y). |
Inflation has no significant effect on investment in South Sumatra. |
|
9. |
Umdatul Husna (2015) |
Effect of GRDP, Inflation, Government Expenditure on Local Revenues in Cities throughout Central Java |
Variables: GRDP (X1), Inflation (X2), Government Expenditure (X3), Local Revenue (Y). |
Variable Inflation has no significant effect on Local Revenues. |
Source : Previous Research, 2010 to 2017
-
2.3 Framework of Thought
The relationships between the variables to
be studied can theoretically be explained with a positive mental attitude. "A conceptual model of the relationship
between theory and a variety of factors is the frame of thought, and these factors are interpreted as crucial issues." states Sugiyono (2017:60). Figure 2.1 depicts the mindset employed in this study.
Information:
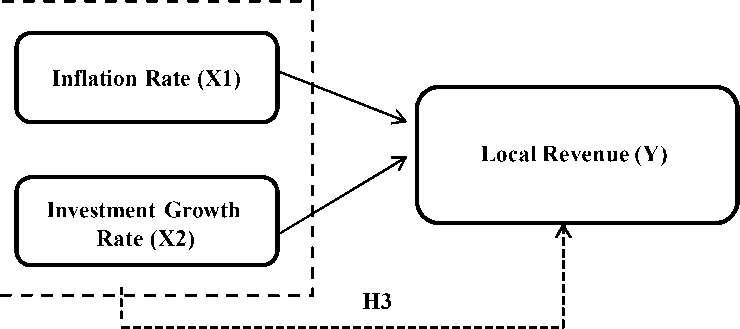
Figure 2.1
Thinking Framework

: Partial Influences
: Simultaneous Influence
-
2.4 Hypothesis
Sugiyono's (2017: 63) indicates that: This hypothesis serves as a short-term response to research statements in which the question statement is stated in short, comprehensible sentences. It is made sense of for impermanent responses, since the responses given depend on applicable speculations, as opposed to exact realities
acquired through information assortment or poll studies.
H1: The rate of inflation has a significant impact on regional Native Income.
H2: The investment growth rate has an effect on the initial regional income.
H3: The Expansion Rate and the Pace of Speculation Development influence the Territorial Unique Pay.
-
3. RESEARCH METHODOLOGY
-
3.1 Types of Research
-
This kind of research uses quantitative techniques. According to Sugiyono (2016:8), in accordance with positivism, quantitative research methods can be deciphered as research strategies. These methods are used to investigate specific populations or tests, gather data using research instruments, and conduct quantitative/measurable research with the sole purpose of proving predetermined hypotheses.
-
3.2 Place and Time of Research
The City Government in South Sumatra Province conducted this study. This study was carried out from February 2021 to June 2021. This study uses the following data:
-
1. Regional Original Income in Regencies/Cities in South Sumatra in 2018-2020 which was obtained from the official website of the
Regional Asset Financial Management Agency of South Sumatra Province (Dependent variable).
-
2. Kapubaten/City Inflation Rate in South Sumatra Province in 2018-
2020 obtained from the Central Statistics Agency of South Sumatra Province (Independent variable).
-
3. The Growth Rate of Regency/City Investment in South Sumatra
Province in 2018-2020 obtained from the Investment Agency and PTSP of South Sumatra Province (Independent variable).
-
3.3 Operational Definition of Variables 3.3.1 Independent Variables (X)
Independent variables or free variables, as Sanusi (2016:50) defines them, are variables that have an effect on other variables. The rate of investment growth and inflation are the independent variables used in this study.
Inflation = IHKn - IHK(n-1) X 100
IHK(n-1)
-
3.3.2 Dependent Variables (Y)
Sanusi According (2016: 49), "Dependent variables (bound) are variables that are influenced by the presence of free variables," the study's dependent variable was Regional Native Income.
-
3.4 Population and Sample
According to Sugiyono (2016:117), " Population is a broad category of things or people with particular qualities and characteristics that the researcher chooses to investigate and draw conclusions from". The population of the study ranged from 17 regencies and cities in South Sumatra Province between the years 2018 and 2020.
Table.3.2
List of Regencies/Cities in South Sumatra Province
|
No. |
Provinces and Regencies/Cities |
|
1. |
Banyuasin District |
|
2. |
Empat Lawang District |
|
3. |
Lahat District |
|
4. |
Muara Enim District |
|
5. |
Musi Banyuasin District |
|
6. |
Musi Rawas District |
|
7. |
Musi Rawas Utara District |
|
8. |
Ogan Ilir District |
|
9. |
Ogan Komering Ilir District |
|
10. |
Ogan Komering Ulu District |
|
11. |
Ogan Komering Ulu Selatan District |
|
12. |
Ogan Komering Ulu Timur District |
|
13. |
Penukal Abab Lematang Ilir District |
|
14. |
Lubuklinggau City |
|
15. |
Pagar Alam City |
|
16. |
Palembang City |
|
17. |
Prabumulih City |
Sugiyono (2016:118) "Samples are part of the population's number and characteristics". In order to select the sample for this study, total sampling was used. According to Sugiyono (2016:124),
"Total Sampling is a sampling technique in which the number of samples is equal to the number of populations". This explanation is used because sampling employs the entire population when the
number of populations is less than 100.
The sample was used in this study if it met
the following requirements:
Table.3.3
Sampling Criteria
|
No. |
Identification |
Number of Samples |
|
1. |
Regencies/Cities in South Sumatra Province that have LKPD data, Inflation Data and Investment Realization Data in full during 2018-2020. |
17 |
|
2. |
Number of years of research |
3 |
|
Number of units of analysis |
51 |
The sample used as a study consisted of all regencies/cities in South Sumatra Province, namely 17 regencies/cities for 3 periods from 2018-2020.
-
3.5 Data Collection Techniques
According to Sugiyono (2016:8) explained that there are two types of data collection techniques that are distinguished based on data collection sources, namely:
-
1. Primary Data: data gathered directly from the subject of the study. Essential information is viewed as more exact, since on this information are introduced exhaustively.
-
2. Additional Data: data that has been made available through a variety of sources despite not being directly obtained. Most of the time, secondary data comes in the form of records, reports, or historical evidence that has been compiled
from both published and unpublished archives (documentary data).
-
3.6 Data Analysis Techniques
Sugiyono asserts (2016:147): An activity that follows the collection of data from all responses is called data analysis. The data were analyzed in this study using multiple linear regression. SPSS version 24 is used to manage the collected data in order to support the investigation and test the proposed hypothesis. The data in this study are analyzed using methods of descriptive statistical analysis, classical assumption tests, multiple linear regression analysis, determination coefficient tests, and hypothesis tests.
-
4. RESULTS AND DISCUSSION
-
4.1 Research Results
-
This study was processed using SPSS version 24. The data that are processed in this study are the Investment Realization Data of the Regency/City Government of South Sumatra Province, the Inflation Rate Data from the Central Statistics Agency (BPS), and the Budget Realization Report (LRA) of the
Regency/City Government of South Sumatra Province. The data tests used in this study are descriptive statistics, the classical assumption test, the coefficient of determination test, the multiple linear regression test, and the hypothesis test. In addition, a look at how the rate of investment growth and inflation affect regional native income in South Sumatra Province was done.
-
4.1.1 Descriptive Statistical Analysis
Table 4.1
Results of Descriptive Statistical Analysis
|
Descriptive Statistics | |||||
|
N |
Minimum |
Maximum |
Mean |
Std. Deviation | |
|
Inflation Rate (X1) |
51 |
-0.11 |
1.12 |
0.6215 |
0.33131 |
|
Investment Growth Rate (X2) |
51 |
0.41 |
16.69 |
12.4647 |
3.04435 |
|
Local Revenue (Y) |
51 |
9.91 |
14.43 |
11.8371 |
0.98388 |
|
Valid N (listwise) |
51 | ||||
Source: Processed data output (spss 24), 2021
In table 4.1, you can see a list of the average values, middle values, maximum values, minimum values, and standard deviations that can be derived from descriptive statistical analysis:
-
a. The Regional Original Income Variable (Y) has a minimum value of 9.91 obtained from Ogan Komering Ulu Selatan Regency in 2020, the maximum value of 14.43 obtained from Palembang City in 2020, the average Regional Original Income 11.8371, and a standard deviation of
0.98388 with a total sample of 17 and 51 units of analysis.
-
b. The Inflation Rate Variable (X1) has a minimum value of -0.11 obtained from Musi Rawas Utara Regency in 2018, a maximum value of 1.12 obtained from Musi Banyuasin Regency in 2019, an average Inflation Rate of 0.6215, and a standard deviation of 0.33131 with a total sample of 17 and 51 analysis units.
-
c. The Investment Growth Rate Variable (X2) has a minimum value of 0.41
obtained from Ogan Komering Ulu Regency 2018, a maximum value of 14.43 obtained from Ogan Komering Ilir Regency in 2020, an average Investment Growth Rate of 11.8371, and a standard deviation of 0.98388
with a total sample of 17 and 51
analysis units.
4.1.2 Classical Assumption Test
4.1.2.1 Normality Test
Source : Data processed with SPSS 24
(2021)
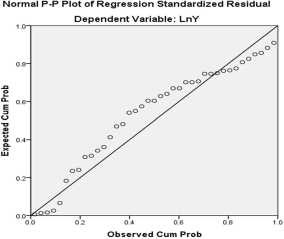
Figure 4.1 Normality Test Results with P-P Plot of Regression standardized residual
The results of the normality test analysis, which showed that the data used in this study's distribution formed dots around the normal line, are shown in Figure 4.1. The regression model then fulfills the normality assumption. Testing the normality of the chart can be difficult if we are careless. It appears normal from a visual perspective, but statistically, it may not be. As a result, a Kolmogorov-Smirnov test with a single sample is used for statistical testing. Ghozali (2018:161) states that "a relapse condition will pass ordinariness assuming the huge worth of the Kolmogorov Smirnov test is more noteworthy than 0.05".
Table 4.2
Normality test results with One Sample Kolmogorov Smirnov One-Sample Kolmogorov-Smirnov Test
Unstandardized Residual
|
N |
39 |
|
Normal Parametersa,b |
Mean .0000000 Std. Deviation .41305781 |
|
Most Extreme Differences |
Absolute .157 Positive .086 Negative -.157 |
|
Test Statistic |
.157 |
|
Asymp. Sig. (2-tailed) |
.016c |
|
Exact Sig. (2-tailed) |
.261 |
|
Point Probability |
.000 |
a. Test distribution is Normal.
b. Calculated from data.
c. Lilliefors Significance Correction.
Source: Data processed with SPSS 24 (2021)
The Exact P Values showed that the K-S value in the One Sample Kolmogorov Smirnov normality test was 0.261 for a total of 51 samples. An example that has an importance esteem
above 0.05 or 5% implies that it shows that the leftover worth is regularly disseminated and meets the old style suspicions so it can continue to the following investigation.
-
4.1.2.2 Multicholinearity Test
Table 4.3
Multicollinearity Test Results
Coefficientsa
|
Model |
Unstandardized Coefficients |
Standardized Coefficients Beta |
T |
Sig. |
Collinearity Statistics | ||
|
B |
Std. Error |
Tolerance |
VIF | ||||
|
1 (Constant) |
9.674 |
.373 |
25.942 |
.000 | |||
|
Inflation Rate |
.238 |
.217 |
.149 |
1.100 |
.278 |
.814 |
1.228 |
|
Investment Growth Rate |
.142 |
.032 |
.600 |
4.419 |
.000 |
.814 |
1.228 |
a. Dependent Variable: Pendapatan Asli Daerah
Source : Data processed with SPSS 24 (2021)
The following are the outcomes of the calculation of the tolerance and VIF values, as shown in table 4.3:
-
a. Since the VIF for the Inflation Rate is 1,228 10, and the tolerance value for the Inflation Rate is 0.814 > 0.10, the regression model declares that the Inflation Rate does
not exhibit multicollinearity.
-
b. The tolerance for the Investment Growth Rate is 0.814 0.10, and the VIF for Government Investment is 1,228 10, so the Investment is 1,228 10. The government stated that the regression model did not have multicollinearity.
-
4.1.2.3 Autocorrelation Test
Table 4.4
Autocorrelation Test Results with Durbin-Watson
Before transformation
Model Summaryb
|
Model |
R |
R Square |
Adjusted R Square |
Std. Error of the Estimate |
Durbin-Watson |
|
1 |
.193a |
.037 |
-.012 |
331850.40050 |
1.052 |
a. Predictors: (Constant), Investment Growth Rate (X2) (in million rupiah ), Inflation Rate (X1) b. Dependent Variable: Local Revenue (Y) (in million rupiah)
Source: Data processed with SPSS 24 (2021)
At significance 0.05, the DL and DU values for the study sample (N 51) and the number of free variables (k 2) were 1.468 and 1.630, respectively. The autocorrelation test results above indicate that the Durbin-Watson (DW) value is 1,052. Autocorrelation exists in the regression model, as evidenced by the fact that the DW value is lower than the DL
value, or 1.052. According to Ghozali (2013), one way around it is to transform using the Cochrane Orcutt method until the Durbin-Watson (DW) test results show a regression model without autocorrelation. The results of the autocorrelation test that was carried out with SPSS 24 following the Cochrane Orcutt method transformation are as follows:
Table 4.5
Autocorrelation Test Results with Durbin-Watson After Transformation Model Summaryb
|
Model R R Square Adjusted R Square Std. Error of the Estimate |
Durbin-Watson |
|
1 .678a .460 .430 .42438 |
1.712 |
a. Predictors: (Constant), LnX2, LnX1
b. Dependent Variable: LnY
Source: Data processed with SPSS 24 (2021)
After transfusion using the Cochrane Orcutt method, Durbin-Watson (DW) autocorrelation test results showed a value of 1.712, which is different from the value of 1.052 seen before transfusion. Because the DL value was 1.415 after the transformation and the DU value was 1.609, we can say that the regression model did not have autocorrelation because the DU value was < DW < 4-DU, or 1.6091 < 1.712 < 2.3909.
-
4.1.2.4 Heteroskedasticity Test
Scatterplot
Dependent Variable: LnY
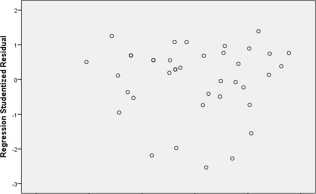
Regression Standardized Predicted Value
Source : Data processed with SPSS 24
(2021)
-
Figure 4.2 Results of Heteroskedasticity Test with Scatterplot
The regression model does not have a heteroskedasticity issue, as shown in figure 4.2. Plotting has a significant disadvantage because the number of
observations influences the results. The plot graph's results are more difficult to interpret the fewer observations there are. As a result, statistical tests are required to better guarantee the results' accuracy. The
heteroskedasticity test that was performed with SPSS 24 and the Glejser test yielded the following outcomes to enhance the accuracy of the heteroskedasticity test results for the regression model.
Table
|
Model |
4.6 Heteroskedasticity Test Results With Glejser test Coefficientsa Unstandardized Coefficients Standardized Coefficients B Std. Error Beta T Sig. |
|
1 (Constant) |
.208 .228 .912 .368 |
|
LnX1 |
-.115 .133 -.159 -.871 .390 |
|
LnX2 |
.014 .020 .133 .732 .469 |
a. Dependent Variable: ABS_X2
Source : Data processed with SPSS 24 (2021)
The Glejser test reveals that the correlation values of the three independent variables with the dependent variables are significantly higher than 0.05, with X1 = 0.390 > 0.05 and X2 = 0.469 > 0.05,
respectively, according to the heterochedasticity test results. Because its significance is greater than 0.05, there is no heteroskedasticity issue with the regression model.
-
4.1.3 Multiple Linear Analysis
Table 4.7
Multiple Linear Regression Test Results
Coefficientsa
|
Model |
Unstandardized Coefficients B Std. Error |
Standardized Coefficients Beta |
T |
Sig. | |
|
1 (Constant) |
9.674 |
.373 |
25.942 |
.000 | |
|
Inflation Rate |
.238 |
.217 |
.149 |
1.100 |
.278 |
|
Inflation Growth Rate |
.142 |
.032 |
.600 |
4.419 |
.000 |
a. Dependent Variable: Local Revenue
Source : Data processed with SPSS 24 (2021)
In this study, the multiple linear regression equation resulted in the following, as shown in Table 4.7:
Y = 9.674 + 0,238X1 + 0,142X2 + e
The results of the multiple linear regression equation can be summed up as
follows:
-
1. Since the constant (a) has a value of 9.674, the Regional Original Income (PAD) is positive, or 9,674, if the investment growth rate and inflation rate are both at zero.
-
2. If another independent variable has a fixed value, the Regional Original Income (PAD) will also rise by 0.238 for every 1.00 unit increase in inflation, as the value of the
variable regression coefficient for the inflation rate (b1) is positive.
-
3. The investment growth rate's variable regression coefficient (b2) has a positive value of 0.142. This indicates that the Regional Original Income (PAD) will also rise by 0.142 for every one unit increase in investment realization, assuming that all other independent variables are fixed.
-
4.1.4 Coefficient of Determination
Table 4.8
Determination Coefficient Output Results
Model Summaryb
Model R R Square Adjusted R Square Std. Error of the Estimate
1 .678a .460 .430 .42438
-
a. Predictors: (Constant), Inflation Rate, Inflation Growth Rate
-
b. Dependent Variable: Local Revenue
Source : Data processed with SPSS 24 (2021)
The output of the coefficient of determination test resulted in an R value of 0.678. As can be seen in the figure, there is a 67.8% correlation between the independent variable and the dependent variable. Because the value is close to 1, which is the standard measure of the value of the coefficient of determination between the numbers 0 and 1, this indicates a very
close relationship. The value of R Square is 0.460. This suggests that the growth rate of investment can account for 46% of the variation in the dependent variable of Regional Original Income (PAD), whereas other factors that were neither observed nor investigated in this study account for 54% of the variation in the dependent variable of local native income.
-
4.1.5 Hypothesis Test
-
4.1.5.1 Individual Parameter Significant Test (Statistical Test t)
-
Table 4.9
Statistical Test Results t
Coefficientsa
|
Model |
Unstandardized Coefficients B Std. Error |
Standardized Coefficients Beta |
T |
Sig. | |
|
1 (Constant) |
9.674 |
.373 |
25.942 |
.000 | |
|
Inflation Rate |
.238 |
.217 |
.149 |
1.100 |
.278 |
|
Investment Growth Rate |
.142 |
.032 |
.600 |
4.419 |
.000 |
a. Dependent Variable: Local Revenue
Source : Data processed with SPSS 24 (2021)
The count value and significance value of each independent variable (Regional Original Income, Inflation Rate, and Investment Growth Rate) are shown in Table 4.9 above. These values indicate whether the hypothesis has been accepted or rejected. The following can be inferred from the statistical test t (partial test) results:
-
1. How the rate of inflation affects the income in the area.
The inflation rate variable received a significance value of 0.278 when the value was greater than 0.05. If
the value of t-count obtained by 1,100 is less than the value of t-table, which is 2,011, or if t-count is less than t-table, Ho is rejected.
-
2. The impact of the development pace of venture on the first pay of the district.
The significance value for the variable investment growth rate was 0.000, which is less than 0.05. Ho is accepted if the value on the t-count of 4,419 is greater than the value on the t-table of 2,011 or if the t-count on the t-table > (4,419 > 2,011).
-
4.1.5.2 Simultaneous Significance Test (Statistical Test F)
Table 4.10
Statistical Test Results F
ANOVAa
|
Model |
Sum of Squares |
Df |
Mean Square |
F |
Sig. |
|
1 Regression |
5.515 |
2 |
2.757 |
15.311 |
.000b |
|
Residual |
6.483 |
36 |
.180 | ||
|
Total |
11.998 |
38 |
a. Dependent Variable: Local Revenue
b. Predictors: (Constant), Inflation growth rate, Inflation Rate
Source : Data processed with SPSS 24 (2021)
Based on Table 4.10, the statistical and a significance level of 0.000. Number
test F has a calculated F value of 15,311 F count is greater than F of the table, or
15,311 > 3.19, and whose significance value is much lower than 0.05. Thus, it can be concluded that the initial income of the regions in the city and region of South Sumatra for the 2018-2020 fiscal year was influenced by the pace of investment growth and inflation.
-
4.2 Research Discussion
-
4.2.1 Effect of Inflation Rate on Local Native Income
Based on the findings of the study, for the t table of 2,011 (see the statistical table). Because the value of t counts < t table (1,100 < 2,011) with a significance value of 0.278 where it is more than 0.05 or 0.278 > 0.05. It was concluded that H1 was rejected, meaning that the inflation rate did not partially affect the regional original income.
-
4.2.2 Effect of Investment Growth Rate on Local Revenue
Based on the study's findings for the t table of 2,011 (see statistical table). The value of t counts is greater than the value of t table (4,419 > 2,011) because
the significance level is less than or 0.000 < 0.05. The fact that any increase in investment realization will result in an increase in regional income revenue, supports the conclusion that H2 is acceptable.
-
4.2.3 Effect of Inflation Rate and Investment Growth Rate on Local Revenues
The statistical table yields F count 15.311 at a significance level of 0.05, with df 1 = 2 and df 2 = 48. The F table yields 3.19 (see in the statistical table). Because F counts exceed F table (15,311 > 3.19), H3 is accepted. If the significance is less than or equal to 0.05, H3 is accepted; however, if the significance is greater than or equal to 0.05, H3 is rejected. The F test's significance is less than 0.05 (0.0000 < 0.05), so H3 is accepted. The results suggested that the rate of investment growth and inflation had a significant impact on the initial regional income, with a calculated F value of 15,311 and a significance level of 0.000.
-
5. CONCLUSIONS AND RECOMENDATIONS
-
5.1 Conclusions
-
The region's original income is not significantly affected by the inflation rate (has a significance value of > 0.05, which is 0.278). This is due to the fact that, despite the fact that tax and levy rates being set high or low have no effect on the receipt of local income in South Sumatra Province, the inflation rate is required to take tariff changes into account.
The growth rate of investment has a significant and influence on the original regional income as evidenced by obtaining a significance value of < 0.05, which is 0.000, meaning that there is an increase in investment realization which affects the increase in regional original income. This is due to the increase in economic activities such as trade activities, tourist attraction visits, hotels and restaurants which encourages an increase in Regional Indigenous Income in 17 Regencies/Cities in South Sumatra Province.
The inflation rate and the growth rate of investment together affect the original income of the region. This means that in local governments in South Sumatra Province, Regional Original Income
(PAD) can be attributed to the increase or decrease and realization of investment that occurs in each local government in 17 regencies/cities in South Sumatra Province.
-
5.2 Recomendations
In accordance with the findings of the study, the author makes a number of suggestions, some of which are directed at the Regency/City Regional Government in South Sumatra Province. The results of this study indicate that the variable inflation rate has a negative effect on local income. In order to reduce inflation, it is hoped that the regency or city government in South Sumatra Province will be able to control the overall rise in the price of goods and services. Additionally, it is anticipated that they will continue to investigate potential opportunities and strategies for increasing investment, one of which is through investment activities.
It is suggested that future researchers be able to use additional independent variables that are thought to have an effect on local income, such as: GRDP, the number of industries, the number of people, and the period and subject of the study all need to be extended in order to raise the quality of the research results' accuracy.
REFERENCES
Abdullah, dkk. (2015). “Pengaruh Pendapatan Asli Daerah, Dana Alokasi Umum, dan Dana Alokasi Khusus Terhadap Kinerja Keuangan Pemerintah Daerah Kabupaten/Kota Se-Sumatera Bagian Selatan”. Jurnal Akuntansi, Vo.3, No.1, Oktober 2015.
Badan Pusat Statistik. (2020). Tingkat Inflasi Provinsi Sumatera Selatan 2018-2020. BPS-Statistik
Indonesia.
Badrudin, Rudy. (2017). Ekonomika Otonomi Daerah. Yogyakarta: UPP STIM YKPN.
Boediono. (2014). Ekonomi Makro, Seri Sinopsis Pengantar Ilmu Ekonomi. Yogyakarta: BPFE.
Direktorat Jendral Perimbangan Keuangan. (2020). Realisasi Anggaran Pendapatan Belanja Daerah Provinsi Sumatera Selatan. Picked March 18, 2021, from
Firdausy, Canuria. (2017). Kebijakan dan Strategi Peningkatan Pendapatan Asli Daerah dalam
Pembangunan Nasional. Cetakan pertama. Yayasan Pustaka Obor Indonesia : Jakarta.
Ghozali, I. (2018). Analisis Multivariate dan Ekonetrika Teori, Konsep dan Aplikasi dengan E views 10. Semarang: Badan Penerbitan
Universitas Diponegoro.
Halim, Abdul. (2014). Akuntansi
Keuangan Daerah. Edisi 4. Jakarta: Salemba Empat.
Indra, dkk. (2017). Analisis Pengaruh Inflasi dan PDRB terhadap Pendapatan Asli Daerah di Kota Manado. Manado: Universitas Sam
Ratulangi.
Laraspati, Angga. (2020). “Saat ini penerimaan PAD Sumsel mencapai 53%”. In access on dates 20 Februari 2021 from https://news.detik.com/berita/d-5136141/gubernur-herman-deru-saat-ini-penerimaan-pad-sumsel-capai-53.
Mankiw, N. Geegory. (2014). Pengantar Teori Ekonomi Makro Edisi Asia. Jakarta: Salemba Empat.
Martini, dkk. (2018). Pengaruh Kontribusi Pasar terhadap Pendapatan Asli Daerah Provinsi Sumatera Selatan. Palembang: Politeknik Negeri Sriwijaya.
Nova, dkk. (2016). “Faktor-Faktor yang mempengaruhi inflasi Indonesia”, Jurnal Ekonomi Bisnis.
Pasaribu, Rowland B.F. 2013. Jurnal Proyeksi Ekonomi Indonesia 2013: Pembangunan Diatas Pijakan Rapuh. INDEF. Pratiwi, N. (2015). “Pengaruh Faktor Demografi terhadap Jenis Investasi dan Perilaku Investor”. Jurnal Ilmu dan Riset Manajemen. Vo.3. No.7.
Republik Indonesia. Peraturan Pemerintah nomor 71 Tahun 2010 tentang Pernyataan Standar Akuntansi Pemerintahan (2010). Indonesia.
Republik Indonesia. Undang-Undang nomor 25 Tahun 2007 tentang Penanaman Modal (2007). Indonesia.
Republik Indonesia. Undang-Undang nomor 32 Tahun 2004 tentang Perimbangan Keuangan antara Pemerintah dan Pemerintah Daerah (2004). Indonesia.
Sanusi, A. (2016). Metodelogi Penelitian
Bisnis. Jakarta: Salemba Empat.
Sari. (2013). Analisis Variabel-Variabel yang Mempengaruhi Pendapatan Asli Daerah Provinsi Bali. Jurnal Ekonomi Pembangunan
Universitas Udayana. Vol.3. No. 11.
Sugiyono. (2016). Metode Penelitian Kuantitatif, Kualitatif, dan R&D. Bandung: Alfabeta, CV.
Sukirno, Sadono. (2014). Makro Ekonomi, Teori Pengantar Edisi 3. Jakarta: Rajawali Press.
Winarno, W. W. (2015). Analisis Ekonometrika dan Statistika
dengan Eviews Edisi 4.
Yogyakarta: UPP STIM YKPN.
Winarno, W. W. (2015). Analisis Ekonometrika dan Statistika dengan Eviews Edisi 4. Yogyakarta: UPP STIM YKPN.
Wulandari, Dinda. (2019). “Pemprov Sumsel Optimalkan PAD dari Kontribusi BUMD”. Retrieved on 21 Februari 2021 from https://sumatra.bisnis.com/read/201 90510/533/921072/pemprov-sumsel-optimalkan-pad-dari-kontribusi-bumd.
250
Discussion and feedback