Corruption, Road Infrastructure Quality and Income Inequality
on
pISSN : 2301 – 8968
JEKT ♦ 15 [1] : 163-177
eISSN : 2303 – 0186
Corruption, Road Infrastructure Quality and Income Inequality
Shinta Wijayanti, Khoirunurrofik
ABSTRAK
Studi ini bertujuan untuk melihat hubungan dari kasus korupsi yang terjadi pada infrastruktur jalan terhadap kualitas infrastruktur jalan serta hubungannya terhadap ketimpangan pendapatan di Indonesia. Dengan menggunakan data riil kasus korupsi infrastruktur jalan yang telah inkrah di pengadilan dan model estimasi panel data fixed-effect dengan standard error yang di-cluster berdasarkan wilayah pulau di Indonesia, hasil studi menunjukkan adanya korelasi negatif yang signifikan antara kasus korupsi infrastruktur jalan dengan kualitas infrastruktur jalan. Studi ini juga menemukan adanya korelasi positif yang signifikan antara kasus korupsi infrastruktur jalan dengan ketimpangan pendapatan yang dimoderasi dengan pertumbuhan ekonomi. Hal ini mengindikasikan bahwa semakin banyak kasus korupsi yang terjadi di suatu wilayah, akan semakin menurunkan kualitas infrastruktur jalan dan meningkatkan ketimpangan pendapatan yang diukur melalui indeks gini (gini ratio).
Kata Kunci: Korupsi (K420), Kualitas Infrastruktur Jalan, Ketimpangan Pendapatan
Corruption, Road Infrastructure Quality and Income Inequality
ABSTRACT
This study investigates the relationship between the corruption cases in road infrastructure and the quality of road infrastructure and its effect on income inequality in Indonesia. Using actual data on cases of road infrastructure corruption that have been in court and a fixed-effect data panel estimation model with standard errors clustered by island regions in Indonesia, this study shows a significant negative correlation between road infrastructure corruption cases and road infrastructure quality. This study also found a significant positive correlation between cases of road infrastructure corruption and income inequality moderated by economic growth. The finding indicates that the more corruption cases occur in an area, the lower the quality of road infrastructure and the increasing income inequality as measured by the Gini index (gini ratio). Keywords: Road Infrastructure Corruption, Road Infrastructure Quality, Income Inequality
INTRODUCTION
Road infrastructure is one of the most vulnerable areas for corruption (Kyriacou et. al: 2015). This happens because in the implementation of road infrastructure projects, it takes a lot of official authorization and encourages the practice of rent seeking , where groups of entrepreneurs want special rights from the government for the provision of goods and services within the government, but this is done through lobbying and bribery practices. A study conducted by Olken (2006) in Indonesia found evidence that where government officials are responsible for road projects, the risk of corruption increases.
This study aims to determine the relationship of corruption that occurs in road infrastructure to the quality of road infrastructure and income inequality. The indicator used to measure the quality of road infrastructure is the level of road stability, while income inequality uses the Gini Ratio variable. Thus, the formulation of the problems in this study are: (1) Is road infrastructure corruption negatively correlated with the level of road stability?; and (2) Is road infrastructure corruption significantly positive correlation to income inequality?.
Chen, et. al (2020) in his study of how public corruption affects the quality of road infrastructure in the USA found that corruption results in inefficiency and misallocation of resources and ultimately reduces the quality of road infrastructure. In
addition, the relationship of corruption to the quality of road infrastructure is also not felt directly, but requires a lagtime. This happens because the construction of road infrastructure generally takes a long time so that the benefits can only be felt after more than one year of construction.
Widespread corruption can also have an impact on economic inequality. Gyimah-Brempong (2002) who conducted a study of 21 African countries during 1993-1999 found that an increase in corruption would reduce the growth rate of GDP and per capita income. The study also found that the higher the level of corruption, the higher the level of government consumption, but on the contrary the per capita growth rate slowed. The slowdown is linked to Africa's high income inequality.
Istiqamah, et. al. (2018) which examines the relationship of economic growth to income inequality and poverty in 34 provinces in Indonesia during 20102016 found a significant positive relationship between economic growth and income inequality. This means that despite economic growth, the Gini ratio continues to increase. Furthermore, Simon Kuznets (1955) stated that income distribution tends to deteriorate in the early stages of economic growth, but in later stages it will improve. This theory is often referred to as the “ inverted U” Kuznets curve because of the longitudinal change in income distribution.
Most studies related to corruption
so far still use corruption with the results of a general perception survey through the IPK (Corruption Perception Index) as an independent variable (Olken and Pande, 2012; Varvarigos and Arsenis, 2015). This proxy has weaknesses, including (1) perception may have a weak correlation with reality and has a significant bias because it is influenced by the subjectivity of respondents who have various backgrounds and motivations; and (2) CPI is a very general indicator and does not refer specifically to one sector, such as infrastructure (Kenny: 2009a).
Chen et. al (2020) have used corruption data in real terms as the key independent variable1. However, due to data limitations, this study does not separate the corruption of road infrastructure from others.
For this reason, this study tries to contribute to previous research, especially the deepening of the road infrastructure corruption proxy used. First, the data on road infrastructure corruption in this study was obtained from the Supreme Court (MA), which is the highest judicial institution in the constitutional system in Indonesia. With these data, the researcher believes that corruption cases that have been signed have permanent legal force so that they are most worthy of being the object of research. Second, to obtain the most relevant data, further screening and analysis was carried out on each court decision document, in particular to determine the type of infrastructure that was corrupted, the locus and corruption incident. This in-depth analysis of road infrastructure corruption data is what distinguishes it from previous research.
RESEARCH METHODS
Corruption in this study is taken from the definition of the Corruption Act2 which is used as the legal basis for decisions in court for all corruption cases involving public officials. Meanwhile, the definition of road infrastructure in Indonesia is regulated in the Road Law3 where the road infrastructure is divided into: 1) National Roads (2) Provincial Roads; (3) Regency Roads; and (4) City Roads which are the responsibility of each level of government in accordance with their respective authorities.
All data in this study are secondary and the estimation of panel data is carried out using the static panel regression method with a fixed effect model and processed using statics. Application of standard errors that are clustered based on six island regions in Indonesia (Sumatra, Java, Kalimantan, Sulawesi, Bali and Nusa Tenggara, as well as Papua and Maluku) is carried out because unobserved variables have the potential to be correlated between regions on the same island so that standard error estimates are
used that are clustered with islands.
The model specifications in this study adopt the research of Chen, at.al (2020) for
❖ PDBit =β0 + β1kasus_korupsiit +
β2 Investasiit +εit ..(regresi 1)
❖ Gini ratioit = β0 + β1PDB it +
β1kemiskinanit + εit ..(regresi 2)
the relationship of road infrastructure
corruption to the quality and quantity of
Illustration of the relationship of
roads. Meanwhile, the relationship between
several variables in Model 1 to the
road infrastructure corruption and income
inequality adopts the research model of Sutijah, et. al (2020), Gorondutse, et.al (2014), with the following equation.
Model 1: Correlation between road infrastructure corruption and road quality
Kualitas jalanit
= β0 + Lag β1kasusk0rupsiit
quality and quantity of roads as follows:
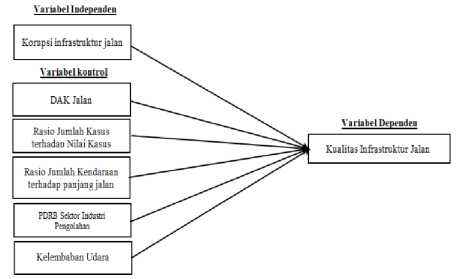
+ Lag β2DAKit
+ Lag β3nilai kasusit
+ β4PDB industriit
+ β5kendaraanit + β6kelembabanit + εit
The time lag of one year refers to Chen, et. al (2020).
Model 2: Correlation between road infrastructure corruption and income inequality
While the illustration of the relationship between road infrastructure corruption and income inequality in Model 2 is as follows:
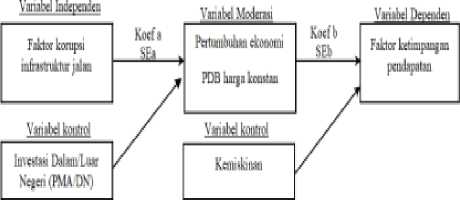
In this second model, there is an indirect
relationship from cases of road infrastructure corruption to inequality. income will be measured by the Sobel
Test4 with economic growth as the moderating variable. The Sobel test formula is as follows.
ab z = ^==^= √(b2SEa2) + (a2SEb2)
a = regression coefficient of independent variable to mediating variable
b = regression coefficient of mediating variable to dependent variable
SEa = Standard error of estimation of the relationship of the independent variable to the mediating variable
SEb = Standard error of estimation of the relationship of the mediating variable to the dependent variable
Z value which produces a number above 1.96 with a significance level of 5% will indicate that economic growth is proxied by GDP at constant prices able to mediate the relationship of infrastructure corruption cases
RESULTS AND DISCUSSION
This study uses data on corruption cases during 2015-2020 which was obtained
from the Supreme Court's website in the form of court decision documents. Since the Supreme Court's website does not provide specific information related to road infrastructure corruption, further analysis is carried out to obtain only related cases. Then, an analysis of the document is carried out to identify locus, tempus, and case values.
For the road stability variable (ratio of steady road length to total road length) obtained from the Ministry of PUPR, GDP per capita variable price constant and Gini Ratio obtained from BPS. In addition, control variables were also included in the two research models in accordance with previous studies, including:
-
a. Ratio of Number of Cases to Value of Road Infrastructure Corruption Cases (Case value), with data sourced
from the Supreme Court. The value of the case can be in the form of the value of state losses or the value of bribes.
-
b. The ratio of the Special Allocation Fund for Road Infrastructure to the length of the road (DAK Ratio), with data
sourced from the Directorate General of Fiscal Balance, Ministry of Finance of the Republic of Indonesia.
-
c. Ratio of vehicles to the length of the road (vehicles), with data sourced from the Central Statistics Agency.
-
f. Investment (PMA and PMDN Investment), with data from the Central Statistics Agency.
-
g. Poverty, with data sourced from the Central Statistics Agency.
Descriptive Analysis
In this study, there are 198 observation units from 33 provinces5 with a span of 6 years, namely 2015 to 2020.
From the descriptive analysis, it can be seen . Processing Industry Product Sector GDP (industrial GDP), with data sourced from the Central Statistics Agency.
-
e. Air Humidity, with data sourced from the Central Statistics Agency.
that the number of corruption cases has the smallest value of 0, this means that not all provinces in one year had cases of road infrastructure corruption. This may be because there are still corruption cases
that have not been decided at the time the data is collected where the court process until the decision can take more than one year. As for the case value which has a value of 0 because not all court decisions include the value of losses and the value of bribes.
The quality of the road which is proxied by the level of road stability has an average value of 60.78 and is closer to the maximum of 86.03. This means that the level of road stability is homogeneous and generally does not differ much from one province to another. Homogeneous data also occurs in the variable GDP per capita constant prices and the Gini Ratio which has an average value that is close to its maximum value and is above the standard deviation value, which means that there is no big difference between provinces for the two variables.
Regression Test Results
To control for shocks that occur during the year of observation, in model 1, added time-specific effect in the form of a fixed effect from the year (Year FE).
From these additions, it was found that the R-squared decreased from 20.14% to 19.43% so that this reduced the variation explained by the independent variables in the model and did not have a significant value indicating the effect of road corruption on road quality did not change over time.
In addition, the addition of the year effect causes a change in the direction of the main independent variable. So in this study, the model used for drawing conclusions still uses regression without the year effect.
Furthermore, the test results to see the correlation between the residual variable and the main independent variable to see the existence of endogeneity and the results obtained that the main independent variable has no correlation with the residual, and vice versa. The absence of this correlation indicates that in this research model there is no endogeneity.
The results of the regression of each model are as follows.
Model 1
The results of the regression test show that road corruption cases have a negative and significant correlation with road quality. Furthermore, both in the absence of control variables until all five control variables were included, the correlation of road corruption cases to road quality still showed consistently significant negative results, namely in the range of values 0.18%-0.31% at a significance level of 5%.
Meanwhile, all independent variables in the model have an effect of 20.14% on road quality, while the rest are influenced by other variables outside the study. These results can be said to have supported the hypothesis (H1) of this study, namely that road infrastructure corruption has a significant negative relationship with road quality. The results of the regression and the use lag are in harmony with the results of research conducted by Chen, et.al (2020) which found that corruption
resulted in a decrease in road quality and the effects of The corruption can only be felt and significant as soon as a year after the corruption case occurs because road construction is a project that is generally completed more than one year.
In the 6th test, when all variables are included in the regression model, in addition to the main independent
indicating that there is an impact on the loss of the cost of spending on corrupted road infrastructure on road quality degradation. This result is in line with the research conducted by Olken (2006) which also uses the impact of the loss of the cost of spending on corrupted road infrastructure on road quality degradation.
Tabel 2. Hasil Regresi Model 1
|
Dependent variable |
: Kualitas_jalan | |||||
|
Independent Variable |
1 |
2 |
3 |
4 |
5 |
6 |
|
L.Kasus_korupsi - |
0.3175937** (0.0826757) |
-0.265132** (0.0836618) |
-0.2761133** (0.0802438) |
-0.1777126** (0.0678248) |
-0.1815233** (0.0525695) |
-0.1811584** (0.0523905) |
|
PDB_industri (jt) |
30.91*** (5.940) |
40.39879*** (6.547484) |
37.8943*** (6.642344) |
37.70951*** (6.653143) |
37.77984*** (6.560722) | |
|
kendaraan |
-0.0000681*** (0.0000124) |
-0.0000708*** (0.0000119) |
- 0.0000706*** (0.000012) |
-0.0000707*** (0.0000119) | ||
|
L.nilai_kasus |
-8616074** (3026426) |
-8657219** (3005006) |
-8631252** (3009906) | |||
|
L.DAK(jt) |
0.0029642 (0.0228309) |
0.0031747 (0.0230816) | ||||
|
Kelembaban |
-0.0280317 (0.086351) | |||||
|
Constant |
61.13192 0.0901917 |
58.2283 0.5296069 |
57.58487 0.5653038 |
58.11229 0.4923971 |
58.01717 0.9611225 |
60.27546 7.505947 |
|
Observasi R-squared Number of ID |
165 0.0171 33 |
165 0.205 33 |
165 0.1954 33 |
165 0.2015 33 |
165 0.2008 33 |
165 0.2014 33 |
|
Robust standard error in parentheses Sumber: hasil olah data |
***p<0.01, ** |
p<0.05, *p<0.1 | ||||
variables, there are several control variables that have a significant relationship with road quality, including:
-
a. The case value is negatively and significantly correlated with road quality,
-
b. Processed industry GDP6 has a positive and significant correlation with road quality. According to resource dependence theory, it explains that countries with high GDP have a higher
level of economic prosperity, so of course the resources they have to use to maintain the quality of transportation infrastructure are also greater (Chen, et.al, 2020).
-
c. The ratio of vehicles has a significant correlation with the negative direction, this shows the relationship that the higher the value of the ratio of vehicles and the length of the road means that the more vehicles that pass through the road, the lower the quality of the road.
-
d. The ratio of DAK to road length has a positive correlation although it is not significant, in this case it means that the DAK road budget has an influence on road quality but not significant This finding is in line with the research conducted by Saragih and Khoirunurrofik (2022) with the same results.
-
e. Air humidity variable as a proxy representing environmental factors has a
negative and insignificant correlation with road quality.
Model 2:
From the results of the first regression test (table 3), it is known that road corruption cases have a negative and significant correlation to economic growth, so that if corruption cases increase, this will have an impact on a decrease in economic growth. These results are in line with research
conducted by Gupta, et. al (1998) and Gyimah-Brempong (2002).
Meanwhile, investment has a positive and significant correlation with economic growth, so if investment increases it will have an impact on increasing economic growth, and this result is in line with the theory proposed by Todaro (2003).
Meanwhile, from the results of the
Tabel 3. Hasil Regresi Model 2 (PDB Konstan)
|
Dependent variabel : PDB | ||
|
-1 |
-2 | |
|
Kasus_Korupsi |
-337.3752*** |
-266.1362** |
|
(74.02682) |
(70.5155) | |
|
Investasi |
0.1250816** | |
|
(0.0441849) | ||
|
Constant |
37528.12 |
36382.03 |
|
68.04486 |
324.4269 | |
|
Observasi |
198 |
198 |
|
R-squared |
0.0066 |
0.0244 |
|
Number of ID |
33 |
33 |
|
Robust standard error in parentheses |
***p<0.01, **p<0.05, |
*p<0.1 |
Sumber: Olah data
second regression test (Table 4), it can be seen that economic growth is negatively and significantly correlated with the Gini ratio, where if economic growth increases, it will have an impact on decreasing income inequality. processing These findings are not in line with research by Istiqamah, et. al (2018) who found a positive relationship between growth and
shows a tendency to be consistent with Simon Kuznets' theory (1955) where in an inverted U-curve, in the long term economic growth will actually improve income inequality.
This means, after a period of research conducted by Istiqamah, et. al (2018), where after the initial stage of economic growth in Indonesia, economic growth
income inequality in 34 Indonesian provinces during 2010-2016. However, the results of this study are in fact
. Meanwhile, poverty has a positive and significant correlation to the Gini ratio, this shows that if the number of poverty increases, it will give a relationship to the Gini ratio increase. These results are in line with
will have an inverse relationship with the Gini ratio.
with research conducted by Hassan et. At, (2015) which states that poverty has a positive and significant relationship to income inequality.
Sobel Test
From the results of the Sobel test
Tabel 4. Hasil Regresi Model 2 (Gini Rasio) Dependent variabel : PDB
|
-1 |
-2 | |
|
Kasus_Korupsi |
-337.3752*** |
-266.1362** |
|
(74.02682) |
(70.5155) | |
|
Investasi |
0.1250816** (0.0441849) | |
|
Constant |
37528.12 |
36382.03 |
|
68.04486 |
324.4269 | |
|
Observasi |
198 |
198 |
|
R-squared |
0.0066 |
0.0244 |
|
Number of ID |
33 |
33 |
Robust standard error in parentheses ***p<0.01, **p<0.05, *p<0.1 Sumber: Olah data
calculation for the first and second regressions in model 2, the z value is 2.63. Because the z value obtained is 2.63> 1.96 with a significance level of
5%, it proves that economic growth as proxied by GDP is able to mediate the relationship between road infrastructure corruption cases and income inequality (gini ratio), so it can be said indirectly that road infrastructure corruption cases are related to significant positive on income inequality
ab
z = f „ „
√(b2SEα2) + (α2SEb2)
-266.1362 x -0.00000206
√(-0.000002062 x 72.715452) + (-266.13622 x 0.0000005592)
= 2.63 variable, namely road corruption cases by
The results of this calculation can be said gradually including the independent to have supported the H2 of this study, variables and control variables. From the
namely corruption cases have a significant positive relationship with income inequality through moderating economic growth. These results are also in line with the research of Gupta et al. (1998) and Gyimah-Brempong (2002) who found a significant positive relationship between corruption and income inequality.
Although these studies did not perform the Sobel for the moderating variable of economic growth/growth, the study by Gyimah
Brempong (2002) also conducted a separate test between corruption and economic growth and found a significant negative relationship as in the results of the first test of Model 2.
Robustness Test
To ensure that the results of this study are strong, robustness checks were carried out by regressing the dependent variable,
namely road quality and the independent
regression, it was found that when the independent variables and control variables were entered one by one in the regression test, the effect of these variables on the dependent variable showed the direction results were still consistent and the significance value was the same, thus indicating the robustness of the model.
CONCLUSION
During 2015 to 2020, the results of research in model 1 show that cases of road infrastructure corruption have a negative and positive correlation. significant impact on road quality. This
has a
road correlation. In addition, the case value and the ratio
number of vehicles to the length of the road have a negative and significant correlation with the quality of the road. This means that these variables
Tabel 5. Hasil
Robustness Test
|
(1) |
(2) |
(3) |
(4) |
(5) |
(6) | |
|
Kualitas_jalan |
Kualitas_jalan |
Kualitas_jalan |
Kualitas_jalan |
Kualitas_jalan |
Kualitas_jalan | |
|
L.Kasus_korupsi |
-0.318* |
-0.265* |
-0.276* |
-0.178* |
-0.182* |
-0.181* |
|
(-3.84) |
(-3.17) |
(-3.44) |
(-2.62) |
(-3.45) |
(-3.46) | |
|
PDB_industri |
0.0000309** |
0.0000404** |
0.0000379** |
0.0000377** |
0.0000378** | |
|
(-5.2) |
(-6.17) |
(-5.7) |
(-5.67) |
(-5.76) | ||
|
Kendaraan |
-0.0000681** |
-0.0000708** |
-0.0000706** |
-0.0000707** | ||
|
(-5.48) |
(-5.93) |
(-5.86) |
(-5.93) | |||
|
L.nilai_kasus |
-8.616* |
-8.657* |
-8.631* | |||
|
(-2.85) |
(-2.88) |
(-2.87) | ||||
|
L.DAK |
0.00296 |
0.00317 | ||||
|
(-0.13) |
(-0.14) | |||||
|
Kelembaban |
-0.028 | |||||
|
(-0.32) | ||||||
|
_cons |
61.13*** |
58.23*** |
57.58*** |
58.11*** |
58.02*** |
60.28*** |
|
-677.8 |
-109.95 |
-101.87 |
-118.02 |
-60.36 |
-8.03 | |
|
N |
165 |
165 |
165 |
165 |
165 |
165 |
t statistics in parentheses
* p<0.05, **p<0.01, ***P<0.001
Sumber: hasil olah data
can be interpreted that the number of corruption cases that occur in an area will reduce the quality of roads, where the effect on the quality of corruption is only felt one year later. As for other variables that are considered to be
related to road quality, among others, the GDP of the processing industry which
contribute to improving or reducing road quality. Meanwhile, the DAK ratio variable has a positive correlation and air humidity has a negative but not significant correlation with road quality.
Meanwhile, in model 2 the corruption case of road infrastructure also has a
negative and significant correlation to economic growth as
a mediating variable, as well as the economic growth variable also has a negative and significant correlation to income inequality. From the results of the Sobel test , it shows that the variable of economic growth is able to be the most suitable mediation for the relationship between the variable of road infrastructure corruption and the variable of income inequality. This means that if the number of corruption cases in road infrastructure decreases, income inequality (gini index) will also decrease through an increase in economic growth, and vice versa.
Although this study has used real data on corruption cases, there are limitations, namely the selection of data on road infrastructure corruption cases is done manually through an analysis process conducted by the researchers themselves on all corruption data, because the Supreme Court does not provide specific corruption data related to road infrastructure. In addition, there is a
possibility that there will be differences in the number of cases of infrastructure corruption in the MA data if
downloaded at a later time even though using the same method and time period, because there are cases that have not been decided until the time of data collection in this study. Meanwhile, the selection of the unit of analysis was only carried out at the provincial level, not detailed per district/city because the data for the dependent variable (total length of roads and road stability) and independent variables other than cases of road infrastructure corruption were only available in accumulated values per province.
From this study, there are implications, namely the finding of a relationship between road infrastructure corruption cases with road quality and income inequality, the government needs to strengthen supervision and audits from both internal parties and independent auditors on road infrastructure projects, considering that road infrastructure projects are a government budget
priority. In addition, it is also necessary to involve the role of the community and NGO institutions to take part in overseeing the planning
and implementation of the road infrastructure project budget. And in an effort to reduce income inequality, it is necessary to increase accessibility between regions by building road infrastructure in a sustainable manner.
REFERENCES
Chen, C., Liu, C., & Lee, J (2020).
“Corruption and The Quality of Transportation Infrastructure:
Evidence From The US State”. International Review of
Administrative Sciences.
Gorondutse, A.H & Hilman, H., (2014). Mediation effect of customer
satisfaction on the relationships between service quality and
customer loyalty in the Nigerian foods and beverages industry: Sobel test approach, International Journal of Management Science and
Engineering Management, 9:1, 1-8
Gupta, S., Davoodi, H., Alonso-Terme, R. (1998) Does Corruption Affect Income Inequality and Poverty?. IMF Working Paper No. WP/98/76.
Gyimah-Brempong, Kwabena (2002). “Corruption, Economic Growth, and Income Inequality”. Article in Economics of Governance.
Hassan, S. A., Zaman, K., & Gul, S. (2015). The Relationship between GrowthInequalityPoverty Triangle and Environmental Degradation:
Unveiling the Reality. Arab Economic and Business Journal, 10(1), 57–71.
Istiqamah, et. al (2018). Pengaruh pertumbuhan ekonomi terhadap ketimpangan pendapatan dan kemiskinan (studi provinsi-provinsi di Indonesia. E-Jurnal Perspektif Ekonomi dan Pembangunan Daerah Vol.7 No. 3, September- Desember 2018.
Kenny, C (2009a). Measuring corruption in infrastructure: Evidence from
transition and developing countries. The Journal of Development Studies 45(3): 314–332.
Kuznets, Simon. (1995). “Economic Growth and Income Inequality”. American Economic Review.
Kyriacou AP, Muinelo-Gallo L and Roca-Sagales O (2015). Construction corrupts: Empirical evidence from a panel of 42 countries. Public Choice 165(1/2): 123–145.
Olken, B.A., (2006). Corruption and The Cost of Redistribution: Micro
Evidence from Indonesia. Journal of Public Economics, 90:853-870.
Saragih, P.N dan Khoirunurrofik, K.,
(2022). Road quality in Indonesia: Is It Linked to Special Allocation
Funds and Political Competition?, Jurnal Ilmu Ekonomi Volume 11 (1), 2022: 57 - 72
Sobel, Michael. E (1982). “Asymtotic Confidence Intervals for Indirect
Effects in Structural Equation Models”. Sociological Methodology, 13. 290-312
Sutijah, Sucihatiningsih, D.W.P, Muhsin (2020). Determinant of Fisherman’s Income in Kedung Subdistrict Jepara Regency. Journal of Economic Education.
Todaro, Michael, P. dan Stephen C. Smith. (2003). Pembangunan Ekonomi di Dunia Ketiga, edisi kedelapan. Jakarta : Erlangga.
Undang-Undang Nomor 31 Tahun 1999 tentang Pemberantasan Tindak Pidana Korupsi.
Undang-Undang Nomor 38 Tahun 2004 tentang Jalan.
Varvarigos, D., and Arsenis, P., (2015).
Corruption, Fertility, and Human Capital. Journal of Economic Behavior and Organization, 109:145162.
177
Discussion and feedback