PRICE TRANSMISSION IN THE INDONESIAN RED CHILI MARKET STATIC AND DYNAMIC MODELS
on
pISSN : 2301 – 8968
JEKT ♦ 15 [1] : 217-224
eISSN : 2303 – 0186
PRICE TRANSMISSION IN THE INDONESIAN RED CHILI MARKET STATIC AND DYNAMIC MODELS
Rasidin Karo Karo Sitepu, Inti Pertiwi Nashwar, Veralianta Br Sebayang
ABSTRAK
Permasalahan yang sering muncul pada komoditas pertanian adalah transmisi perubahan harga di tingkat konsumen dan tingkat produsen. Penelitian ini bertujuan untuk menguji secara empiris transmisi harga cabai merah menggunakan model statis dan dinamis. Data yang digunakan adalah series mingguan dari tanggal 1 Januari 2017 sampai dengan 21 November 2020. Hasil penelitian menunjukkan bahwa transmisi harga cabai merah bersifat simetris. Kenaikan dan penurunan harga eceran cabai merah akan diikuti oleh kenaikan dan penurunan harga produsen cabai merah. Pasar cabai merah merupakan pasar yang kompetitif, intervensi pemerintah tidak diperlukan untuk mengendalikan harga, tetapi harus selalu diawasi agar mekanisme pasar berjalan dengan sempurna. Penyusunan neraca pangan, proyeksi produksi dan permintaan cabai merah, perbaikan infrastruktur saluran distribusi dan sistem informasi harga merupakan strategi dalam mengantisipasi fluktuasi harga dan kegagalan mekanisme pasar.
Kata kunci: Simetris, Transmisi Harga, Dinamik, Statik Model
JEL Classification: C120, D490, Q120, Q130
ABSTRACT
The problem that often arises in agricultural commodities is the transmission of price changes at the consumer level and at the producer level. This study aims to empirically test the transmission of red chili prices using static and dynamic models. The data used is a weekly series from January 1, 2017, to November 21, 2020. The results show that the red chili price transmission is symmetrical, where price transmission between consumers - producers is perfect. The increase and decrease in the retail price of red chili will be followed by an increase and decrease in the producer price of red chili. The red chili market is a competitive market, so government intervention is not needed to control prices, but must always be monitored to maintain a perfect market mechanism. Preparation of the food balance, projections of production and demand for red chili, improvement of distribution channel infrastructure and price information systems are strategies to anticipate price fluctuations and failure of market mechanisms.
Keywords: Price Transmission, Symmetric, Static, Dynamic Model
JEL Classification: C120, D490, Q120, Q130
Introduction
Horticultural commodities are often faced with the problem of price fluctuations, which occur due to market equilibrium conditions. The fluctuation of horticultural commodity prices is also influenced by the 217
increase in demand at certain times, such as on national holidays. Neo-classical economists believe that prices are the main indicator that reflects the level of market efficiency (Meyer and von Cramon-Taubadel, 2004). Furthermore, it is stated that price transmission and market integration can be used as an indication of the
efficiency formed between two interacting markets, both vertically and spatially (Meyer and von Cramon-Taubadel, 2002).
Two markets are efficiently integrated, if price changes from one market are transmitted perfectly to another. The concept of a competitive market can be used as a basis for assessing the process of price transmission and integration between two markets. According to Conforti (2004), price transmission will be perfect if there is no market friction and distortion.
Theoretically, price asymmetry can occur in imperfect competitive markets. According to Henderson and Quant (1980), imperfect information is caused by lags of information and degree of market concentration. The absence of price transmission between markets will lead to inefficiency in resource allocation and will reduce economic welfare. If the price transmission is perfect, then a running market is efficient which can increase economic welfare. The indicators of economic welfare are producer surplus and consumer surplus.
Spatial market integration shows how much changes in product prices in one market affect changes in prices for similar products in other markets. For example, if there is market integration between two provinces, changes in the price of Red Chili in one province will be followed by changes in the price of Red Chili in another province. Spatial integration occurs when price changes in a market are reflected by changes in prices in geographically different markets for the same product, whereas vertical integration is price changes in a market reflected by changes in prices in vertically different markets for the same product (in a geographic area). Vertical integration is closely related to the concept of margin in marketing, for example the margin of producer-consumer or producer-retailer (Trotter, 1992).
Nuraeni (2015) shows that for the Red Onion commodity, producer prices and consumer prices are integrated in the long term, but not integrated in the short term.
Integration of prices at retail traders with producer prices (at the farm level) also occurs, which shows that changes in the price of shallots at the retailer level are passed on to farmers, so that farmers benefit from price increases that occur at the consumer level. According to Erviana et al. (2020) the transmission of Red Chili prices in West Java Province between producers, wholesalers and consumers is symmetrical. Changes in prices in the wholesale market are immediately transmitted to the consumer level in the same direction. This reason explains that the Red Chili market in West Java Province is efficient. The same research results were also shown by Sukmawati (2015), the price of Red Chili in the Caringin Central Market is transmitted perfectly to the Gedebage Central Market.
Research Methods
The model developed by Houck (1977) became an aspiration in writing this article to examine whether the price change in the red chili market is perfect between consumers and producers. Other analysts notably include Heytens (1986); Kinnucan and Forker (1987); Bailey and Brorsen (1989); Zhang et al. (1995); Mohanty et al. (1995); Willett et al. (1997); Peltzman (2000); Aguiar (2002); and Ganneval (2016) follow suit. In the model Houck (1977) assumes that the variable y depends on the value of the variable x and both are time series variables. The hypothesis to be tested is that a one-unit increase in the retail price of red chili (x) from period to period has a different absolute impact on the producer Red Chili price (y) compared to a decrease of one unit in x. This relationship is written into equation (1) with the assumption that changes in the variable y (producer price of Red Chili) are a function of the retail price of Red Chili.
∆yt = «o + aix’t + aι×t (1)
Dimana t = 1,2,3, ... n. ∆yt =yt — yt-1; xt = xt — xt-1 if xt > xt-1 and other 0; xf = xt — xt-1 if xt < xt-1 and other 0
In principle, the non-reversibility test carried out by Houck (1977) is to test the identity of the estimation parameter αι = α2. Equation (1) can be modified into equation (2) as follows:
yt = «0t + «1 Rt+ «2 ^t (2)
Where yt = yt — y0; Rt = ∑xt and Rt = ∑xt∙ Rt the sum of the increase in variable x over time from its initial value to the end of period t, the same thing as Dt is the sum of all decreases in variable x. The value of the variable Rtt is always positive and Dt is always negative. Houck (1977) tested whether α1 = α2 to reject the non-reversibility hypothesis.
Asymmetric price transmission using Houck's static model has been widely used in several literatures. However, one of the most basic criticisms of this model is that it does not consider time-consuming price changes. Ward (1982) and Acquah and Onumah (2011), have developed the Houck (1977) model by including time variables and even more than one time variable. Acquah and Onumah (2011) in their article concluded that static and dynamic models with the same test method for price asymmetry can provide different conclusions for the same data and market.
Price transmission can be defined as the price relationship between two related markets. This principle refers to the law of one price (LOP), which states that the difference between the two prices in spatially separated markets does not exceed the cost of 218
transporting from one market to another (Ghoshray, 2011). The difference in price for the same product at different locations spatially is no more than the cost of transportation (Mengel and von Cramon-Taubadel, 2014)
Asymmetric price transmission occurs if the response to changes in prices is not the same when prices rise and prices fall. According to Delpachitra and Hill (1994), the law of one price does not apply in the short run, because in the short-term price transmission does not occur, while in the long run the results are varied and different. According to Meyer & von Cramon-Taubadel (2004) the condition of asymmetric price transmission can be seen from the speed of time and the amount of price adjustment. To test the price transmission in price, this research will use the Static model specification from Houck (1977), as written in equation (3) below:
∆Pp,t = β0 + β+∆P÷ + β-∆P- + εt (3)
The Asymmetry hypothesis in static model was tasted by determining whether the coefficients (β÷ and β1-) were identical (that is, H0: β÷ = β-). However, this study will also use a dynamic model as has been done by several previous researchers. The dynamic model referred to in this study follows the model specifications developed by Acquah and Onumah (2011), as follows:
∆Pp,t =β0+ β1 ∆P+t + β-∆Pε~t + β2∆P⅛-ι +
(4)
β- ∆P-t-ι + Zt
where ∆P is the change in the producer price of Red Chili, ∆PP is the change in the increase in the retail price of Red Chili, and ∆PN is the change in the decrease in the retail price of Red Chili. Equation (5) is the development of the Houck Dynamic model by adding information and selecting a number of lag variables for the increase and decrease in retail price of Red Chili. Testing the asymmetry hypothesis in the static model is to determine whether the coefficients β÷ and β- are identical (i.e. H0: β÷ = β- (equation 3). Formally testing the asymmetric hypothesis using the dynamic Houck model (equation 4) is H0: β÷ = β1-and β÷ = β-. Houck's approach is not suitable for data with co-integration cases, but that does not mean that asymmetric price transmission cannot be tested (von Cramon-Taubadel, 1999). The estimation results of equation (4) depend on the level of significance (β÷ -β1-) and the stationarity of the error term (εt), where:
If (β÷-β-)≠0
If (β÷-β-) = 0
If (β÷-β-)≠0
If (β÷-β-) = 0
(asymmetry) and εt is I(0) (symmetry) and εt is I(1) (asymmetry) and εt is I(1), (symmetry) and εt is I(0)
Symmetry is acceptable in stationary data and there is no significant difference between the parameters β÷ and β-. To avoid the problem of spurious regression and to test stationary time series data, the unit root test is used, with the Augmented Dickey-Fuller (1979) test statistics, as follows:
∆y = γ + 5t + pyt-ι + ∑‰ι Φj∆yt-ι + et (5)
where Δy = y - yt-1 and ρ = α - 1. The hypothesis used is H0: ρ = 0 (unit root); H1 = ρ < 0 (does not contain the unit root). At the 5% alpha level, H1 is accepted if the ADF statistic is greater than the critical value at the time a (5%), or p value is greater than the significance value a. Accepting H1 or rejecting H0 means the data is stationary. The estimation technique for equation (3) and equation (4) uses the ordinary least squares method and data processing uses SAS software version 9.4. The procedure used is VARMAX by using the TEST option to determine the similarity of the results of the parameters β÷ = β- and β÷ = β-, while to produce the Augmented Dickey-Fuller (ADF) test the DFTEST option is used.
The data used is the weekly time series from January 2007 - November 2020. The price data used is the weekly average price at the producer and consumer levels in the Red Chili production center areas. Selection of weekly average prices due to statistical technical considerations to overcome the problem of degree of freedom. The total number of observations is 205 observations, sourced from the Food Security Agency, Ministry of Agriculture.
Results and Discussion
The development of red chili prices at the producer level is shown in Figure 1. In January 2017 the price of red chili was Rp.42,000 / kg and tended to decrease until the third week of March 2019.
The price of red chili was IDR 68,380 / kg in August 2019, which was the highest price during the period January 2017 to December 2020. The increase in red chili prices was due to the decrease in the amount of red chili production by 4.11% in June - October. 2019. Meanwhile, the decline in the price of red chili at the producer level was due to an excess supply of red chili. Excess supply occurred because the main harvest was in progress so that the Red Chili supply could not be fully absorbed by the market.
At the start of the Covid-19 pandemic, the price of red chilies at the farm level decreased significantly. This is due to a decrease in demand as traditional markets are closed as a result of the imposition of large-scale social restrictions in several regions in Indonesia. In general, Figure 2 shows that the movement of the retail price of red chili is followed by a
pattern of price movements of red chili producers with a relatively varied magnitude. The variation between the price of red chili at the producer and consumer level (shown in Figure 2 by the vertical distance between the
responsive than lower prices. In other conditions, the price of red chili among farmers has risen considerably and takes a long time to return to equilibrium. This condition is due to decreased red chili production,
solid blue and red lines) in the law of one price is referred to as the cost of transportation. For agricultural products, in general, price increases are often more
which can be caused by weather, plant diseases and plant pests, so it cannot meet the market demand for red chili.
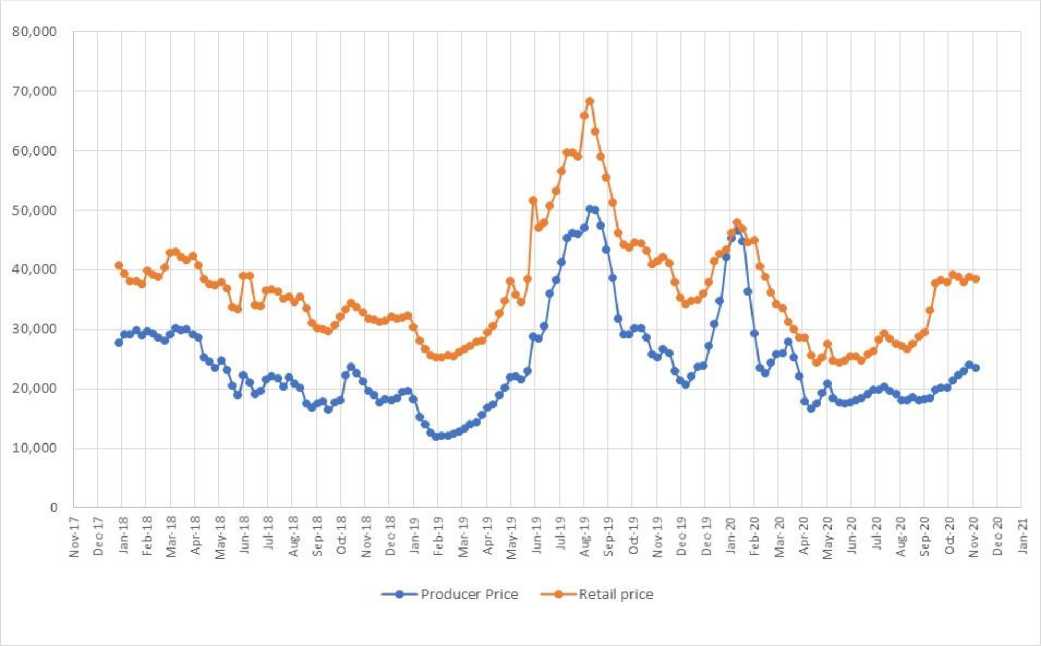
Source : Ministry of Agriculture, 2020.
To see the movement pattern of time series data and see the relationship between variables, a stationary check was carried out on the data series. Stationary test is performed to see the consistency of data series movements and to prevent spurious regression, which is a condition where the regression results of one variable against another variable produces a high R2 value but in fact there is no significant relationship in economic theory. This often occurs when the
time series data shows a characteristic pattern of a trend towards time. In this study, the stationarity test was carried out with the Augmented Dickey-Fuller (ADF) and Phillips-Perron test. If the data is not stationary at the level, then the test will be continued in the first difference condition. The results of the stationary data series test are shown in Table 1.
Table 1. Dickey-Fuller Test Results for Unit Root on Red Chili Prices, 2020
|
Variable |
Type |
Rho |
Pr < Rho |
Tau |
Pr < Tau |
|
y1 |
Zero Mean |
-3.06 |
0.2288 |
-1.40 |
0.1511 |
|
Single Mean |
-25.11 |
0.0028 |
-3.66 |
0.0054 | |
|
Trend |
-25.48 |
0.0188 |
-3.72 |
0.0232 |
Table 1 shows that the null hypothesis about the unit root is accepted at the alpha level of 5%. Data series of red chili prices at the producer level (y1) are not stationary. Time series data for stationary red chili prices in the first
difference (Table 2). The results of the first difference test show that they cannot accept the null hypothesis, so that in the first difference there is no unit root. Time series data of
chili prices are stationary in the first difference denoted as I (1).
Table 2. Dickey-Fuller Test Results for First Difference on Red Chili Prices, 2020
|
Variable |
Type |
Rho |
Pr < Rho |
Tau |
Pr < Tau |
|
y1 |
Zero Mean |
-109.30 |
0.0001 |
-7.48 |
<.0001 |
|
Single Mean |
-109.47 |
0.0001 |
-7.46 |
<.0001 | |
|
Trend |
-109.86 |
0.0001 |
-7.44 |
<.0001 |
An increase or decrease in the retail price of red chili in the Keramatjati wholesale market is the main signal for farmers to make adjustments to the selling price of red chili. If there is a change in the price of red chili at the producer level in production center areas, the price of red chili at the consumer level will also fluctuate. The results of the analysis show that the process of transmission of red chili
prices at the consumer and producer levels for red chili in Indonesia is symmetrical (Table 3). This shows that an increase in the price of red chili at the consumer level will be followed by an increase in the price of red chili at the producer level. Changes in the price of red chili at the retail level will be responded quickly by producers by making adjustments to price changes in the market.
Table 3. Parameter Estimates of the Static Houck Model on Red Chili Prices, 2020
|
Paramete |
Estimate |
Standard Error |
t Value |
Pr > |t| |
Variable |
|
CONST1 |
155.75615 |
169.40304 |
0.92 |
0.3590 |
Intercept |
|
ΔPε+t |
0.48443 |
0.08831 |
5.49 |
0.0001 |
HEPos(t) |
|
ΔPε-,t |
0.74114 |
0.09802 |
7.56 |
0.0001 |
HENeg(t) |
R2 = 0.3929; Dw= 1.392;
Akaike’s information criterion (AIC) = 3227.55; Schwarz Bayesian information criterion (SBC) = 3240.80
Estimated parameters ΔPβt and ΔPβt are significant at 1% alpha which explains that the determinant of the producerlevel red chili price is the retail price of red chili. The same thing was stated by Miftahuljanah (2019), where the determinant of the price of red chili at the producer level is the price of red chili at the consumer level. The increase in retail price of red chilies will be a trigger for producers to increase their selling price. Estimations of the Static Houck model, the parameters of β+ and ββ are not identical and not significant at 5% alpha level. In Table 4, it is shown that the Pr > ChiSq value of 0.0919 is greater than 0.05.
The null hypothesis is ββ = β- it cannot be rejected. It can be interpreted that the increase and decrease in retail price of red chili will also be followed by an increase and decrease in producer price of red chili. In other words, the price transmission between the retail price of red chili and the producer price of red chili is perfect. However, this finding is different when it is carried out on shallot commodities.
Table 4. Symmetry Testing of β+ and β- Parameters on the Static Model of Red Chili Prices, 2020
Test DF Chi-Square Pr > ChiSq
1 1 2.84 0.0919
According to Ruslan (2016) and Sahara (2019) states that the price transmission in the shallot supply chain is asymmetry. The asymmetric price transmission is due to the fact that shallots are included in durable commodities for more than one month, and it is possible to store these commodities in the same fresh quality condition, in contrast to red chilies which are not durable and their freshness will
be lost if stored for a long time. Farmers do not want to take risks by storing red chilies for longer, and prefer to sell their red chilies even though they are cheap. This situation makes the bargaining position of farmers low and retailers have the power to determine the purchase price of red chilies in the market. In general, the price of red chili in the retail market will decline, because it is caused by: (1) excess supply in the retail market, (2) Harvesting in the red chili production center areas. Low supply of red chilies to the market (below normal supply) will cause the supply in the market to be lower than demand, so that there will be competition between traders to obtain red chilies. This condition will trigger the selling price of red chilies to increase in that market.
In general, the demand for red chilies has increased, especially at certain times such as Eid al-Fitr and other national religious days. When this condition occurs, the red chili traders in the retail market will need more chili supply to meet consumer demand, so that traders in the retail market will be willing to pay a red chili price that is higher than their normal price. This situation makes producers have a high bargaining position in determining prices and will sell their products to retailers at a higher price compared to normal conditions. Conversely, if the price of red chili in the retail market falls, the farmers will respond and accept the price reduction. These findings are in line with Yuniarti et al. (2018) which carried out on organic rice commodities, where the price of organic grain with the price of organic rice is integrated. Estimates using a dynamic model are shown in Table 5.
The results are consistent with static model analysis. These results suggest that the transmission process of retail prices and producer prices for red chili in Indonesia
is symmetrical. Table 5 shows that the variable ΔP∕,t up to the third lag variable (ΔP∕,t-3) is significant at 5% alpha, while the variable ΔP-t is significant only until on lag 1. The asymmetric hypothesis in the dynamic model also determines whether the coefficient parameters β+ = β-; β2 = β-; β3 = β3';■■■; β7 = β7 are identical. The results of the parameter estimation test are shown in Table 6. The test results show that all parameters β+ and β~t are not
significant at α=5%. This indicates that the null hypothesis is acceptable, meaning that an increase or decrease in the retail price of red chili will perfectly transmit to the producer price of red chili. Red Chili price transmission is symmetrical between consumers and producers and applies perfectly. In other words, the Nonreversible price of red chili in Indonesia does not apply, whether it is approached by static or dynamic models.
Table 5. Estimated Parameters of Dynamic Houck Model of Red Chili Prices, 2020
|
Parameter |
Estimate |
Standard Error |
t Value |
Pr > |t| |
Variable |
|
CONST1 |
-84.92158 |
229.55632 |
-0.37 |
0.7119 |
Intercept |
|
ΔPε+t |
0.44346 |
0.09255 |
4.79 |
0.0001 |
HEPos(t) |
|
ΔP⅛-1 |
0.19911 |
0.09333 |
2.13 |
0.0342 |
HEPos(t-1) |
|
ΔP+t-2 |
0.20255 |
0.09470 |
2.14 |
0.0338 |
HEPos(t-2) |
|
ΔP⅛-3 |
0.19688 |
0.09380 |
2.10 |
0.0372 |
HEPos(t-3) |
|
ΔP+t-4 |
-0.07431 |
0.09407 |
-0.79 |
0.4306 |
HEPos(t-4) |
|
ΔP+t-5 |
-0.01331 |
0.09392 |
-0.14 |
0.8874 |
HEPos(t-5) |
|
ΔP+t-6 |
-0.06869 |
0.09386 |
-0.73 |
0.4652 |
HEPos(t-6) |
|
δp- |
0.78374 |
0.11951 |
6.56 |
0.0001 |
HENeg(t) |
|
ΔP-t-1 |
0.26827 |
0.12599 |
2.13 |
0.0346 |
HENeg(t-1) |
|
ΔP-t-2 |
-0.08869 |
0.11616 |
-0.76 |
0.4462 |
HENeg(t-2) |
|
δpE,1-3 |
-0.08325 |
0.11345 |
-0.73 |
0.4640 |
HENeg(t-3) |
|
ΔpE,t-4 |
0.07174 |
0.11389 |
0.63 |
0.5295 |
HENeg(t-4) |
|
δpe*-s |
-0.06293 |
0.11037 |
-0.57 |
0.5693 |
HENeg(t-5) |
|
^E,t-6 |
-0.09163 |
0.10505 |
-0.87 |
0.3842 |
HENeg(t-6) |
R2 = 0.4779; Dw= 1.290.
Akaike’s information criterion (AIC) = 3118.63; Schwarz Bayesian information criterion (SBC) = 3171.16
Table 6. Symmetry Testing of β+ and β1 Parameters on the Dynamic Model of Red Chili Prices, 2020
|
Test |
DF |
Chi-Square |
Pr > ChiSq | |
|
1 |
β+=β- |
1 |
3.83 |
0.0603 |
|
2 |
β2+=β2- |
1 |
0.15 |
0.7004 |
|
3 |
β3+=β3- |
1 |
2.85 |
0.0912 |
|
4 |
β4+=β4 |
1 |
2.64 |
0.1042 |
|
5 |
β+=β- |
1 |
0.71 |
0.3983 |
|
6 |
β+=β6 |
1 |
0.08 |
0.7715 |
|
7 |
β7+=β7- |
1 |
0.02 |
0.8901 |
Red Chili price transmission is symmetrical, between the retail price and the producer price. This finding is in line with Erviana et al. (2020), which states that the transmission of Red Chili prices in West Java Province between producers, wholesalers and consumers is symmetrical. Changes in prices in the wholesale market are immediately transmitted to the consumer level in the same direction. This explains that the Red Chili market in West Java Province is efficient in terms of price efficiency. The same is the finding of Sukmawati (2015) where the price changes that occur in the Caringin Central Market are transmitted perfectly to the Gedebage Main Market. Arnanto et al. (2014) also found that the spatial integration
between provinces in Indonesia in the commodity of rice, sugar, chicken and beef in Indonesia is close to perfect competition. This is one of the references that can be used as a consideration in the decision to stabilize the price of red chili by the government.
Conclusions
The retail-producer price transmission of Chili Red in Indonesia is symmetrical in both the static and dynamic models. Farmers are the main producers of red chili quickly react to an increase or decrease in retail prices in the market. An increase or decrease in the retail price of red chili will be followed by an increase or decrease in the price at the farmer (producer) level. These findings support Houck’ s static approach and do not support the dynamic Acquah and Onumah models, because both the static and dynamic approaches of asymmetric price transmission do not apply in the Indonesian red chili market. The red chili market in Indonesia leads to a perfectly competitive market, so that government intervention is not required to control prices, but must always be under supervision and become a facilitator to monitor that the market mechanism is running perfectly. Improvements in distribution channel 222
infrastructure and information systems on red chili prices in markets and production centers are strategies to anticipate failure of market mechanisms.
Acknowledgments
Acknowledgments submitted to the Head of the Ministry of Agriculture and Food Security the Center for Food Distribution and Reserves of the Ministry of Agriculture Food Security Agency.
References
Acquah, H. G. and E. E. Onumah. (2011). Static Versus Dynamic Model for Estimating Asymmetric Price Transmission in the Ghanaian Maize Market. African Journal of Agricultural Research. Vol.15, pp: 34563460.
Aguiar, D. R. D. and Santana, J.A. (2002). Asymmetry in Farm to Retail Price Transmission: Evidence from Brazil. Agribusiness. Vol.18, pp: 37-48.
Arnanto., S. Hartoyo and W. Rindayati. (2014). Analysis of Spatial Market Integration of Food Commodity in Indonesia. Jurnal Ekonomi dan Kebijakan Pembanguan. Vol.3, pp: 136-157.
Bacon, R. W. (1991). Rockets and Feathers: The
Asymmetric Speed of Adjustment of UK Retail Gasoline Prices to Cost Changes. Energy Econ. Vol.13, pp: 211-218.
Bailey, D. and Brorsen, B. W. (1989). Price Asymmetry in Spatial Fed Cattle Market. Western J. Agric. Econ. Vol.14, pp: 246-252.
Conforti, P. (2004). Price Transmission in Selected
Agricultural Markets. (Working Paper 7-03). FAO Commoditiy and Trade Policy Research.
Delpachitra, S. B. and R. L.S. Hill. (1994). The Law of One Price: A Test Based on Prices for Selected Inputs in New Zealand Agriculture. Agricultural Economics. Vol.10, pp:297-305
Dickey, D. and Fuller, W. (1979). Distribution of the Estimators for Autoregressive Time Series with a Unit Root. Journal of the American Statistical Association. Vol.366 pp:427-431.
Erviana, V., Y. Syaukat and A. Fariyanti. (2020). Analysis of Price Transmission Big Red Chilli in West Java Province. Jurnal Ekonomi Pertanian dan Agribisnis. Vol.4, pp: 77-86
Ganneval, S. (2016). Spatial Price Transmission on Agricultural Commodity Markets under Different Volatility Regimes. Economic Modelling. Vol.52, pp:173-185.
Ghoshray, A. (2011). Underlying Trends and International Price Transmission of Agricultural Commodities. (Working Paper 257). ADB Economics.
Henderson, J. M. and R. E. Quant. (1980). Microeconomics Theory: A Mathematical Approach. Third Edition.
International Student Edition. McGraw-Hill Book Company. Singapura. pp: 145-169.
Heytens, P. J. (1986). Testing Market Integration. Food Research Institute Studies. Vol.20, pp: 34-49.
Houck, J. P. (1977). An Approach to Specifying and Estimating Nonreversible Functions. Am. J. Agric. Econ. Vol.59, pp: 570-572.
Kinnucan, H. W. and Forker, O. D. (1987). Asymmetry in Farm-Retail Price Transmission for major Dairy Products. Am. J. Agric. Econ. Vol.69, pp:285-292.
Mengel, C. S. and S. von Cramon Taubadel. (2014). Distance and Border Effects on Price Transmission: A Meta-Analysis. (Working Paper 37). Global Food Discussion Papers.
Meyer, J. and S. von Cramon-Taubadel. (2002).
Asymmetric Price Transmission: A Survey. Paper prepared for presentation at the xth EAAE Congress ‘Exploring Diversity in the European Agri -Food System’, Zaragoza. Spain. 28-31 August 2002.
Meyer, J. and S. von Cramon-Taubadel. (2004). Asymmetric Price Transmission: A Survey. Journal of Agricultural Economics. Vol.55, pp: 581-611.
Miftahuljanah, K. Sukiyono and P. S. Asrian. (2019). Chili Price Volatilities and Transmisions at Vertical Markets in Bengkulu Province. Jurnal Agro Ekonomi. Vol. 38, pp: 29-39.
Mohanty, S., Peterson, E. W. F. and Kruse, N. C. (1995). Price Asymmetry in the International Wheat Market. Canadian J. Agric. Econ.Vol.43 pp: 355-366.
Nuraeni, D., R. Anindita and Syafrial. (2015). Analysis of Price Variation and Shallot Market Integration In West Java. Habitat. Vol.26, pp: 163-172.
Peltzman, S. (2000). Prices Rise Faster Than They Fall. J. Polit. Econ. Vol.108, pp: 466-502.
Ruslan, Januar, A., M. Firdaus and Suharno. (2016). Asymmetric Price Transmission in Supply Chain of Shallot and Its Relationship with Import in Indonesia: A Case Study in Brebes and Jakarta. Buletin Ilmiah Litbang Perdagangan. Vol.10, pp:103-128
Sahara., M. H. Utari and Z. Azijah. (2019). Volatility Price of Shallot in Indonesia. Buletin Ilmiah Litbang Perdagangan. Vol.13, pp: 309-335.
Sukmawati D. (2015). Pembentukan Harga Cabai Merah Keriting (Capsicum Annum L) dengan Analisis Harga Komoditas di Sentra Produksi dan Pasar Induk. Suatu Kasus Pada Sentra Produksi Cabai Merah Keriting di Kecamatan Cikajang, Pasar Induk Gedebage, Pasar Induk Caringin dan Pasar Induk Kramat Jati. Mimbar Agribisnis. Vol.1 No. 1, pp: 79-84.
Trotter, B. W. (1992). Applying Price Analysis to Marketing System: Methods and Examples from the Indonesian Rice Markets. Marketing Series Volume 3. Chatham. Natural Research Institute. pp. 15-49.
Von Cramon-Taubadel, S. (1999). Estimating Asymmetric Price Transmission with the Error Correction Representation: An Application to the German Pork
Market. Eur. Review. Agricultural. Economic. Vol.25, pp: 1-18.
Ward, R. W. (1982). Asymmetry in Retail, Wholesale and Shipping Point Pricing for Fresh Vegetables. American Journal Agricultural Economic. Vol.62, pp: 205-212.
Willett, L. S., Hansmire M. R. and Bernard, J. C. (1997). Asymmetric Price response Behavior of Red Delicious Apples. Agribusiness. Vol.13, pp: 649-658.
Yuniarti, D., E. S. Rahayu and M. Harisudin. (2018). Analysis of Market Integration and Price Transmission from Grain to Organic Rice of Boyolali. Jurnal Pangan. Vol. 27 pp: 97-106.
Zhang, P., Fletcher, S. and Carley, D. (1995). Peanut Price Transmission Asymmetry in Peanut Butter. Agribusiness. Vol.11, pp: 13-20.
224
Discussion and feedback