The Role Of Local Governments On Increasing Welfare And Reducing Poverty In The District/City Of West Java
on
pISSN : 2301 – 8968
JEKT ♦ 16 [2] : 187-215
eISSN : 2303 – 0186
THE ROLE OF LOCAL GOVERNMENTS ON INCREASING WELFARE AND REDUCING POVERTY IN THE DISTRICT/CITY OF WEST JAVA
Adhitya Wardhana, Bayu Kharisma, Asep Muhammad Adam, Muhammad Dzaki Fahd Haekal
Abstrak
Dalam era desentralisasi pemerintah daerah diberikan kewenangan untuk mengelola keuangan secara mandiri salah satunya adalah peningkatan kesejahteraan masyarakat. Provinsi Jawa Barat merupakan salah satu daerah dengan iklim investasi yang kondusif dan banyaknya pusat pertumbuhan di beberapa daerah memiliki tingkat kesejahteraan yang rendah. Penelitian ini bertujuan untuk melihat bagaimana peran keuangan pemerintah dalam meningkatkan kesejahteraan masyarakat di Kabupaten/Kota Provinsi Jawa Barat dengan periode 5 tahun dari 2016 hingga 2020. Penelitian ini menggunakan analisis kuantitatif berupa grafik kuadran dan cross tabulation serta analisis regresi dengan metode Generalized Least Square (GLS). Hasil analisis menunjukkan bahwa secara umum kabupaten/kota di Jawa Barat masih memiliki ketergantungan terhadap dana transfer pusat dalam upaya peningkatan kesejahteraan dan penurunan kemiskinan. Selanjutnya, masih banyak kabupaten/kota yang belum mampu mengoptimalkan penerimaan daerah sehingga kesejahteraan tidak dapat dioptimalkan. Sementara itu, hasil analisis regresi menunjukkan bahwa dana perimbangan memiliki pengaruh paling kuat terhadap peningkatan pendapatan perkapita, IPM dan penurunan kemiskinan.
Kata Kunci: Pengeluaran pemerintah, IPM, Pendapatan perkapita, Kemiskinan, Generalized Least Square
Abstract
In the decentralization, local government present to to manage finances independently, one of which is improving community welfare. Although the West Java Province is one of the areas with the conducive investment and more growth pool in some areas has a decreased welfare. This study aims to see how the role of government finances in improving people's welfare in the Regency/City of West Java Province for a 5-year period from 2016 to 2020. This study employed quadrant graphs and cross tabulations for quantitative analysis, as well as regression analysis using the Generalized Least Square (GLS) approach. The results of the analysis show that, in general, districts and cities in West Java still depend on central transfer funds in an effort to increase welfare and reduce poverty. Furthermore, there are still many regencies and cities that have not been able to optimize regional revenues so that welfare cannot be optimized. Meanwhile, the results of the regression analysis show that the balancing fund has the strongest influence on increasing per capita income, HDI, and reducing poverty.
Keywords: Government expenditure, HDI, Per capita income, Poverty, Generalized Least Square (GLS)
INTRODUCTION
In the era of decentralization, local governments have the authority to manage regional finances independently. Regional independence is a proof that local governments can manage regional economic activities. One of the foundations for the success of local governments on how well local governments managing the governance is through improving the welfare of the community. Local governments in improving welfare require capital that cannot be separated from high regional revenues to be used as quality government expenditures. Local government revenues are sourced from local revenue (PAD) and balancing funds (central to regional transfer funds). The role of the balancing fund is used as the capital for regional government administration in managing regional finances which in the end is for the benefit of increasing the local revenue.
West Java so far has a fairly high welfare compared to other provinces in Indonesia. The welfare of districts/cities in West Java cannot be separated from the number of growth centers so that economic activities become more conducive. A conducive investment climate as one of the economic successes in the West Java region is becoming more advanced than other provinces. The success of local governments in achieving prosperity cannot be separated from increasing output per capita and reducing
g poverty. Therefore, the local government seeks to improve the welfare of the community through increasing local government revenues and expenditures. Regional revenues sourced from local revenues and balancing funds will show the extent to which the role of regional revenues can improve welfare.
The level of welfare as seen from GRDP per capita (percent) in 2020, the majority of GRDP per capita is still below the GRDP per capita of West Java Province. Some areas in West Java can match and even exceed the GRDP per capita in West Java. Regions that have a per capita GRDP value above West Java Province are Indramayu Regency, Purwakarta Regency, Karawang Regency, Bekasi Regency, Bandung City, Cirebon City and Cimahi City. The four districts have exceeded the GRDP per capita of West Java because the four regions have a dominant industrial sector in terms of employment. Meanwhile, urban areas that exceed West Java's GRDP per capita tend to be one of the growth centers and service sector areas in West Java. There are only a few areas that have a high level of welfare and there are still many areas that have not been able to approach and even match the welfare level of West Java Province. Based on the figure below, the declining level of welfare can be caused by a decrease in economic activity in each region. The existence of Covid 19 has become one of the factors in the decline in economic activity in the West Java area.
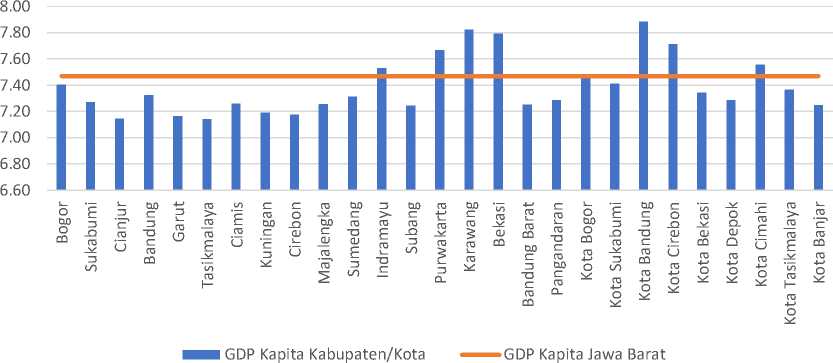
Source : BPS Jawa Barat
Figure 1 GRDP Per Capita Regency/City West Java Province in 2020 (percent)
Poverty conditions in the West Java region can be seen from the poverty level, Figure 2 shows that several areas in West Java still have quite large
many companies laid off employment so that the number of unemployed increased and had an impact on increasing poverty rates.
poverty. It can be seen that the poverty
Districts/Cities in West Java that have a
condition of some areas exceeds the
high level of poverty are generally at
poverty level of West Java Province.
the district level in West Java. The
Regions that have a poverty rate that
number of poor people in districts in
exceeds West Java Province started
West Java is greater than in urban areas.
from the Covid 19 pandemic so that
30.0
25.0
20.0
15.0
10.0
5.0
0.0

^M Tk. Kemiskinan Kab/Kota
«■■■■■■»Tk Kemiskinan Jawa Barat
Source : BPS Jawa Barat
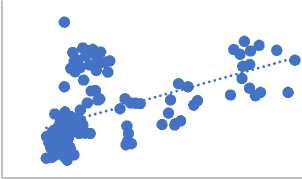
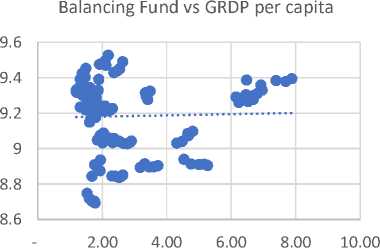
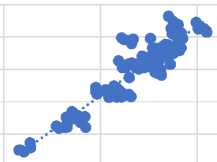
The scatter plot below (figure 3) shows the relationship between regional income and balancing funds on welfare as proxied by GRDP per capita in 20162020. The contribution of regional original income is quite large in improving people's welfare compared to balancing funds. However, based on the picture below, the increase in the value of PAD is not so large in increasing the GRDP per capita. It can be seen that there are still many areas that are below the trend which indicates that low local revenue will increase the value of GRDP per capita which is not so large. Meanwhile, the relationship between balancing funds and GRDP per capita tends to be above the trend line, which indicates that the increase in balancing funds is still dominant in
Figure 2 District/City Poverty Level
West Java Province in 2020 (percent)
West Java, although the relationship is
not as large as the relationship between local revenue and GRDP per capita.
On the other hand, the increase in welfare is influenced by the contribution of local government spending. Effective government spending will have a positive effect on people's welfare. However, in the figure below, the relationship between government spending is inversely related to GRDP per capita. Generally, government spending in West Java has not been effective in improving people's welfare. In addition, the expenditure planning carried out by the regional government could not achieve the planned development targets.
local revenue vs GRDP Per capita
60
50
40
30
20
10
0
2.00 4.00 6.00 8.00
10.00
Government Expenditure vs GRDP Per Capita
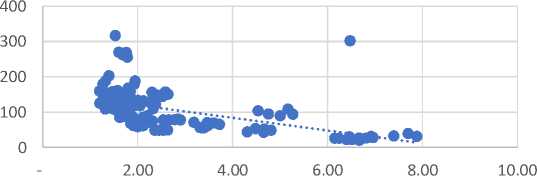
Source : DJPK
Figure 3 Scatter Plot Relationship of local revenue, Balancing Funds and Government Expenditures to GRDP Per Capita in Regency/City of West Java in 2016-2020
Then the local government's efforts to improve welfare can be by reducing the number of poor people. The reduction in the poverty rate cannot be separated from the role of the government in allocating the proceeds from the income obtained every year. Local government policies in reducing poverty levels are contained in the regional medium-term development plan (RPJMD) by setting targets to reduce poverty. Poverty reduction policies are technically through government spending as a form of local government in public services.
Figure 4 shows the government's role in reducing poverty levels. This can be
seen in terms of regional revenues, generally regencies/cities in West Java have not been able to reduce the number of poor people. Likewise, the government spending side as seen in Figure 4 cannot reduce the poverty level. Local government programs and activities are an important key in reducing poverty. Local government programs and activities are an important key in reducing poverty. Government spending planning needs to be carried out in an appropriate manner that is adjusted to the conditions of supporting facilities, the basic capital that leads to poverty reduction.
9.6
9.4
9.2
9
8.8
8.6
Balance Fund vs Poverty
2
6
4
0
8
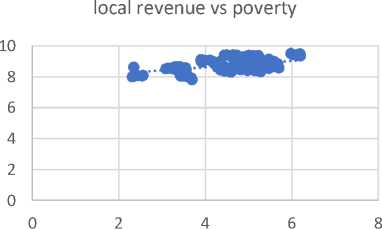
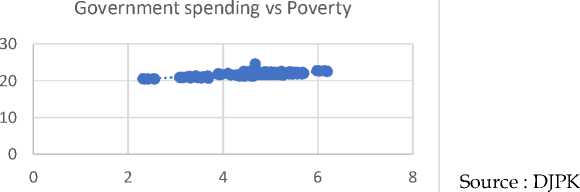
Figure 4 Scatter Plot Relationship of PAD, Balancing Funds and Government Expenditures on Poverty in West Java Regencies/Cities 2016-2020
The efforts made by the local government after seeing the picture
above have not been able to run optimally. From the level of welfare
that is proxied by GRDP per capita, only a few regions are able to exceed the GRDP per capita of West Java Province, where the majority of the district/city welfare level is below the level of West Java Province. Likewise, the level of welfare as measured by the poverty level, it can be seen that some areas in West Java are still very extreme in poverty levels that exceed the poverty of West Java Province. On the regional revenue side, such as regional original income (PAD) can increase welfare both in terms of per capita output, but on the balancing fund side, although it has a positive relationship, it is not as big as the role of PAD on welfare. In achieving the targeted community welfare in the form of local government spending/expenditures as development capital. Based on the previously described scatter plot, it turns out that government spending has not been able to optimally increase per capita output and reduce poverty levels. Therefore, it is necessary to conduct research to analyze the effect of local government revenues and expenditures on people's welfare using the panel data regression method. Then this research was continued by doing quadrant and crosstab analysis.
This research contributes to providing an overview related to the role of local government finance in an effort to improve people's welfare. In addition, it is hoped that the results obtained from both quadrant and crosstab analyzes can be considered for policy makers to formulate development plans at the Regency and City levels in order to encourage regions that still have low
levels of welfare and reduce the number of poor people, especially areas that are still underdeveloped. Have not optimized the potential of the region.
Furthermore, this research is organized into several sections. After the background and research objectives, the next part is the research method which contains the analytical model used. Then proceed with a discussion of the results and conclusions from the results of the study at the end.
METHODS
This research uses quantitative descriptive analysis which aims to analyze how the influence of local revenues, Balancing Fund, government spending and population on the welfare of society. In measuring the welfare of the community, three approaches are used, including per capita income, the Human Development Index (HDI) and the number of poor people. The type of data used is secondary data from 27 regencies/cities in West Java Province from 2016 to 2020. Quantitative analysis was carried out using panel data regression with the Generalized Least Square (GLS) method, where this method was free from heteroscedasticity and autocorrelation problems and provided unbiased estimation results (Hsiao, 2007). In general, to answer the objectives of this research, three models are used which refer to Canare's (2021) study. As for mathematically the first model in this study can be written as follows.
Lngdp _capitait (1)
= βo + βιLnpadit
+ β2Lndaperit
+ β3ras_expendit
+ β4popit + εlt
Where in the first model, the dependent variable is income per capita as a measure of people's welfare. Furthermore, the independent variables in the model include local revenue (Lnpad) balancing fund (Lndaper) Regency/City expenditure ratio to province (ras_expend) and population (pop) as control variables. Furthermore, the second model looks at the role of local governments in improving the quality of human resources by using the Human Development Index (HDI) approach as the dependent variable. Where the independent variables used are the same as in equation 1. Mathematically the model can be written as follows.
lPMu = β0+β1Lnpadit (2)
+ β2Lndaperit
+ β3ras_expendit
+ β4poptt + Zit
Then the third model looks at the role of the government in reducing poverty levels. Where the dependent variable used is the number of poor people(lnpov) while the independent variables used are the same as in the first and second models.
lnpovit = β0 + β1Lnpadit (2)
+ β2Ldaperit
+ β3ras_expedit
+ β4p0pit + Zit
The reason for using three welfare indicators (per capita income, HDI and poverty) is because the three indicators will reveal different levels of welfare. For example, if the analysis finds evidence that the balancing fund has a positive effect on per capita income but has an insignificant effect on poverty, then it shows that the balancing fund is associated with general welfare but not with the welfare of the poor.
RESULT AND DISCUSSION
Research analysis was carried out by looking at the results of the quadrant, cross tabulation table and panel data regression. The quadrant image will show the results of the effect of revenue (Local Revenues and Balancing Fund) and government spending on per capita GRDP and poverty as a proxy for welfare. Meanwhile, the Cross Tabulation describes the government's efforts to increase government revenues and expenditures to increase per capita GRDP and reduce poverty.
The first analysis is seen from the quadrant of the relationship between local revenues, balancing funds and government spending with GRDP per capita and poverty which is explained partially. Figure 5 is the quadrant between PAD and GRDP per capita as indicators of welfare. The trend in Figure 5 shows that the majority of regencies/cities in West Java are in quadrants III and IV. Quadrant III shows a negative relationship between local revenues value and negative GRDP per capita, while quadrant IV shows a positive PAD value and
negative GRDP per capita. So in general some areas in West Java by relying on PAD have not been able to optimally improve the welfare of the community (quadrant IV). Meanwhile, the regions in quadrant III explained
that the less than optimal increase in local revenues could not increase welfare (GDP per capita. Only some regions in West Java were able to increase GRDP per capita through local revenues receipts.
[CELLRANGE]
IOOO
[CELLRANGE] [CELLRANGE]
[CELLRANGE] [CELLRANGE]
[CELLRANGE]
[CELLRANGE]
300000 [CELLRANGE]
[CELL RANGE]
-100000
NGEJ *
[^LLR^e]CELLI⅜NGE]
• ∙ 10
[CELLRANGE]
100000
[CELLRANGE]
cellrange∣ i _ cellrange]
∙∙ [CELLRANGE]
• . _ [CE
300000
500000
[CELLRANGE]
[CELLRANGE]
[CELLRANGE]
• -1000 •
[CELLRANGE]
[CELLRANGE]
[CELLRANGE]
[CELLRANGE]
⅜000
Source : DJPK
Figure 5 Quadrant of Regional Original Income and GRDP per capita Regency/City in West Java
Then the role of PAD on poverty levels in regencies/cities in West Java is not much different from the conditions shown in Figure 5. In Figure 6 shows the relationship between local revenues and the poverty level, the majority are in quadrants I and II. So the increase in the local revenues value which indirectly has not been able to reduce poverty (quadrant I). It is difficult to eliminate the poor population, at least each region can reduce the number of poor people. However, the condition seen from the contribution of local revenues to increase government capital
has not succeeded in reducing poverty. Then some areas are in quadrant II which shows that low local revenues cannot reduce poverty. Local revenue plays a role in increasing capital to increase government spending, if the efforts made by local governments are not optimal, poverty reduction becomes more difficult. From the two figures above, it shows that central transfer funds have an important role in improving welfare, but higher fiscal dependence makes regional independence lessen in promoting development.
[CELLRANGE]
[CELLRANGE]
[CELLRANGE] *
90
70
[CELLRANGE] [ce^raNGE] [CELLRANGE] 50
[CELLRANGE]
[CELLRANGE]
[CELLRANGE]
[CELLRANGE]
[CELLRANGE]
[CELL⅜NGE] [CELLRANGE] • ⅛‰ANGE] • ⅛≡⅛l •
I⅛∙ange∣∙
[CELLRANGE]
[CELLRANGE]
[CELLRANGE]
[CELLRANGE]

[CELLRANGE]
[CELLRANGE]
-600000 -500000 -400000 -300000 -200000 -100000 -io O
[CELLRANGE]
100000
200000
300000
-30
-50
Source : DJPK
Figure 6 Quadrant of Regional Original Income and District/City Poverty in West Java
Next, look at the role of balancing funds in increasing welfare and reducing poverty. Figure 7 shows the relationship between balancing funds and per capita GRDP. The conditions that occur in the picture below are generally in quadrant III. Low balancing funds cannot help improve welfare (GDP per capita). District/City Governments in West Java
still need balancing funds to improve welfare. The need for balancing funds for the regions can be through infrastructure needs and public services. Several types of balancing funds, such as village funds and special allocation funds, can be used as productive funds to improve welfare.
[CELLRANGE]
[CELLRANGE] [CELLRANGE]
[Cellrangej
[CELLRANGE]
0.01
[CEL [C⅛.LRAΓ½01
.RANGE]
-0.0700 -∙0600 -0.QOANGE(b0400
[CELLRANGE]
∣cellra≡Range]
Jc-≡W' ∙0.0200
’ ∙ I
[CELLRANGE]
[CELLI‰GE]
0.00
I -0.0100 0.0000
[CELLRANGE] -θ∙θ⅛ELI RANGE]
0.0100 0.0200
[CELLRANGE]
[cellrangR [CELLRANGE]
[CELLRANGE]
[CELLRANGE]
[cel⅛84ge
[CELLRANGE]
’0.02
[Cellrangei
[C^RANGE] ~uu2
[CELLRANGE]
-0.03
[CELLRANGE]
• -0.03
-0.04
Source: DJPK
Figure 7 Quadrant of the Balancing Fund and GRDP per capita of districts/cities in West Java
The relationship of balancing funds to increase the regional development and community welfare is important as evidenced by the picture below. In Figure 8, the relationship between balancing funds and poverty is in quadrant II. Districts/Cities in West Java are in quadrant II showing the lack of balancing funds that have not been able to reduce poverty. With the existing conditions shown in the picture below, the balancing fund has not been able to reduce poverty. The
need to anticipate various alternatives in financial planning in each area of West Java by thinking about increasing PAD or continuing to rely on balancing funds. On the other hand, fiscal decentralization gives local governments the authority to increase fiscal capacity so that the value of transfer funds can be reduced. However, the conditions that occur are that districts / cities in West Java still rely on the role of balancing funds to support welfare improvements.
[CELLRANGE]
[CELLRANGE]
[CELLRANGE]
[CELLRANGE]
[CELLRANGE]
[CEL^^GE]
[CELLRANGE]
[CELLRANGE] fl
[cellraWrange]
[CELLRANGE]
90
70
50
[CELLRANGE]
[CEttRANGE] • [CELLRANGE]
« 1c>rangPu-ran≡e1 [Cellrmgei [cellrange[
^cell^WngeI ¾*WRAtliEi
[CELLRANGE]
30
1(PELI∣RANGE]
[CELLRANGE]
[CELLRANGE]
-0.00007 -0.00006 -0.00005 -0.00004 -0.00003 -0.00002
[CELLRANGE]
-0.00001 .1¾0(000 0.00001 0.00002
-30
-50
Source : DJPK
Figure 8 Quadrant of the Balanced Fund and District/City Poverty Levels in West Java
The relationship between government spending and GRDP per capita can be seen in Figure 9 based on quadrants. Districts/Cities in West Java tend to be in quadrants III and IV with low local government expenditure categories and low per capita GRDP (quadrant III). Then some regions tend to be in high
government spending and low GRDP per capita (quadrant IV). Based on the quadrant picture below, government spending has not succeeded in increasing the GRDP per capita optimally. There is a resemblance to the relationship between PAD and GRDP per capita in the quadrant below. When
local governments have not been able to increase PAD, it will have an impact on government spending that is not optimal in increasing welfare. The low balancing funds in several districts/cities of West Java have an
impact on the low spending of local governments to support welfare improvements. Government spending is low because it has not been optimal in increasing regional revenues.
0.01
[CELLRANGE]
£.01
[CELLRANGE]
[CfttMtME]
[CELLRANGE] [CELlK⅛⅛B⅛NGE1
-0.00008 -0.00006 -(MffiMtl β0.0∙002
[CELLRANGE] [CELLRANGE] •—P-
Q (J$ LLRANGE]
θυ<f≡ANGEθ.00002 0.00004 0.00006 0.00008 0.00010
-0.01
[CELLRANGE]
[CELLRANGE]
f[CELLRANGE]
[CELLRANGE]
[CE^L⅛½E]
-0 Q^cellrangej /I
Thousands
[CELLRANGE]
[CELLRANGE] ---∙---
[CELLRANGE]
[CELLRANGE]
-0.02
[CELLRANGE] [CELLRANGE]
[CELLRANGE] [CELLRANG^
-0.03
[CELLRANGE]
-0.03
-0.04
Source : DJPK
Figure 9 Quadrant of Government Expenditure and GRDP per capita Regency/City in West Java
Local government efforts in increasing regional revenues determine the allocation of regional government expenditures to improve welfare. Low government spending cannot run optimally for the public interest. The image below is an illustration of the need for regional economic planning in terms of public policy. Figure 10 is a regional mapping in West Java of the relationship between government spending and poverty rates. The tendency that occurs is that many districts/cities in West Java are in quadrants I and II. Regions in quadrant I show that increased government
spending is not able to reduce poverty. Government spending is carried out optimally which is assisted by the amount of regional revenue in reducing poverty, but the role of the government that is carried out is not running optimally, as can be seen from the regions in quadrant II. Regions in quadrant II show that low government spending will be quite difficult to reduce poverty. Based on Figure 10, the role of regional revenue is very important to increase the amount of government spending for more productive activities, especially increasing welfare and reducing
poverty. Local governments will face a through PAD or spending effectiveness dilemma in increasing revenues through balancing funds.
90
[CE
70
!RANGE]
[Cellrangejcellrange]
[CELLRANGE]
[CELLRANGE]
50
[CELLRANGE]
[CELLRANGE]
[Cellrangi [CELLRANGE]
[CELLRANGE]
[CELLRANGE]
• [CELLRANGE]
30
[CELLI ANG⅛
I» ’ lW‰ei
10
[CELLRANGE]
[CELLRANGE]
[CELLfW^NGE]
[CELLRANGE]
• [CELLRANGE]
[CELLRANGE]
[CELLRANGE]
[CELLRANGE]
A [CELLRANGE]
[CELLRANGE]
-0.08000 -0.06000 -0.04000 -0.02000 ιc⅛g[gpθ
0.02000 0.04000 0.06000 0.08000 0.10000
-30
-50
Source : DJPK
Figure 10 Quadrant of Government Expenditures and District/City Poverty Levels in West Java
The relationship between local revenue and HDI can be seen in Figure 11. Districts/Cities in West Java tend to be in quadrants I, II and III. In quadrant I and II there are 7 regions and in quadrant III there are 9 regions. Districts/Cities in West Java which are in quadrant I show that the area through the contribution of local revenue can increase the HDI value. Furthermore, regions in quadrant II showing low local revenue values are
still able to increase HDI, while in quadrant III, low local revenue values in regions have not been able to increase HDI values. In general, there are still many regions that have not been able to increase HDI because they have low local revenue values. High regional revenue is the obligation of regional governments in managing regions to increase development which cannot be separated from the influence of high quality of human resources (HDI).
[CELLRANGE]
[CELLRANGE]
[CELLRANGE]
0.4
0.3
[CELLRANGE]
<E]
[CElφ^⅜βE]
[CELLRANGE]
—-—0
[CELLRANGE]
[CELLRANGE] [CELLRANGE]
[CELLRANGE]
[CELLRANGE] [CELLRANGE]
-600000
-500000
-400000
-300000
-200000
-IOOOfiQ-RANGE] 0
[ce≡≡
200000
[CELLRANGE]
[CELLRANGE]
[CELLRANGE] -Q lφ
Jcellrange] a
[CELLRANGE]
[CELLRANGE]
[CELLRANGE]
[CELLRANGE] [CELLRANGE] λ o
-U.5
[CELLRANGE]
[CELLRANGE]
-0.4
Source : DJPK
Figure 11 Quadrant of Regional Original Income and Regency/City HDI in West Java
The figure below shows the relationship between balancing funds and the Human Development Index (HDI). In general, districts/cities in West Java are grouped in quadrants II and III. Quadrant III is the highest regional group in West Java compared to quadrant II and other quadrants. Regions that have low balancing funds are not able to increase the HDI as stated in quadrant III. In quadrant III regions, there are still many regions that rely on central transfer funds to increase the HDI value. While in quadrant II, it
shows that regions with low balancing funds are able to increase the HDI value. Regions in quadrant III have a fairly good level of fiscal independence so that with a low allocation of balancing funds they are still able to increase HDI. The picture below shows several regions in West Java that have been able to increase their HDI without relying on the amount of balancing funds and many areas that still rely on central transfer funds to increase the HDI value.
[CELLRANGE]
[CELLRANGE]
0.4
[CELLRANGE]
[CELLRANGE] *
[CELLRANGE] [CELLRANGE]
[CELLRANGE]
[CELLRANGE]
[CELLRANqj]
^ELLRANGE]
[CELLRANGE]
0.3
[CELLRANGE]
• 0.2
[CELLRANGg ^
[CELLRANGE]
[CELLRANGE]--^
-500000000 -400000000 [⅛CLQQQQ⅛00 -200000000 -ld≡≡l • [CELLRANGE] _ ∙ Λ
• [CELLRANGE] -⅛ ^°ie
[CELLRANGE] • [CELLRANGE]
-0.2
[CELLRANGE]
[CELLRANGE]
[CELLRANGE]
w 100000000 200000000
[CELLRANGE]
[CELLRANGE]
[CELLRANGE]
-0.3
-0.4
Source : DJPK
Figure 12 Quadrant of District/City Balance Fund and HDI in West Java
Furthermore, the relationship between government spending and the HDI value can be seen in the figure below. Government spending in regencies/cities in West Java tends to cluster in quadrants II and IV. Regions in quadrant II show that low government spending can still optimize the HDI value. Districts/Cities that are in quadrant II show that the government's efforts with low spending can still increase the HDI value. The high quality of human resources is in quadrant II which shows that government spending is relatively low and still has high quality of good human resources. Regions that are grouped in quadrant IV show the characteristics of increasing government expenditures that have not been able to increase HDI. Some regions use government budget allocations that do
not optimally increase HDI figures. Based on quadrant IV, it is necessary to plan expenditure allocations and targets for increasing the HDI which are adjusted to the previous conditions as a reference in increasing the HDI value. In addition to quadrants II and IV, there are regions in West Java which are grouped in quadrant I. Quadrant I shows regions that have an efficient budget to increase HDI scores. The budget allocation issued can be absorbed properly thereby increasing the HDI value. The development of government expenditure allocations depends on local revenues and well-targeted development programs. In general, regions in quadrant I are regions that have succeeded in increasing HDI numbers by utilizing government budget allocations efficiently.
0.4
[CELLRANGE]
(JCgLLRANGE] [CELLRANGE]
[CELLRANGE]
[CELLRANGE]
[CELLRANGE] w
I 0.2 [CELLRANGE] [CELLRANGE] • [CELLRANGE] φ 0.1 - [CELLRANGE!
• [CELLRANGE]
[CELLRAN⅛] a [CELLRANGE] _ [CE⅛RANGE]
[CELLRANGE]
[CELLRANGE]
[CELLRANGE]
-10000000φ⅛LLRANGE]-500000000
[CELLRANGE]
[CELLRANGE]
-0.1
[cΛCrange] η [CELLRANGE]
500000000
[CELLRANGE]
ιooooooooo [CE«epoooo
[CELLRANGE]
-0.2
[CELLRANGE]
-0.3
-0.4
[CELLRANGE]
Source : DJPK
Figure 13 Quadrant of Government Expenditures and District/City HDI in
West Java
The Cross Tabulation table below shows the role of PAD, balancing funds and government expenditures that have an impact on welfare conditions (GDP per capita). The relationship between government revenues and expenditures is based on a classification above or below the average. The calculation is above or below the average based on the results of the median which is used as the basis for seeing districts/cities that are above or below the median. Likewise, the classifier of per capita GRDP refers to the median value, while the poverty level classification refers to the poverty level of West Java Province in 2020.
The table below will explain in detail the relationship between Local Revenue, balancing funds and expenditures, both above and below average. In the cross tabulation between local revenue and GRDP per capita,
regencies/cities in West Java tend to be classified as local revenue below average with GRDP per capita below the average of seven regencies and one city. The increase in local revenue, which is still below the average, has not been able to improve welfare. On the local revenue side, generally regions in West Java have not been able to increase the amount of local revenue so that it will be affected by a low level of welfare. Then some regions can run effectively on local revenue which has an impact on increasing welfare. Regions with local revenue below the average and GRDP per capita above the average are one district and four cities in West Java. This region can run regional revenues efficiently in improving welfare. Areas such as Kab. Sumedang, Cimahi City, Cirebon City, Sukabumi City, Tasikmalaya City can independently carry out their economic
activities by paying attention to the capital stock (PAD) so that the area is not too high in providing welfare targets. Furthermore, regions that have potential resources will increase the value of local revenue which has an impact on increasing per capita GRDP. Regions that have a classification of local revenue and GRDP per capita above the average are Kab. Bandung, Kab. Bogor, Kab. Indramayu, Kab. Karawang, Bandung City, Bekasi City and Bogor City. Regions that have local revenue and GRDP per capita above the average generally have large economic activities compared to other regions. These areas are generally centers of growth and also have leading sectors such as advanced industrial and service sectors, thereby increasing welfare.
Furthermore, on the side of balancing funds (transfer funds) for the needs of local governments. Regions with low fiscal capacity and high fiscal fiscal needs will receive larger transfer funds than regions with high fiscal capacity. The independence of the regions that are increasingly independent can be seen from the balance funds which are not large or in the classification of the balancing funds below the average. Regions in general in West Java already
have a fairly high fiscal independence, only in terms of outcomes there are still regions that have not increased welfare (GDP per capita > average). The number of regions that have high fiscal capacity (balancing funds below the average) with high GRDP per capita is relatively less than regions with other classifications in the cross tabulation below. Regions that have low balancing funds and are able to improve welfare are Kab. Sumedang, Bekasi City, Bogor City, Cimahi City, Cirebon City, Sukabumi City and Tasikmalaya City. In general, regions in West Java are classified as above average with GRDP per capita below average. Regions that have been given a fairly large balancing fund but have not been able to improve welfare. The amount of balancing funds in these regions has not been able to improve welfare, this can be caused by some regions not having adequate infrastructure facilities. Then there are several regions that need transfer funds because these regions have high mobility in economic activities and provide increased welfare results. Areas that have high mobility generally have business activities that rely on labor intensive, such as Kab. Bandung, Kab. Bekasi, Kab. Indramayu, Kab. Karawang, Bandung City.
Table 1 Tabulation (Cross Tabulation) of local revenue, Balancing Funds and Government Expenditures on Regency/City GRDP Capita in West Java in 2020
|
Connection |
GRDP Capita > Average |
GRDP Capita < Average | ||
|
Local Average |
Revenue |
> |
Kab. Bandung, Kab. Bogor, Kab. Indramayu, Kab. Karawang, Kota Bandung, Kota Bekasi, Kota Bogor |
Kab. Bandung Barat, Kab. Bekasi, Kab. Cianjur, Kab. Cirebon, Kab. Sukabumi, Kota Depok |
|
Local |
Revenue |
< |
Kab. Sumedang, Kota |
Kab. Ciamis, Kab. |
|
Average |
Cimahi, Kota Cirebon, Kota Sukabumi, Kota Tasikmalaya |
Kuningan, Kab. Majalengka, Kab. Pangandaran, Kab. Purwakarta, Kab. Subang, Kab. Tasikmalaya, Kota Banjar |
|
Balancing Fund > Average |
Kab. Bandung, Kab. Bekasi, Kab. Indramayu, Kab. Karawang, Kota Bandung |
Kab. Bekasi, Kab. Cianjur, Kab. Cirebon, Kab. Garut, Kab.Kuningan, Kab. Majalengka, Kab. Subang, Kab. Tasikmalaya, |
|
Balancing Fund < Average |
Kab. Sumedang, Kota Bekasi, Kota Bogor, Kota Cimahi, Kota Cirebon, Kota Sukabumi, Kota Tasikmalaya |
Kab. Bandung Barat, Kab. Ciamis, Kab. Pangandaran, Kab. Purwakarta, Kota Banjar, Kota Depok |
|
Government Spending>Average |
Kab. Bandung, Kab. Bogor,Kab. Karawang, Kota Bandung, Kota Bekasi |
Kab. Bekasi, Kab. Cianjur, Kab. Cirebon, Kab. Garut, Kab Majalengka, Kab. Sukabumi, Kab. Tasikmalaya, Kota Depok |
|
Government Spending<Average |
Kab. Indramayu, Kab. Sumedang, Kota Bogor, Kota Cimahi, Kota Cirebon, Kota Sukabumi, Kota Tasikmalaya |
Kab. Bandung Barat, Kab. Ciamis, Kab. Kuningan, Kab. Pangandaran, Kab. Purwakarta, Kab. Subang, Kota Banjar, |
Source : BPS Jawa Barat
Then from the side of government spending, it can be seen that the majority of regions are in government spending above the average but GRDP per capita is below the average. Based on the condition of the relationship between government spending > average with GRDP per capita below the average, it shows that many regions have to improve their spending planning in accordance with the announced targets. Government spending must be in line with the target of improving people's welfare so that government spending runs efficiently. From the tabulation table on the aspect of government spending, there are still
many regions that have not implemented it effectively which has an impact on the decline in welfare. Some areas that have high government spending and produce high community welfare, such as Kab. Bandung, Kab. Bogor, Kab. Karawang, Bandung City and Bekasi City.
Regions that have high government spending tend to have a fairly large local revenue value so that government spending can be realized for economic development. Some regions that have above average government spending but have not been able to improve welfare, such as Kab. West Bandung, Kab. Ciamis, Kab. Pangandaran, Kab.
Purwakarta, Banjar City, Depok City. This can be indicated from one factor, namely the area. The area of a Regency/City will affect the level of welfare. Even though it has high PAD and government spending, it has not been able to increase per capita output significantly. This can be seen from the calculation of a fairly large output target that does not take into account the real conditions in the area.
Then the efforts of local governments in West Java in reducing poverty levels can be seen in the table below. Viewed from the PAD side of regional revenue which is associated with a decrease in the poverty level, the majority of regions in West Java are in PAD below average and poverty below average. In general, districts/cities in West Java have reduced poverty levels with local revenue below the average regional PAD. Several regions rely on increasing PAD (PAD > average) to reduce poverty levels, including Kab. West Bandung, Kab. Bekasi, Kab. Cianjur, Kab. Indramayu, Kab. Karawang, Bogor City, as many as six regions rely on PAD to reduce poverty. In general, increasing the value of PAD is not easy because each region must look for sources that have the potential to be used as objects of PAD. However, districts/cities in West Java with low average PAD were able to reduce poverty as shown in the table PAD < average with poverty < average. There are also some areas that experience saturation from sectors that have the potential to be used as sources of PAD as shown in the first two rows of the column. This happens from a sector that has the potential to be in a
state of diminishing returns so that it cannot reduce poverty.
Furthermore, central government assistance in the form of transfers to regions in West Java generally succeeded in reducing poverty. The table below shows that the majority of regions are in above average balancing funds associated with poverty below the average for West Java Province. The regencies/cities that have succeeded in reducing poverty by relying on balance funds are Kab. West Bandung, Kab. Bekasi, Kab. Ciamis, Kab. Cianjur, Kab. Garut, Kab. Indramayu, Kab. Karawang, Kab. Brass. However, these regencies/cities still depend on the amount of transfer funds so that the regional autonomy in terms of fiscal is relatively low compared to other regions. Regions in West Java have included a fairly high fiscal independence, namely Kab. Majalengka, Kab. Purwakarta, Kab. Subang, Kab. Sumedang, Bogor City, Sukabumi City, Tasikmalaya City. These regions have a lower dependence on transfer funds than other regions. The seven regions have demonstrated the ability to finance their own government activities, development, and services to the community in reducing poverty.
Furthermore, the relationship between government spending and poverty reduction tends to be regional in West Java which is classified as below-average government spending with below-average poverty. The results of this relationship illustrate the success of the effectiveness of government spending in reducing inequality.
Regions that show success in reducing poverty with below average spending values are Kab. Ciamis, Kab. Indramayu, Kab. West Bandung, Kab. Kuningan, Kab. Purwakarta, Kab. Subang, Kab. Sumedang, Bogor City, Sukabumi City, Tasikmalaya City. This region has been able to effectively finance regional needs in reducing poverty. On the other hand, the poverty rate is relatively lower than other regions which can be caused by the low unemployment rate, employment absorption and low population
compared to other regions. In addition, there are many migration flows from these areas to other areas so that they do not have high poverty. Some areas are likely to have high migration flows so that the increase in government spending has not been able to reduce poverty. Several regions are consistently on the revenue and expenditure side above the average, but poverty is still high. This can be because areas near growth centers will have an impact on high migration flows, causing high levels of poverty.
Table 2 Cross Tabulation of the Relationship between Local Revenue, Balancing Funds and Government Expenditures on District/City Poverty Levels in West Java in 2020
|
Connection |
Poverty > West Java Province |
Poverty < West Java Province |
|
Local Revenue > Average |
Kab. Bandung, Kab. Bogor, Kab Cirebon, Kab. Sukabumi, Kota Bandung, Kota Bekasi, Kota Depok |
Kab. Bandung Barat, Kab. Bekasi, Kab. Cianjur, Kab. Indramayu, Kab. Karawang, Kota Bogor |
|
Local Revenue < Average |
Kab. Pangandaran, Kab. Tasikmalaya, Kota Banjar, Kota Cimahi, Kota Cirebon |
Kab. Ciamis, Kab Garut, Kab Kuningan, Kab. Majalengka, Kab. Purwakarta, Kab. Subang, Kab. Sumedang, Kota Sukabumi, Kota Tasikmalaya |
|
Balancing Fund > Average |
Kab. Bandung, Kab. Bogor, Kab. Cirebon, Kab. Sukabumi, Kab. Tasikmalaya, Kota Bandung |
Kab. Bandung Barat, Kab. Bekasi, Kab. Ciamis, Kab. Cianjur, Kab. Garut, Kab. Indramayu, Kab. Karawang, Kab. Kuningan |
|
Balancing Fund < Average |
Kab. Pangandaran, Kota Banjar, Kota Bekasi, Kota Cimahi, Kota Cirebon, Kota Depok, |
Kab. Majalengka, Kab. Purwakarta, Kab. Subang, Kab. Sumedang, Kota Bogor, Kota Sukabumi, Kota Tasikmalaya. |
|
Government Spending>Average |
Kab. Bandung, Kab. Bogor, Kab. Cirebon, Kab. Sukabumi, Kab. Tasikmalaya, Kota Bandung, Kota Depok |
Kab. Bekasi, Kab. Cianjur, Kab. Garut, Kab. Karawang |
|
Government Spending<Average |
Kab. Pangandaran, Kota Banjar, Kota Cimahi, Kota |
Kab. Ciamis, Kab. Indramayu, Kab. Bandung Barat, Kab. |
|
Cirebon |
Kuningan, Kab. Purwakarta, Kab. Subang, Kab. Sumedang, Kota Bogor, Kota Sukabumi, Kota Tasikmalaya. |
Source : BPS Jawa Barat
Then in table 3 shows the relationship between government revenues and expenditures on the Human Development Index (HDI). The relationship between Local Revenue and regional HDI in West Java is generally in the category of Local Revenue above the average with a high HDI. Meanwhile, other regions in West Java tend to group in the category of Local Revenue < average with a moderate HDI and Local Revenue < average with a high HDI. The contribution of Local Revenue in increasing the HDI is quite good, carried out by the Regency / City governments in West Java, there are even regions that have a very high HDI category. Regions in West Java with very high HDI categories are Bekasi City (Local Revenue > average), Cimahi City and Cirebon City (Local Revenue < average). The amount of PAD in each area of West Java in general can be used optimally for human development needs. The results of local revenue can be allocated for the purposes of education and health spending in West Java Districts/Cities. Furthermore, the relationship between the balancing fund and the HDI, the majority of which is in the balancing fund group, is > average with a high HDI. Transfer funds from the central government have generally been used well by local governments to increase the HDI value. Then there are
also many regions that are grouped in the balancing fund > average with a moderate HDI and the rest are outside the two categories. Some areas in West Java have achieved very high HDI, such as Bekasi City, Cimahi City and Cirebon City. These three cities have used the allocation of transfer funds effectively to improve the quality of human resources. Balancing funds by local governments are used as capital for optimal human resource development, which can be seen from many regions in West Java which are grouped in high balancing funds and high HDI. The relationship between local government spending and HDI tends to cluster in government spending below the average with a high HDI. Regions in this category already have a foundation of better quality human resources compared to other regions so that government spending does not need to be allocated on a large scale. Then many regions are grouped in the above average government expenditure category with a high HDI, these regions have optimized their budgets to increase the HDI value. The role of the local government in improving the quality of human resources has been optimal, which can be seen from the absence of regions in West Java with a low HDI category. This is a measure of the success of local governments in terms of the quality of human resources.
Table 3 Tabulation (Cross Tabulation) of the Relationship of PAD, Balancing Funds and Government Expenditures to Regency/City HDI in West Java in 2020
|
Connectio n |
Low HDI |
Medium HDI |
High HDI |
Very High HDI |
|
HDI < 60 |
HDI ≤ 60 HDI < 70 |
HDI≤ 70 HDI < 80 |
HDI ≥ 80 | |
|
Local Revenue > Average |
Kab. Bandung Barat, Kab. Bekasi, Kab. Cianjur, Kab. Indramayu, Kab. Karawang |
Kab. Bandung, Kab. Bogor, Kab. Cirebon, Kab. Sukabumi. Kota Bandung, Kota Bogor, Kota Depok |
Kota Bekasi | |
|
Local Revenue < Average |
Kab. Ciamis, Kab. Garut, Kab. Majalengka, Kab. Pangandaran, Kab. Sumedang, Kab. Tasikmalaya |
Kab. Kuningan, Kab. Purwarkarta, Kota Banjar, Kota Sukabumi, Kota Tasikmalaya, Kab. Subang |
Kota Cimahi, Kota Cirebon | |
|
Balancing Fund > Average |
Kab. Bekasi, Kab. Cianjur, Kab. Garut, Kab. Indramayu, Kab. Karawang, Kab. Majalengka, Kab. Tasikmalaya |
Kab. Bandung, Kab. Bogor, Kab. Cirebon, Kab. Kuningan, Kab. Subang, Kab. Sukabumi, Kota Bandung, Kota Bogor | ||
|
Balancing Fund < Average |
Kab. Bandung Barat, Kab. Ciamis, Kab. Pangandaran, Kab. Sumedang |
Kab. Purwakarta, Kota Banjar, Kota Depok, Kota Sukabumi, Kota Tasikmalaya |
Kota Bekasi, Kota Cimahi, Kota Cirebon | |
|
Governme nt Spending >Average |
Kab. Bandung Barat, Kab. Bekasi, Kab. Cianjur, Kab. Garut, Kab. Karawang |
Kab. Bandung, Kab Bogor, Kab. Cirebon, Kab. Sukabumi, Kota Bandung, Kota Depok |
Kota Bekasi | |
|
Governme nt Spending <Average |
Kab. Ciamis, Kab. Indramayu, Kab. Majalengka, Kab. Pangandaran |
Kab. Kuningan, Kab. Purwakarta, Kab. Subang, Kab. Tasikmalaya, Kota Banjar, Kota Bogor, Kota Sukabumi,, Kota Tasikmalaya |
Kota Cimahi, Kota Cirebon |
Source : BPS Jawa Barat
Further analysis in this study uses panel data regression and uses the Generalized Least Square (GLS) method so that this model is free from classical assumption tests (autocorrelation, multicollinearity, heteroscedasticity). The coefficient of determination of the three regression results can be explained by 99% and the rest is explained outside the research model. The first equation will look at the effect of local government revenues and expenditures on welfare as proxied by per capita GRDP. Based on the regression results table, the previous year's original regional income variable (lnpad -1) has a significant effect on per capita GRDP, an increase in the previous year's Local Revenue by 1% will increase per capita GRDP by 0.173394%. his result is supported by research conducted by Canare (2021) who found that fiscal autonomy can have a positive effect on increasing per capita income.
Furthermore, the balancing fund has a significant effect on GRDP per capita of 0.821727, so every 1% increase will increase by 0.821727%. These results are in line with previous studies conducted by Canare, (2021) and Hao et al. (2020), where that regional revenues from central government transfers have a positive effect on per capita income. This shows that the balancing fund has the potential to increase welfare in general.
The government spending variable, which is proxied by the ratio of district/municipality expenditures to the province, has a significant effect on per capita GRDP with a coefficient value of 0.110194. Government spending increasing 1 percent will increase per capita GRDP by 0.110194%. Government spending makes a significant contribution to general welfare, which in this case is per capita income (Haile & Niño-Zarazúa, 2018). Furthermore, Appiah (2017) more specifically finds that government spending in the education sector has a positive influence on per capita income. However, an increase in government spending does not directly translate to an increase in per capita income. Through increasing government spending on several sectors related to welfare such as education or health, it can have an influence on the skills and quality of life of the community, which in turn will increase their income (Appiah, 2017).
The control variable of population has a significant effect on GRDP per capita. An increase of 1 population will increase GRDP per capita by 4.55E-08%. Hasan (2010) revealed in his research that the population is cointegrated with per capita income, which means it has a significant relationship in the long term. In addition, in the short term population growth has a positive effect on increasing per capita income.
Table 4 Regression Results of the GDP Capita Equation, HDI and District/City
Poverty Levels in West Java 2016-2020
Independent Dependent Variables
|
Variables |
Lngdp_capita |
Prob |
IPM |
Prob |
lnpov |
Prob |
|
c |
-12.97858 |
0.0000 |
-0.516412 |
0.0001 |
0.002099 |
0.0000 |
|
lnpad(-1) |
0.173394 |
0.0000 |
0.029066 |
0.0001 |
-3.88E-05 |
0.0000 |
|
lndaper |
0.821727 |
0.0000 |
0.086925 |
0.0000 |
-0.000177 |
0.0000 |
|
ras_expend |
0.110194 |
0.0006 |
0.016712 |
0.0043 |
-3.41E-05 |
0.0000 |
|
pop |
4.55E-08 |
0.0422 |
8.72E-08 |
0.0000 |
-7.71E-12 |
0.2462 |
|
Adjusted R-squared |
0.997133 |
0.991409 |
0.990804 | |||
|
F-statistic |
1241.388 |
412.58 |
385.3023 | |||
|
Prob(F-statistic) |
0.000000 |
0.0000 |
0.000000 |
Source : Author’s Calculation
Then in the second equation, all independent variables significantly affect the human development index (HDI) partially. HDI is used as an indicator of welfare because an increase in income is accompanied by a high quality of human resources. Regional Original Income (PAD) in the previous year significantly affected the increase in HDI, every 1% increase in PAD will increase HDI by 0.029066%. These results are in line with research conducted by Juliarini (2020) and Mutiha (2018) which reveals that local revenue has a positive effect on increasing HDI. The higher the PAD, the local government is able to provide better services to the community through improving public facilities, which in turn will increase the HDI.
The central transfer fund variable has a significant effect on HDI, an increase of one percent of the balancing fund will significantly affect the HDI increase of 0.086925%. This result is in line with the study conducted by Soejoto & Tjipto Subroto (2015) which proves that the balancing fund provided by the central government to local governments has a positive effect on HDI.
The government expenditure variable significantly affects the HDI with a coefficient of 0.016712. So every 1% increase in government spending will increase the HDI by 0.016712%. Several studies reveal the same result that government spending has an effect on increasing welfare as reflected by the HDI (Craigwell et al., 2012; Edeme & Nkalu, 2019; Mohammad & Razmi, 2012; Safitri, 2016). Government spending is expected to increase the community's economic activity by providing jobs and developing public facilities to create a double effect in improving people's welfare (Fadilah et al., 2018).
The coefficient of the population is 8.72E-08 and has a significant effect on the HDI, an increase in the population of 8.72E-08 will increase the HDI by 8.72E-08%. The increase in population with balanced public facilities such as adequate health and education is able to create human resources that can compete with the increase in population (Ebingha et al., 2019).
The third equation is the poverty level equation which is influenced by the
same independent variables as the first and second equations. In this third equation, the variables of regional revenues and government expenditures have a significant influence on poverty reduction. The previous year's PAD variable had a coefficient value of 3.88E-05, every one percent increase in PAD will reduce poverty by 3.88E-05%. Then the coefficient value of the balancing fund is -0.000177, so every 1% increase in the balancing fund will reduce the poverty rate by -0.000177%. These results are in line with research conducted by Nursini et al. (2019) that local revenues both from central government transfers and from local revenues are more effective in reducing poverty.
The coefficient of government spending is -3.41E-05, an increase in government spending of 1% will reduce the poverty rate by -3.41E-05%. Several studies state that government spending is good in infrastructure (Alamanda, 2020) and agriculture (Arsyad et al., 2020). In addition, research conducted by (Anderson et al., 2018) found that higher government spending can reduce poverty rates, especially in Europe and Central Asia.
The most influencing variable in the equation of per capita GRDP, HDI and poverty reduction is the balancing fund. Regional fiscal dependence on central transfer funds is still very large in improving welfare in West Java Province. From the results of this regression, it shows that the fiscal needs of each Regency/City in West Java are still greater than the fiscal capacity so that development funds still
depend on transfer funds. The balancing fund is the independent variable that most influences the increase in HDI and the decrease in poverty levels. This is in accordance with the first equation, that to increase the value of the quality of human resources which has an impact on increasing welfare and reducing poverty, the balancing fund becomes an important fund by the Regency/City in West Java. In this case, the dependence on balancing funds has made several regions in West Java not independent in managing regional finances. This can also be seen from government spending which has a very small effect on per capita GRDP, HDI and poverty reduction. government expenditure variable has a low coefficient in influencing welfare and poverty reduction. The role of government spending is not felt directly in improving welfare so that the effect is very small. The existence of financial planning is carried out to develop the region for at least 5 years in stages, from the 2016-2020 period, the contribution of government spending is very low in improving welfare. The large need for non-development programs makes government spending more absorbed in non-development program spending so that it still requires transfer funds from the center. In increasing regional development, they cannot rely on PAD, so they need transfer funds from the center. In this era of decentralization, local governments are more independent and given the authority to manage finances for development activities. With regional independence, it is hoped
that the region will be able to increase regional revenue (PAD). Therefore, it is the obligation of local governments to
CONCLUSION
Several conclusions can be drawn from the results of the analysis. Firstly, Districts/Cities in West Java generally still have dependence on central transfer funds to improve welfare and reduce poverty. Regional fiscal dependence on central transfers can result from the sub-optimal area in improving welfare. This can be seen from the relationship between PAD and welfare tends to be in quadrants III and IV, while balancing funds are in quadrant III. Then the relationship between local government spending and per capita GRDP is still not able to improve welfare, the low regional revenue makes local government spending unable to meet regional needs. In the quadrant, it can be seen that local government spending is in quadrants III and IV, which indicates that the contribution of local government spending has not been able to improve welfare. Furthermore, in relation to the level of poverty on the side of regional revenues (Local Revenue and balancing funds), not yet succeeded in reducing the poverty level optimally. The quadrant relationship between Local Revenue and the poverty level tends to be in quadrants I and II, while the quadrant for balancing funds and the poverty rate is mostly in II. The variable of government expenditure is caused by low regional revenues so that government spending has not been able to fully support to
always try to increase the value of PAD in carrying out fiscal decentralization.
reduce the poverty level, this can be seen from the quadrant of government expenditure with the poverty level of the majority of Regencies/Cities in West Java in quadrants I and II.
Secondly, Based on the cross tabulation, seeing the relationship with GRDP per capita, the majority are in the category of PAD below the average and GRDP per capita below the average, there are still many regencies/cities in West Java that have not been able to optimize regional revenues so that welfare cannot be optimized. Furthermore, cross tabulation between balancing funds and per capita GRDP where districts/cities in West Java are generally in the above average balancing fund category and per capita GRDP below average, the increase in balancing funds has not been able to improve people's welfare because central transfer funds are used more for routine needs. Furthermore, the relationship between government spending and GRDP per capita is in the category of government spending above the average with GRDP per capita below the average. In general, districts/cities in West Java in government spending have not reached the target of improving welfare due to low regional revenues. The relationship between regional revenues and government expenditures on poverty is not much different from the relationship between GRDP per capita. The relationship between PAD value and poverty in regencies/cities in West
Java is mostly in PAD below the average with poverty below the provincial average. Then the relationship between balancing funds and poverty, generally Regency/City is in the category of above-average balancing funds with poverty below provincial poverty. Then the local government spending in relation to poverty in general, districts/cities are in government spending above the average with poverty below the poverty value of the province. Judging from the government's role in terms of government revenues and expenditures based on the results of cross tabulation, it can reduce poverty.
Lastly, Based on the results of the regression, it shows that all the variables of regional original income (PAD), balancing funds and the ratio of expenditures of the Regency/City with the Province of West Java have a positive influence on the model with the dependent variable being income per capita and HDI. Meanwhile, in the poverty model, all independent variables have a negative effect. This shows that the government's role in improving welfare, namely increasing per capita income, improving the quality of human resources and reducing poverty can be done through improving local financial management. Through the results of this study, it is hoped that local governments can optimize the potential of their respective regions and allocate funds delegated from the center to improve community welfare by considering the three welfare indicators used in this study.
REFERENCES
Alamanda, A. (2020). THE EFFECT OF GOVERNMENT EXPENDITURE ON INCOME INEQUALITY AND POVERTY IN INDONESIA. INFO ARTHA, 4(1), 1–11.
https://doi.org/10.31092/JIA.V4I1 .614
Anderson, E., d’Orey, M. A. J., Duvendack, M., & Esposito, L. (2018). Does Government Spending Affect Income Poverty? A Metaregression Analysis. World Development, 103, 60–71.
https://doi.org/10.1016/J.WORL DDEV.2017.10.006
Appiah, E. N. (2017). The Effect of Education Expenditure on Per Capita GDP in Developing Countries. International Journal of Economics and Finance, 9(10).
https://doi.org/10.5539/ijef.v9n10 p136
Arsyad, M., Jabuddin, L. O., Aida, S., Taridala, A., Bafadal, A., Tinaprilla, N., Padangaran, A. M., Sani, A., & Aida, S. (2020). Impact of Government Expenditure on Agricultural Output and Poverty . International Journal of Advanced Science and Technology, 29(6), 1640– 1649.
https://www.researchgate.net/pu blication/344304991
Canare, T. (2021). Decentralization and welfare: Evidence from a panel of countries. Annals of Public and Cooperative Economics, October 2020, 1–30.
https://doi.org/10.1111/apce.1232 7
Craigwell, R., Bynoe, D., & Lowe, S. (2012). The effectiveness of
government expenditure on education and health care in the Caribbean. International Journal of Development Issues, 11(1), 4–18. https://doi.org/10.1108/14468951 211213831
Ebingha, E. E., Eni, J. S., & Okpa, J. T. (2019). Population Growth And Socio-Economic Development Of Cross River State, Nigeria.
European Journal of Economic and Financial Research, 0(0).
https://doi.org/10.46827/EJEFR.V 0I0.512
Edeme, R. K., & Nkalu, C. N. (2019). Public Expenditure and Human Development in Nigeria in The Last Decade, Composition and Distributional Impacts. Economics and Business Letters, 8(2), 62–73. https://doi.org/10.17811/ebl.8.2.2 019.62-73
Fadilah, A., Ananda, C. F., & Kaluge, D. (2018). A Panel Approach: How Does Government Expenditure Influence Human Development Index ? Jurnal Ekonomi Dan Studi Pembangunan, 10(2), 130–139.
Haile, F., & Niño-Zarazúa, M. (2018). Does Social Spending Improve Welfare in Low-income and Middle-income Countries? Journal of International Development, 30(3), 367–398.
https://doi.org/10.1002/JID.3326
Hao, Y., Chen, Y. F., Liao, H., & Wei, Y. M. (2020). China’s fiscal decentralization and
environmental quality: theory and an empirical study. Environment and Development Economics, 25(2), 159–181.
https://doi.org/10.1017/S1355770 X19000263
Hasan, M. S. (2010). The long-run relationship between population and per capita income growth in China. Journal of Policy Modeling, 32(3), 355–372.
https://doi.org/10.1016/J.JPOLM OD.2009.09.005
Hsiao, C. (2007). Panel data analysisadvantages and challenges. Test, 16(1), 1–22.
https://doi.org/10.1007/s11749-007-0046-x
Juliarini, A. (2020). EFFECT OF REGIONAL REVENUE ON THE HUMAN DEVELOPMENT INDEX (HDI) IN THE PROVINCES OF WEST PAPUA AND PAPUA, INDONESIA. Simposium Nasional Keuangan Negara, 2(1), 335–354. https://jurnal.bppk.kemenkeu.go.i d/snkn/article/view/547
Mohammad, S., & Razmi, J. (2012). Investigating the Effect of Government Health Expenditure on HDI in Iran. Journal of Knowledge Management, Economics and Information Technology, 2(5), 126– 139.
Mutiha, A. H. (2018). The Effect of Regional Own-source Revenue, Tax Revenue-sharing Fund, General Allocation Fund and Special Allocation Fund to the Human Development Index (Based on the Study of Provincial Government in Indonesia). KnE Social Sciences, 3(11), 609–624–609– 624.
https://doi.org/10.18502/KSS.V3I 11.2792
Nursini, N., Sulawesi, M. S., Pandang, U., & Sulawesi, S. (2019).
POVERTY ALLEVIATION IN THE CONTEX OF FISCAL
DECENTRALIZATION IN. 12(1). https://doi.org/10.14254/2071-789X.2019/12-1/16
Safitri, I. (2016). Pengaruh Pengeluaran Pemerintah Sektor Kesehatan, Pendidikan, Dan Infrastruktur Terhadap Indeks Pembangunan Manusia Di Provinsi Aceh. Jurnal
Ilmiah Mahasiswa, 1(1), 66–76.
Soejoto, A., & Tjipto Subroto, W. (2015). Fiscal Decentralization Policy in Promoting Indonesia Human Development. International Journal of Economics and Financial Issues, 5(3), 763.
http:www.econjournals.com
214
Discussion and feedback