SOCIAL AND FINANCIAL EFFICIENCY OF LEMBAGA PERKREDITAN DESA
on
Vol. 15 No.1, Februari 2022
ISSN : 2301-8968
EKONOMI
KUANTITATIF
TERAPAN
JEKT
The Effect of Banks and Cooperatives in Improving Welfare Inayati Nuraini Dwiputri, Lustina Fajar Prastiwi, Grisvia Agustin
ISSN 2301-8968
Denpasar
Februari 2022
Social And Financial Efficiency Of Lembaga Perkreditan Desa I Gde Kajeng Baskara, Anak Agung Gede Suarjaya
Halaman
1-161
The Role of Social Capital with Local Wisdom in Household Food Security in Bali Province Putu Ayu Pramitha Purwanti, Ida Ayu Nyoman Saskara
Middle Income Trap In A Macroeconomic Perspective A Case Study In Indoensia Apip Supriadi
Trade-Environment Triangle in Indonesia: Ecological Footprint Approach Kuratul Aini, Djoni Hartono
The The Relationship Between Fiscal Policy And Civil Liberty On Per Capita GDP In Indonesia During 1980-2018
Vita Kartika Sari, Malik Cahyadin
The Effect Of Fiscal Decentralization On Economic Growth: A Study Of The Province Level In Indonesia Setyo Tri Wahyudi, Lutfi Kurniawati
The United States’ Monetary Policy Spillover Effect Against Rupiah -Us Dollar Exchange During Usa – China Trade War
Andryan Setyadharma, Anisa Rahmawati, Anisa Rahmawati
Affecting FactorsTrans Land Function In Bali
I Wayan Sudemen, I Ketut Darma
The General Allocation Fund (DAU) Formulation Policy: Incentives or Disincentives to the Fiscal Independence of Local Governments Kun Haribowo, Latri Wihastuti
Impact Of Rural Development Program On Agriculture Production and Rural-Urban Migration In Indonesia Murjana Yasa, Wayan Sukadana, Luh Gede Meydianawathi
Volume 15 Nomor 1

JEKT ♦ 15 [1] : 127-140
eISSN : 2303 – 0186
SOCIAL AND FINANCIAL EFFICIENCY OF LEMBAGA PERKREDITAN DESA
Abstract: Efficiency in managing microfinance institutions in villages has an impact upon the social economic level within village communities. Other than that of efficiency in financial performance, efficiency in social performance has gained significant amount of attention. Village Credit Institution or Lembaga Perkreditan Desa (LPD) is considered a Microfinance Institution or Lembaga Keuangan Mikro (LKM) that is based on Balinese village culture in Bali, Indonesia. This research will measure the efficiency of financial and social performances of 38 of the largest Village Credit Institution in Bali that have assets accumulated above 100 Billion Rupiah. The measurement for the efficiencies performance will utilize a Data Envelopment Analysis (DEA) model in which analyzes the total assets, operational costs and the number of employees as part of the input and operational income, the number of loans, the number of savings and social performances as part of output. The results of this research can show that social and financial performance in Bali having efficient management.
Keywords: microfinance, efficiency, financial efficiency, social efficiency, village credit institution, lembaga perkreditan desa.
INTRODUCTION
The success of operational management of an organization can be observed the outputs that it creates. These outputs can be compared against the inputs that are achieved from creating the outputs. Efficiency in operational management can know from comparing both variables. A company has to always strive to minimize its inputs to the most minimum level in order to create a higher level of output. Efficiency of operational management can be shown by comparing those two variables. Companies have to always try to minimize as much as possible the level of inputs in order to create a higher output that is desired in order to transform the desired level of inputs and outputs.
To measure efficiency of a financial institution is different to that of other types of organizations. The institutions such as banking and institutions that undertake microfinance has a different method of production that is different to that of manufacturing organizations. Financial agencies or institutions 127
can produce products in the form of services in which generate profitability through inputs in which are good sources of resources that are accumulated from financial, human and machinery.
Social performance is considered one of the most important outputs by microfinance institutions (Lembaga Keuangan Mikro or LKM) in which refers to the constitution No.1 Year 2013 that defines microfinance institutions as a special financial institution that provides services in regards to the development of businesses dan community empowerment, this is through loans or funding to businesses categorized as micro businesses for members and society, deposit management, and consultation services that has no intention looking for profit generating activities for the institutions. This definition implies that microfinance institution (LKM) is an institution that still generates profitability as its main motive, but also with a combination of its social motive, in which all activities are based on creating community development without
forgetting its role and a financial agency or institution intermediary (Baskara, 2013). From this explanation it can show that social performance is considered a very important component of output by microfinance institutions/LKM.
Measurements of efficiency for microfinance institutions very seldom is social performance is measure as part of its output. This situation will have an impact on the efficiency analysis that is less than accurate due to the social function of the microfinance institution is not mapped out correctly or accurately. Microfinance institutions in managing inputs have to observe the scope quantifiable aspects (the number customers, profitability, area coverage and so on). Social performance is considered in its scope of qualitative in its scope in which how its factored in the measurement of efficiency to measure overall efficiency of operational management in a microfinance institution creates an increase in quality.
Village Credit Institution or Lembaga Perkreditan Desa (LPD) in Bali represents a microfinance agency or institution that’s has its own uniqueness. However, LPD are not categorized as a microfinance institution under the regulations of central government because of the ownership category and management of LPD due to its unique specialty in aspects of culture and religion through governance of local / customary laws that are applied throughout the island of Bali. This is stated within local regulations of the province of Bali Number 3 Year 2017, in which defines Village Credit Agencies or LPD’s a financial institution which is owned by the local village (Desa Pakraman) in which its located in.
Desa Pakraman is considered a customary law community unit in Bali that has a commonality in tradition and manners that is based on Balinese traditions and Balinese Hindu religious faith. Similar to that of other finance institutions or LKM, the village credit institutions / LPD have a similar function and
social motive. This function is the one category that have never been measured comprehensively with regards to Social Performance Indicators. So far all research has been based on the performance of village credit institution only from its financial aspect.
The measurement of social performance efficiency is vital in understanding the level efficiency the village credit institutions in managing inputs of resources in turn creates outputs of social performance. The results of measuring efficiency for social performance and financial performance is crucial for mapping the efficiency for each LPD. Analysis results will help answer several key questions whether LPD’s capacity of receiving large inputs of financial resources has also created an output of good social performance.
METHOD OF THIS RESEARCH
The research will utilize qualitative and quantitative approach which is descriptive. The qualitative method is used to develop a questionnaire and interview results that can be utilized to create an indicator for social performance. The quantitative method is needed in order to measure financial performance and quantify the results of the questionnaire in regards to social performance in becoming performance scores for social and financial. The quantitative method is also used to measure the level of efficiency of social performance and financial performance in turn create a mapping of the efficiency scores of each LPD. The scope of this research is to measure efficiency of social performance and financial performance in which creates a mapping of performance efficiency for village credit institutions in the Province of Bali. This research is covers only LPD’s that have total assets above 100 Billion Rupiah in the whole Province of Bali
This research uses an input variable based on the research undertaken by Nieto et al. (2007) in which looks at total assets,
operational costs and the number of employees. The total assets represent all assets that is owned and managed by the village credit institution. Assets in LPD come in the form of liquid cash, assets between banks, loans, fixed assets, inventories and other type of assets. Operational costs for village credit institutions are made up of interest costs, labour costs, maintenance and repair costs, depreciation costs, cost of goods and services to third party vendors, and other operational costs. The number of employees in total within the LPD’s includes administrators ‘prajuru’ and supervisors ‘panureksa’.
This research will also use an output variable for financial performance that is the same as the one used in the research undertaken by Nieto et al. (2007). The output variables that will be utilized within this research are operating income, the number of loans and social performance. The output for operational income is all income generated by the LPD for one period. Operational income for village is from income from other banks which is made up of current accounts, savings accounts, term savings accounts and loans that are given, and third-party income sources in forms of interest from loans given. Other than that, there are also forms of operation income generated. Total loan output is the total loan amount that is given by the village credit agency that also includes classification of substandard loans, doubtful loans, not smooth loans and bad credit loans. The number of savings includes saving accounts and deposit accounts at the LPD.
This research uses methods to measure social performance which has been developed by the CESIRE Institution from France. Social Performance Indicators (SPI) in which are made up of four dimensions: (1) Targeting and Outreach, (2) Product and Service, (3) Benefit for Clients, and (4) Social Responsibility.
The targeting and outreach dimension measures the target and reach of services in
which can be categorized into three indicators: (1) geographic targeting, (2) individual targeting and (3) pro-poor methodology. The product and service dimension measures and evaluates the products and services that are given by the LPD, this in turn also has three indicators: (1) range of traditional service (2) quality services and (3) innovative and nonfinancial services. The Benefits for Clients dimension measures the level of economic and social services benefits to the village community and its customers, this has three indicators: (1) economic benefits to client, (2) client participation and (3) social capital/client empowerment. The social responsibility dimension for the LPD measures the level of social responsibility undertaken, this has three indicators (1) social responsibility to employees (2) social responsibility to clients (3) social responsibility to the community and environment.
The measurement of social performances is undertaken through calculating the scores obtained from the questionnaires that are given to and filled by a representative of the LPD. The results obtained from the measurements can show the overall social performance scores that are attained by each individual LPD. The larger the score obtained the better indicator of good social performance.
The size of a company has a positive correlation and significance to its social performance and financial performance. From empirical studies there is proof that the larger the organization the better social performance and financial performance (Trencansky, 2014; Schreck, 2015). From that empirical study, this research will use a population based on the size of organization or the total assets that the organization has.
The number of LPD in the whole of province in Bali according to data obtained in 2018 is as many as 1.433 institutions. With this size of population and located throughout the
whole province, this research will undertake research only based on size of the company.
As shown in Table 1 it shows the number of LPD based on the largest total assets it has. The grouping of LPD is based on the highest wealth ranking (total assets> 100 Billion Rupiah) in which total assets accumulate to 41,44% from the total assets of all village credit institutions combined. By taking this grouping as part of the population for this research it is able to assume that the
grouping of village credit institution has a good social and financial performance in comparison to others who are ranked much lower. Other than this, the LPD that are well established with good agency or institution management practices in which have a clear vision and mission statements, short term and long term strategic planning, and periodically publicizes financial reports for five years in row continuously.
Table 1
Total Assets of Village Credit Institutions/LPD’s in the whole Province of Bali As Per December 2018 (nominal is in thousands of rupiah)
|
Wealth Ranking LPD |
Total Assets LPD |
Number of LPD |
Percentage (%) |
|
100 Billion |
7.654.697.801 |
38 |
41,44 |
|
> 50 B - < 100 B |
2.595.444.746 |
38 |
14,05 |
|
> 10 B - < 50 B |
5.689.761.991 |
258 |
0,80 |
|
> 5 B- < 10 B |
.310.647.306 |
180 |
7,10 |
|
> 1 B - < 5 B |
1.088.931.929 |
406 |
5,90 |
|
> 100 M - <1 B |
128.616.094 |
281 |
0,70 |
|
< 100 M |
3.839.411 |
232 |
0,02 |
|
Total |
18.471.939.278 |
1.433 |
100,00 |
Source: Processed Data, LPLPD Province of Bali Year 2019
According to the criteria of the population size, there are 38 LPD with accumulated wealth of well above 100 Billion Rupiah that is spread across the regencies and province in Bali. There are 7 LPD located in the city of Denpasar, 17 in the regency of Badung, 7 LPD located in the regency of Gianyar, 4 LPD in Buleleng, 2 village credit institution in the regency of Tabanan and 1 LPD in the regency of Karangasem. The method of sampling used is through undertaking a survey or through random sampling of the total population as part of the sample for this research.
The method of analysis that is utilized in this research is descriptive analysis with descriptive statistics to ensure clarity
explaining the results of the variable measurements and efficiency analysis that can show whether social performance and financial performance in LPD are efficient. Efficiency analysis using the method of Data Envelopment Analysis (DEA) also aim to create a mapping and rank performance efficiency of the large village credit institution in Bali.
This analysis is undertaken to measure social performance scores that are obtained through the questionnaire. This score is utilized as a variable for output efficiency for social performance. Descriptive analysis can also be used to interpret input variables and financial performance outputs that are measured by total assets, operational costs, total number of
employees, number of loans and operational income.
Efficiency analysis can be undertaken by using a BOPO ratio and model approach of the Data Envelopment Analysis (DEA). According to Dendawijaya (2005) operational cost ratio can be used to measure the level of efficiency and the banks capabilities in undertaking operational activities. The smaller the ratio is the more efficient the operational costs are according the bank in question. The formula that is used to calculate the BOPO ratio is as follows:
BOPO Ratio = (Operational Cost / Operational Income) x 100%
The efficiency analysis can be undertaken by doing the model approach Data Envelopment Analysis (DEA). DEA is considered an approach non-parametric that is basically an extension of Linear Programming. DEA’s function is to evaluate efficiency in regards to using resources (inputs) in order to achieve a result (outputs), its main purpose is to maximize efficiency. This approach is able to evaluate relative efficiency from grouping units of decision makers or decision making unit / DMU)in managing resources (inputs) with the same amount of resources to create results (outputs), this indicates the relationship between function from inputs to outputs that are known.
The DEA approach puts more emphasis on the approach towards duty and has more focus to more important duties, which is to evaluate performance of of the unit of decision makers or the DMU (decision making units). The analysis that is undertaken is based on the evaluation towards relative efficiency from a DMU that is comparable. Furthermore, DMU’s that are efficient will create a ‘frontier line’. If the DMU is at the frontier line, therefore that DMU in question can be categorized as relatively efficient in comparison towards other DMU’s in the same
peer group. Other than providing results of efficiency in each DMU, the DEA also shows the units that become references to other units that inefficient.
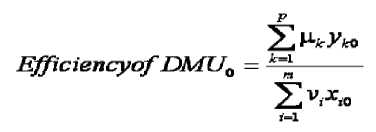
Whether, DMU; n = DMU will be evaluated; m = differing inputs; p = differing outputs; xij = the number of units inputs I that is consumed by DMUj; ykj = the number of outputs k that is produced by DMUj. The DEA approachis considered a non-parametric approach. Because of this, this approach does not need any initial assumptions regarding the production function. However, the weakness of the DEA is that this approach is very sensitive towards extreme observations. This assumption is used as a non-random error, a deviation of the frontier that indicates as inefficiency. There are two models that are often used: The CCR model (1978) and The BCC model (1984), Ascarya (2006).
Within this research the approach that is used is CRS (Constant Return to Scale). The reason of selecting this efficiency scale of the CRS model is because the village credit institutions that are being researched are part of a big LPD that have assets well above 100 Billion Rupiah that are categorised as operating at optimum capacity in accordance to this CRS model. The constant return to scale / CRS model assumes that the ratio between increase of inputs and outputs is the same. This means that if there is an increase in inputs by ‘X’ amount, therefore the outputs will also increase by ‘X’ amounts as well. The other assumption about this CRS model is that every company or within this research is an operating LPD that is running at an optimum scale. The formula for CRS can be showns as follows:
m.
J=I
i =1,..., m
This is when the maximum id above is considered technical efficiency (CCR), xij is the amout of inputs type to-i from the DMU to-j and ykj is the amount of type to-k from the DMU to-j. The efficiency value is always less or the same as to 1. The DMU’s score of efficiency is less than 1 meaning it is inefficient, whereas the DMU’s has a score same as to 1 is considered efficient.
Evaluation that is undertaken through the DEA approach is to undertake a comparative evaluation or a relative evaluation between one units (in this research in which is the LPD) against another unit that is part of one peer group that is going to be analyzed. The measurements are relative in having two outcomes or more work units that have 100% efficiency as a barometer for other work units in order to determine areas for improvement.
RESULTS AND DISCUSSION
The results of measuring the social performance that is shown in Table 2. This table indicates the score for social performance and the score per overall dimension for all LPD that are utilized for this research. Overall, the average score for social performance in LPD researched is 56 points. The highest score can be shown in the social responsibility dimension (score points of 20) and the lowest is at the dimension of target and reach (score points of 7).
The highest social performance score was attained by a LPD in the area of Jimbaran with a score of 72 points and the lowest was for a LPD in Intaran with a score of 31 points. The maximum score for social performance is at 102 points. If compared with the maximum score as previously indicated, the average score for social performance for LPD in Bali would only achieve 55%. This situation cannot be categorised as too low, but rather it has not achieved its optimum score.
Social performance for LPD in Bali still needs to be further improved in order to focus on performance levels that are still relatively low. Performance achievement in regards to products and services dimension and also the benefit to customers dimension still maintained to achieve a reasonably high score with each achieving 63% and 53% for its maximum scores. The power of social performance in LPD can be seen in the social responsibility dimension reaching 83% for its maximum score.
Table 3 will show data variables for input and output for financial performance that will be used in order to analyse efficiency of LPD. According to the table 3, the average operational income is at 23,9 Billion Rupiah with an average operational cost of 19 Billion Rupiah. The average total assets of LPD for this research is 227,8 Billion Rupiah with an average number of loans of 151,3 Billion Rupiah. The number of employees at LPD on average for this research are 30 people.
The data input and output for financial variables will be processed and calculated in regard to efficiency by using BOPO ratio and the DEA method. The financial variable inputs are accumulated of total assets, operational costs and the number of employees that produce financial outputs that are financial variables in forms of operational income and the number of loans given.
Table 2
Social Performance Scores of the Largest LPD’s in Bali Year 2018
|
No |
Name of LPD |
Target & Reach Dimension |
Product & Services Dimension |
Benefit to Customers Dimension |
Social Responsibility Dimension |
Total Score |
|
1 |
Kuta |
4 |
7 |
13 |
22 |
46 |
|
2 |
Pecatu |
6 |
15 |
18 |
16 |
55 |
|
3 |
15 |
19 |
17 |
21 |
72 | |
|
4 |
Kerobokan |
9 |
17 |
17 |
21 |
64 |
|
5 |
Bualu |
5 |
14 |
15 |
23 |
57 |
|
6 |
Sumber Kima |
1 |
10 |
10 |
15 |
36 |
|
7 |
Padang Tegal |
11 |
17 |
13 |
19 |
60 |
|
8 |
Seminyak |
2 |
15 |
7 |
20 |
44 |
|
9 |
Kesiman |
6 |
17 |
13 |
22 |
58 |
|
10 |
Peliatan |
10 |
21 |
18 |
22 |
71 |
|
11 |
Pejarakan |
3 |
14 |
10 |
14 |
41 |
|
12 |
Anturan |
18 |
17 |
17 |
21 |
73 |
|
13 |
Tanjung Benoa |
3 |
13 |
14 |
21 |
51 |
|
14 |
Canggu |
11 |
18 |
18 |
24 |
71 |
|
15 |
Padang Sambian |
5 |
12 |
12 |
21 |
50 |
|
16 |
Tukad Mungga |
11 |
11 |
9 |
12 |
43 |
|
17 |
Kampial |
6 |
18 |
10 |
17 |
51 |
|
18 |
Intaran |
2 |
9 |
8 |
12 |
31 |
|
19 |
Mas |
8 |
19 |
15 |
19 |
61 |
|
20 |
Tegal |
7 |
17 |
7 |
19 |
50 |
|
21 |
Mambal |
11 |
13 |
9 |
18 |
51 |
|
22 |
Panjer |
4 |
14 |
8 |
17 |
43 |
|
23 |
Bedha |
7 |
18 |
14 |
21 |
60 |
|
24 |
Ketewel |
12 |
16 |
15 |
20 |
63 |
|
25 |
Ubung |
7 |
18 |
12 |
22 |
59 |
|
26 |
Beraban |
6 |
15 |
13 |
19 |
53 |
|
27 |
Mengwi |
4 |
17 |
12 |
22 |
55 |
|
28 |
Kepaon |
5 |
18 |
14 |
23 |
60 |
|
29 |
Singakerta |
13 |
16 |
18 |
23 |
70 |
|
30 |
Celuk |
6 |
16 |
14 |
20 |
56 |
|
31 |
Sangeh |
11 |
11 |
16 |
15 |
53 |
|
32 |
Sibang Kaja |
6 |
15 |
12 |
19 |
52 |
|
33 |
Tuban |
10 |
17 |
19 |
23 |
69 |
|
Average |
7 |
15 |
13 |
19 |
55 | |
|
Maximum Score |
28 |
25 |
25 |
24 |
102 | |
|
Achievement |
25% |
63% |
53% |
83% |
55% |
Source :Processed nData,2019
According to the calculation of the BOPO ratio that has been undertaken, the BOPO ratio has given average for LPD for this research 78%. The lower the BOPO ratio indicates the efficient of the institutions are in managing financial operations, otherwise the higher the BOPO ratio indicated inefficiency
for LPD. The BOPO ratio is considered good or optimum with the right conditions for the banking sector for each country being analysed.
The Bank of Indonesia determines the BOPO ratio that is good in between 60% up to 70%, however, the private banking sector in
Indonesia has given a maximum of 80% for a good enough ratio category. In determining the BOPO ratio for LPD it must be compared with the achievement BOPO ratios of other microfinance institutions in Indonesia. However, the ratio that has been set by the Bank of Indonesia can be used as a reference point for the BOPO ratios of LPD at an average of 78%, in which is below the maximum threshold that has been set or pre-determined.
In accordance with the data shown in Table 4 there are five LPD that have BOPO ratios above 90% in which indicates very inefficient. This inefficient condition has gained attention by the management of the LPD in improving or optimizing their institutional financial operations. This Table has also shown that LPD that have achieved a BOPO ratio well below 70% and this only nine (9) institutions. This indicates that village credit institutions are able to optimize their inputs that are used to maximize their outputs.
Table 5 has shown results of the test method of the DEA model of measuring efficiency for financial performance and efficiency for social performance in the largest category village credit institution in Bali for the year 2018. The DEA model is used for input oriented-constant return to scale that is based on efficiency analysis by optimizing or efficiency performance output that has produced a number of outputs that are wanted. Score 1 indicates that LPD are most efficient and becomes the DMU’s best practice for this efficiency analysis. A score A score below 1 or a lower score indicates levels of inefficiency, or the LPD is inefficient.
On average the largest LPD in Bali have indicated a level of efficiency that is considered very good, through a financial performance efficiency score of 0,94 or 94%. As many as 11 (eleven) LPD are able to achieve the level of efficiency of a score of 1 or 100%. Overall, it is able to assume that the
largest LPD in Bali are able to manage financial performance efficiently.
The Financial performance efficiency analysis for LPDs or social performance efficiency analysis can be shown on Table 5. The average score for efficiency that has been achieved is at 75,2% and this indicates a level of efficiency that is relatively good, but there still enough LPD that have an social performance efficiency that is low with a score below 50%.
Inefficiency for social performance for LPD is caused by not optimizing management of resources available and unable to achieve social performance that is targeted. LPD that is not efficient is unable to achieve social performance optimally, no matter if the level of inputs is the same with other LPD that are more efficient, even with some cases several LPD have a level of inputs that are larger.
The result of calculating social efficiency indicates that there are five (5) institutions that are efficient with regards to social performance and categorised as “best practice” or as a reference to other large LPD. There are also four LPD institutions that the level of efficiency for social performance is low or very inefficient with a score below 0,50 or 50%.
Social performance efficiency will be related to the financial performance efficiency. Studies have found that in order to remain efficient from a social standpoint a micro financial institution must be efficient financially, this is because community financial institutions or LKM’s that have large social contributions but are inefficient financially will not ensure the long-term sustainability. In an attempt to analyse in detail, the social efficiency with its relationship with financial efficiency in the largest LPD in Bali, this research is going to provide an ‘Efficiency Quadrant Matrix’ for social and financial efficiency in Picture 1.
Table 3
Data for the Village Credit Institutions with Input and Output Variables for Finance Performance Per December 2018 (in thousands of Rupiah)
|
No |
Name of LPD |
Total Assets (Input) |
Operational Costs (Input) |
Number Employees (Input) |
Operational Income (Output) |
Number Of Loans (Output) |
|
1 |
Kuta |
499.988.614 |
31.718.903 |
69 |
36.407.371 |
329.140.872 |
|
2 |
Pecatu |
497.467.940 |
35.214.601 |
52 |
40.278.485 |
341.020.265 |
|
3 |
Legian |
418.097.396 |
26.865.530 |
34 |
34.694.817 |
295.873.740 |
|
4 |
38.141.454 |
318.759.971 | ||||
|
5 |
Kerobokan |
413.379.743 |
34.225.243 |
54 |
42.735.373 |
280.436.295 |
|
6 |
Bualu |
393.595.184 |
34.319.166 |
55 |
39.435.711 |
263.002.463 |
|
7 |
Sumber Kima |
277.336.653 |
30.848.093 |
24 |
34.112.652 |
169.842.991 |
|
8 |
Padang Tegal |
286.342.045 |
21.150.317 |
42 |
28.253.939 |
208.834.276 |
|
9 |
Bedulu |
349.786.488 |
38.206.922 |
20 |
41.517.962 |
211.888.693 |
|
10 |
Seminyak |
243.877.749 |
13.682.254 |
29 |
18.791.196 |
168.346.612 |
|
11 |
Kesiman |
279.539.574 |
22.124.364 |
38 |
32.413.055 |
170.134.580 |
|
12 |
Peliatan |
26.428.546 |
170.584.041 | |||
|
13 |
Pejarakan |
190.696.489 |
20.932.064 |
21 |
23.364.744 |
126.804.321 |
|
14 |
Anturan |
240.986.910 |
38.330.627 |
20 |
42.250.888 |
204.985.502 |
|
15 |
Tanjung Benua |
208.728.409 |
14.840.014 |
31 |
23.858.734 |
161.751.205 |
|
16 |
Canggu |
247.148.345 |
13.175.577 |
31 |
20.362.435 |
102.801.654 |
|
17 |
Padang sambian |
205.103.793 |
17.602.668 |
35 |
24.702.899 |
138.055.861 |
|
18 |
Tukad Mungga |
126.985.456 |
15.912.296 |
17 |
18.597.507 |
68.791.725 |
|
19 |
Kampial |
213.018.185 |
18.662.268 |
20 |
21.413.199 |
105.918.952 |
|
20 |
Intaran |
191.476.142 |
19.680.009 |
38 |
20.740.483 |
144.437.309 |
|
21 |
Peminge |
156.950.695 |
9.775.260 |
18 |
13.074.105 |
110.144.450 |
|
22 |
Mas |
173.529.868 |
13.123.837 |
25 |
16.754.550 |
131.718.548 |
|
23 |
Tegal |
165.724.802 |
13.763.709 |
26 |
17.334.513 |
107.166.942 |
|
24 |
Mambal |
187.493.747 |
21.297.318 |
24 |
27.390.332 |
173.061.469 |
|
25 |
Panjer |
165.143.874 |
13.320.182 |
24 |
20.049.891 |
109.297.706 |
|
26 |
Bedha |
157.229.472 |
15.117.753 |
20 |
20.374.985 |
103.903.179 |
|
27 |
Ketewel |
151.200.799 |
11.167.793 |
32 |
14.978.112 |
69.842.556 |
|
28 |
Sibetan |
151.338.635 |
13.821.806 |
17 |
17.377.492 |
86.611.321 |
|
29 |
Pedungan |
155.930.130 |
13.541.135 |
32 |
20.129.180 |
108.456.634 |
|
30 |
Ubung |
149.818.571 |
10.387.555 |
21 |
16.272.866 |
86.353.297 |
|
31 |
Beraban |
137.376.496 |
8.672.390 |
22 |
12.792.775 |
67.462.165 |
|
32 |
Mengwi |
147.458.974 |
11.462.743 |
16 |
17.904.539 |
88.682.535 |
|
33 |
Kepaon |
142.998.977 |
10.699.081 |
24 |
14.577.962 |
74.023.619 |
|
34 |
Singakerta |
128.131.700 |
11.656.726 |
27 |
14.046.100 |
76.659.525 |
|
35 |
Celuk |
157.487.796 |
10.833.244 |
10 |
17.278.820 |
111.241.670 |
|
36 |
Sangeh |
137.795.105 |
15.331.877 |
25 |
16.985.520 |
120.721.709 |
|
37 |
Sibang Kaja |
118.133.807 |
10.080.095 |
19 |
12.222.608 |
66.916.735 |
|
38 |
Tuban |
118.878.060 |
9.345.696 |
27 |
12.019.443 |
78.130.044 |
|
Average |
227.841.846 |
19.040.356 |
30 |
23.949.085 |
151.363.301 |
Source: LPLPD Province of Bali, Data Processed, 2019\
Table 4
The Ratio of Operational Costs towards Operational Income (BOPO)
|
No |
Name of LPD |
Operational Costs (Thousands of Rp) |
Operational Income (Thousands of Rp) |
BOPO Ratio (%) |
|
1 |
Kuta |
31.718.903 |
36.407.371 |
87,12 |
|
2 |
Pecatu |
35.214.601 |
40.278.485 |
87,43 |
|
3 |
Legian |
26.865.530 |
34.694.817 |
77,43 |
|
4 |
38.141.454 |
82,90 | ||
|
5 |
Kerobokan |
34.225.243 |
42.735.373 |
80,09 |
|
6 |
Bualu |
34.319.166 |
39.435.711 |
87,03 |
|
7 |
Sumber Kima |
30.848.093 |
34.112.652 |
90,43 |
|
8 |
Padang Tegal |
21.150.317 |
28.253.939 |
74,86 |
|
9 |
Bedulu |
38.206.922 |
41.517.962 |
92,03 |
|
10 |
Seminyak |
13.682.254 |
18.791.196 |
72,81 |
|
11 |
Kesiman |
22.124.364 |
32.413.055 |
68,26 |
|
12 |
Peliatan |
26.428.546 |
79,56 | |
|
13 |
Pejarakan |
20.932.064 |
23.364.744 |
89,59 |
|
14 |
Anturan |
38.330.627 |
42.250.888 |
90,72 |
|
15 |
Tanjung Benua |
14.840.014 |
23.858.734 |
62,20 |
|
16 |
Canggu |
13.175.577 |
20.362.435 |
64,71 |
|
17 |
Padang sambian |
17.602.668 |
24.702.899 |
71,26 |
|
18 |
Tukad Mungga |
15.912.296 |
18.597.507 |
85,56 |
|
19 |
Kampial |
18.662.268 |
21.413.199 |
87,15 |
|
20 |
Intaran |
19.680.009 |
20.740.483 |
94,89 |
|
21 |
Peminge |
9.775.260 |
13.074.105 |
74,77 |
|
22 |
Mas |
13.123.837 |
16.754.550 |
78,33 |
|
23 |
Tegal |
13.763.709 |
17.334.513 |
79,40 |
|
24 |
Mambal |
21.297.318 |
27.390.332 |
77,75 |
|
25 |
Panjer |
13.320.182 |
20.049.891 |
66,44 |
|
26 |
Bedha |
15.117.753 |
20.374.985 |
74,20 |
|
27 |
Ketewel |
11.167.793 |
14.978.112 |
74,56 |
|
28 |
Sibetan |
13.821.806 |
17.377.492 |
79,54 |
|
29 |
Pedungan |
13.541.135 |
20.129.180 |
67,27 |
|
30 |
Ubung |
10.387.555 |
16.272.866 |
63,83 |
|
31 |
Beraban |
8.672.390 |
12.792.775 |
67,79 |
|
32 |
Mengwi |
11.462.743 |
17.904.539 |
64,02 |
|
33 |
Kepaon |
10.699.081 |
14.577.962 |
73,39 |
|
34 |
Singakerta |
11.656.726 |
14.046.100 |
82,99 |
|
35 |
Celuk |
10.833.244 |
17.278.820 |
62,70 |
|
36 |
Sangeh |
15.331.877 |
16.985.520 |
90,26 |
|
37 |
Sibang Kaja |
10.080.095 |
12.222.608 |
82,47 |
|
38 |
Tuban |
9.345.696 |
12.019.443 |
77,75 |
|
Average |
19.040.356 |
23.949.085 |
77,99 |
Source: Processed Data, 2019
Table 5
Social Performance Efficiency and Finance of LPD.
|
No. |
LPD |
Financial Efficiency |
Social Efficiency |
|
1 |
Kuta |
0,900 |
0,312 |
|
2 |
Pecatu |
0,930 |
0,420 |
|
3 |
Legian |
1,000 |
0,627 |
|
4 |
Jimbaran |
0,992 |
0,575 |
|
5 |
Kerobokan |
0,873 |
0,502 |
|
6 |
Bualu |
0,847 |
0,465 |
|
7 |
Sumber Kima |
0,933 |
0,488 |
|
8 |
Padang Tegal |
0,938 |
0,694 |
|
9 |
Bedulu |
1,000 |
0,767 |
|
10 |
Seminyak |
1,000 |
0,650 |
|
11 |
Kesiman |
0,985 |
0,679 |
|
12 |
Peliatan |
0,895 |
0,921 |
|
13 |
Pejarakan |
0,888 |
0,708 |
|
14 |
Anturan |
1,000 |
1,000 |
|
15 |
Tanjung Benua |
1,000 |
0,815 |
|
16 |
Canggu |
0,961 |
1,000 |
|
17 |
Padang sambian |
0,967 |
0,785 |
|
18 |
Tukad Mungga |
0,964 |
1,000 |
|
19 |
Kampial |
0,897 |
0,926 |
|
20 |
Intaran |
0,940 |
0,502 |
|
21 |
Peminge |
1,000 |
0,922 |
|
22 |
Mas |
1,000 |
0,754 |
|
23 |
Tegal |
0,856 |
0,623 |
|
24 |
Mambal |
1,000 |
0,612 |
|
25 |
Panjer |
0,987 |
0,556 |
|
26 |
Bedha |
0,965 |
0,861 |
|
27 |
Ketewel |
0,851 |
0,767 |
|
28 |
Sibetan |
0,881 |
0,874 |
|
29 |
Pedungan |
1,000 |
0,651 |
|
30 |
Ubung |
0,984 |
0,887 |
|
31 |
Beraban |
0,925 |
0,875 |
|
32 |
Mengwi |
1,000 |
0,894 |
|
33 |
Kepaon |
0,867 |
0,843 |
|
34 |
Singakerta |
0,832 |
0,979 |
|
35 |
Celuk |
1,000 |
1,000 |
|
36 |
Sangeh |
0,960 |
0,743 |
|
37 |
Sibang Kaja |
0,815 |
0,900 |
|
38 |
Tuban |
0,870 |
1,000 |
|
Average |
0,940 |
0,752 | |
|
Source: Processed Data, 2019 | |||
Picture 1 has shown four quadrants that indicate whether a LPD has efficiency financially and also have efficiency socially that is relatively high. The Quadrant 1 is filled with LPD that are inefficient financially and socially, Quadrant 2 shows institutions that are
inefficient from financial efficient perspective but are efficient from a social efficiency perspective. Quadrant 3 is considered with the best levels of efficiency for both financial and social efficiencies, Quadrant 4 on the other hand is filled with institutions that are
financially efficient but are low in social efficiency.
Picture 1: Efficiency Quadrant Matrix for Social and Financial for the Largest Village Credit Institutions in Bali
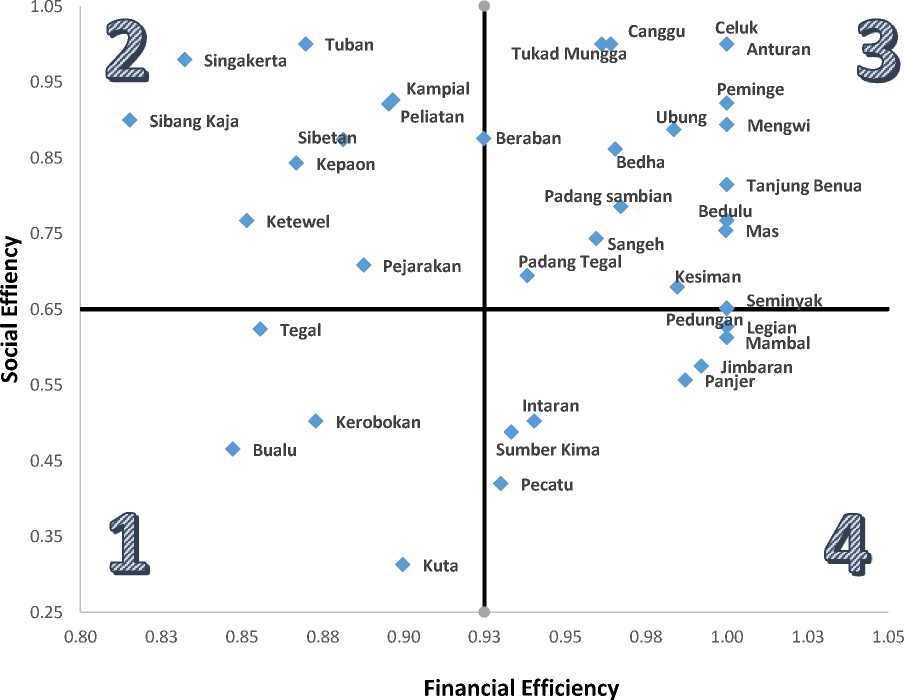
According to the Efficiency Quadrant Matrix can be seen that the scatter efficiency levels for the LPD in Bali are most in the 3rd quadrant in which represents the best overall performance efficiency for institutions. This situation can be interpreted that the largest LPD in Bali have a significant number that have high levels of financial efficiency and also optimizing social efficiency at the same time. There are only four institutions that are in the 1st Quadrant that is considered to have the most inefficient levels of efficiency performance.
CONCLUSION AND SUGGESTIONS
The results of this research have found that comprehensively social performance and financial performance of the largest LPD in Bali indicate efficient management practices. The efficiency analysis of financial performance with the BOPO ratio indicates that the average achievement of 78% for the largest village credit institutions in Bali for the year 2018. This figure has shown that efficiency that is good is able to be undertaken by the largest LPD in Bali with optimal operating costs in order to attain operational income that is higher.
The results of the efficiency analysis using the DEA model indicates that efficiency of social performance and financial performance in LPD is able to achieve a level that is categorized as efficient. Financial efficiency has achieved 94% or considered very efficient. Social performance for LPD in detail has a achieved a good level of efficiency which is at 75,2%. This combination of efficiency from social performance and financial performance in the largest LPD in Bali indicates that efficiency is very good. Though using the Efficiency Quadrant Matrix it can be seen that the LPD a large portion are in the 3rd Quadrant that is for the highest for the combination of both social and financial efficiency.
The findings from the research studies before have good specific types of community credit institutions or LKM’s , location or country and also period of time in which the research was undertaken resulting in the findings for social efficiency and financial efficiency through the largest village credit institutions cannot be compared or contrasted. This has shown the results of this research is considered a new finding and is hoped that it can be referenced and or motivation for future researchers for the same tipe in the foreseeable future.
The research topic social efficiency and financial efficiency in community credit institutions in Indonesia other than that of LPD is always needed to be undertaken. Researchers with the same topic, but with a larger sample size and good financial conditions that is different is needed. Recommendations for the management of the LPD, is that they should create social programs that touch the community directly to community members who are less fortunate in the region where the institution is located. Through this, in regards to social activities it can help improve and increase output of social performance in order to improve the level of social performance to
become even better. Also optimisation of usage of inputs can help increase the level of efficiency to become better for both socially and financially.
REFERENCE LIST
Anderson & Clancy. (1991). The Performance Measurement. Harvard Business Review (Januari-February, 1991).
Annim, Samuel Kobina. (2012). Microfinance Efficiency Trade-offs and
Complimentarities. European Journal of Development Research.
Ascarya dan Yumanita, Diana. (2006). Analisis Efisiensi Perbankan Syariah di Indonesia dengan Data Envelopment Analysis. Tazkia; Islamic Finance and Business Review, Vol.1, No.2,
Baskara, I.Gde Kajeng. (2013). Lembaga Keuangan Mikro di Indonesia. Buletin Studi Ekonomi. Vol 18. No.2. pp. 114125
Baskara, I Gde Kajeng., & Nyoman Triaryati. (2020). Kinerja Sosial Lembaga Perkreditan Desa. Matrik: Jurnal
Manajemen, Strategi Bisnis dan Kewirausahaan, Vol. 14. No. 2. Pp 182-192
Berger, A.N. and Humphrey DB. (1997). Efficiency of financial institutions: International survey and directions for future research. European Journal of Operational Research 98(2): 175–212.
Bibi, Uzma. Hatice Ozer Balli, Claire D.
Matthews and David W.L. Tripe. (2017). Impact of Gender and Governance on Microfinance
Efficiency. Journal of International
Financial Markets, Institution and
Money. Elsevier-Science Direct.
Bibi, Uzma. Hatice Ozer Balli, Claire D. Matthews and David W.L. Tripe. (2018). New approach to Measure the Social Performance of Microfinance Institutions (MFIs). International Review of Economics & Finance. Elsevier-ScienceDirect.
Nieto, B. Gutierrez., C. Serrano-Cinca and Mar Molinero. (2007). Social Efficiency in Microfinance Institutions. Journal of the Operational Research Society.
Palgrave-journals.
Peraturan Daerah Provinsi Bali Nomer 3 Tahun 2017 tentang Lembaga Perkreditan Desa. Gubernur Bali dan DPRD Provinsi Bali.
Prasetyo, Muhammad Budi, (2007). Perbandingan Pengukuran Efisiensi Perbankan Syariah Di Indonesia Dengan Perbankan Syariah Di Malaysia Pada Tahun 2003-2006 Dengan Metode DEA. Departemen Manajemen, FEUI: Depok.
Schreck, Philipp., Sascha Raithel. 2015. Corporate Social Performance. Firm Size, and Organizational Visibility: Distinct and Join Effecst on Voluntary
Sustainability Reporting. Business & Society. Sage Publishing. Sagepub.com
Susila, Ihwan. (2007). Analisis Efisiensi Lembaga Keuangan Mikro, Jurnal Ekonomi Pembangunan. Vol. 8 No.2.
Trencansky, David.,Dimitrios Tsaparlidis. 2014. The Effct of Company’s Age, Size and Type of Industry on the Level of CSR. Master Thesis, Umea School of Business and Economics, Sweden.
Undang undang No. 1 tahun 2013 tentang Lembaga Keuangan Mikro. Dewan Perwakilan Rakyat Republik Indonesia.
Wijesiri, Mahinda. Jacob Yaron dan Michele Meoli. (2017). Assesing the Financial and Outreach Efficiency of Microfinance Institution; Do Age and size Matter?. Journal of Multinational Financial Management. Elsevier-Science Direct.
Zhu, Joe. (2009). Quantitative Models for Performace Evaluation and
Benchmarking: Data Envelopment
Analysis with Spreadsheets, Springer Science+Business Media, LLC. Second Edition.
140
Discussion and feedback