ANALYSIS OF FINANCIAL INSTITUTIONS CREDIT IMPACT ON MSE INCOME IN BALI PROVINCE
on
ISSN : 2301-8968
Vol. 14 No.2, Agustus 2021
EKONOMI
KUANTITATIF
TERAPAN
Volume 14
JEKT
Nomor 2
ISSN 2301-8968
Denpasar Agustus 2021
Halaman
243-431
Balinese Indigenous Knowledge about Water : A Way to Achieve Water Sustainability
Amrita Nugraheni Sarawaty, I Wayan Gita Kesuma, I Gusti Wayan Murjana Yasa
Planning Consistency and the Political Budget Cycle in Indonesia Farina Rahmawati, Khoirunurrofik Khoirunurrofik
PROVINCE Analysis of Financial Institutions Credit Impact on MSE Income in Bali Province Ksama Putra, Ni Putu Wiwin Setyari
The Dynamics of Credit Procyclicality and Stability of Macroeconomics in Indonesia Ni Putu Nina Eka Lestari, Made Kembar Sri Budhi, I Ketut Sudama, Ni Nyoman Reni Suasih, I Nyoman taun
The The Impact of COVID-19 on FinTech Lending in Indonesia: Evidence From Interrupted Time Series Analysis
Abdul Khaliq
The Dynamics of Exchange Rate, Inflation, and Trade Balance in Indonesia Yon Widiyono, David Kaluge, Nayaka Artha Wicesa
Volatilitas inflasi sebagai fenomena kombinasi moneter-fiskal di Indonesia Eli Marnia Henira, Raja Masbar, Chenny Seftarita
The Analysis of Willingness to Pay (WTP) Visitors to The Development of Rafting Toutism in Serayu Watershed
Nobel Sudrajad, Waridin, Jaka Aminata, Indah Susilowati
Relatiomships Between Characteristic of Local Government and Website Based Financial Gabriela Amanda Widyastuti, Dena Natalia Damayanti, Marwata
The Relationship Among Economic Structure, Sectoral Workforce, and Community Welfare in Bali Province I Nyoman Mahendrayasa

pISSN : 2301 – 8968
JEKT ♦ 14 [2] : 295-303
eISSN : 2303 – 0186
ANALISA DAMPAK KREDIT DARI LEMBAGA KEUANGAN TERHADAP PENDAPATAN UMK DI PROVINSI BALI
Ketut Ksama Putra, SST1 Dr. Ni Putu Wiwin Setyari, S.E.,M.Si2 Universitas Udayana
Abstrak
Usaha Mikro Kecil (UMK) merupakan skala usaha yang mendominasi pada perekonomian nasional maupun perekonomian regional Bali. Memegang peranan strategis, UMK masih memiliki keterbatasan dalam pengembangan usahanya. Salah satu solusi mengatasi keterbatasan tersebut adalah melalui tambahan modal dengan jalur kredit usaha dari lembaga keuangan. Dengan tambahan modal, pelaku usaha bisa memperluas pemasaran, menambah faktor produksi, memperbaiki kualitas output dan lain sebagainya. Namun disisi lainnya, dampak kredit juga memiliki efek yang negatif. Pembayaran hutang secara berkala maupun tambahan pembayaran melalui bunga kredit menjadi hal yang mempengaruhi kelancaran neraca keuangan perusahaan. Penelitian ini bertujuan untuk mengetahui dampak kredit terhadap pendapatan UMK di Bali. Data yang digunakan adalah data SE2016-Lanjutan dan PODES (BPS). Metode penelitian menggunakan teknik analisis Propensity Score Matching (PSM). Berdasarkan hasil pengolahan, kredit memiliki dampak positif signifikan terhadap pendapatan UMK.
Kata Kunci: Kredit; Lembaga Keuangan; Pendapatan; UMK; PSM;
Abstract
Micro and Small Enterprises (MSEs) are a business scale that dominates the national economy and the regional economy of Bali. Playing a strategic role, MSEs still have limitations in developing their businesses. One solution to overcoming this limitation is through additional capital through business credit lines from financial institutions. With additional capital, business actors can expand marketing, add production factors, improve output quality and so on. But on the other hand, the impact of credit also has a negative effect. Regular debt payments and additional payments through credit interest are the things that affect the smoothness of the company's financial balance. This study aims to determine the impact of credit on MSE income in Bali. The data used are SE2016-Advanced and PODES (BPS) data. The research method uses the analysis technique Propensity Score Matching (PSM). Based on processing results, credit has a significant positive impact on MSE income.
Keywords: Credit;Financial Institution;Income;MSE;PSM
INTRODUCTION
Indonesia's economy before the Covid-19 pandemic recorded year-on-year growth in the range of 5-6 percent (BPS, 2021). Despite the fluctuating movements, the growth is always at a
positive level. This shows that the creation of economic added value that occurs from year to year is recorded to always increase (OECD, 2009). The success of improving economic
conditions is certainly also a reflection of the success of all production activities in Indonesia. Based on data from the Central Statistics Agency (BPS), the perpetrators of production activities in Indonesia are mostly Micro Small Enterprises (UMK). The 2016 Advanced Economic Census (SE2016-Lanjutan) recorded the number of UMK actors reaching more than 26 million businesses or about 98.68 percent of the total nonfarm business in Indonesia. In addition to dominating in terms of quantity, the contribution and amount
of UMK income to the value of Gross Domestic Product (GDP) was also recorded to increase. The Ministry of Cooperatives and MSMEs in the period 2010-2015, recorded an average contribution of MSMEs to GDP increased by 0.95 percentage points every year, while for the average income increased by 67.57 trillion rupiah annually. Despite changes in the basic year tally in the next period of time, both indicators still look to continue to increase.
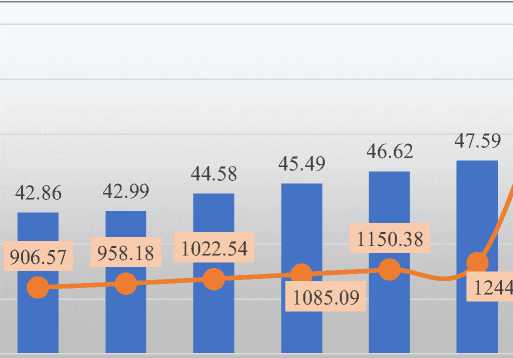
4077.29 4283.60
3859.75
2010 2011 2012 2013 2014 2015 2016 2017 2018
^H Share Berlaku Thd PDB (%) →- NTB UMK (Triliun Rupiah)
47.2
47.37
Source: Kementerian Koperasi dan UMKM;
Ket : 2015 ke 2016 terjadi perubahan penghitungan tahun dasar
-
Figure 1. UMK's Contribution to GDP and Umk's Economic Added Value On the Basis of Constant Prices in Indonesia,2010-2018
Having a strategic role in the economy, umk is expected to be able to develop and maintain its business continuity (Olexandr et al, 2020). One solution is to add business capital through the search for credit from financial institutions. The Indonesian government itself has an obligation to overshadow the needs of the UMK. The Law of the Republic of Indonesia Number 20 of 2008 concerning MSMEs states that the government is obliged in business development, financing of funds and financial guarantees for all MSMEs. Sollow and Swan in Arsyad (2010) indicated that credit acceptance can be an investment so as to accelerate the development of capital stock volumes. The higher
the capital ratio, the higher the production capacity. Thus, in theory it would end up with an increase in the company's revenue. But on the other hand, credit acceptance It can also affect the financial balance of the company's balance sheet assets (Shamsuddin, 2004). The obligation of the recipient of the credit means also having to pay off his debt within a certain period of time (Cashmere, 2007). In addition, the amount returned is also accompanied by loan interest that causes the amount of return must be greater than the amount of the loan. This makes credit acceptance have two oppositeimpacts.
Based on SE2016-Advanced data, Bali Province became the area with the highest
number of umk credit recipients in Indonesia. In 2016, the percentage of umk who get credit in this region was recorded at 18.79percent, while nationally it was recorded at 11.70 percent. In accordance with these conditions, Bali becomes the most ideal area to be used as credit impact research.
RESEARCH METHODS
This study uses secondary data from BPS Bali Province, namely SE2016-Advanced data and Village Potential (PODES) data. SE2016-Lanjutan is an advanced data enumeration activity from the Economic Census held in 2016. The data processed amounted to 31,969 business units with additional weighing so as to be able to analyze the population level of UMK in Bali. Village potential data is used to distinguish urban and rural areas so that these conditions can be one of the control variables in PSM. SE2016-Advanced data has data year coverage in 2016 and is the most recent data bps related to the absence of credit acceptance conditions.
The analysis technique used is Propensity Score Matching (PSM). The PSM method is used because the data condition is not paneled (only one year period) and this method is statistically able to assess the difference in the impact of being treated or not treated. In addition, PSM is also one of the methods of evaluating the impact of treatment that is not random and able to overcome the problem of selection bias through the matching process (Rosenbaum & Rubin, 1983). PSM designs control groups based on the characteristics of the data observed as a probability base for the basis of the matching process. UMK who gets treatment (credit recipient) is matched or compared to UMK who does not get treatment (not a credit recipient). Based on this approach, there is no need to compare one by one UMK who receive credit or who do not receive credit based on observation values of exactly the same magnitude (Heckman, 1997). But matching is done based on probability
values calculated based on observation values. The PSM equation formula is shown as follows (Angrist &Pishcke, 2008).
l'=oc +βTi+γAi + μi
Where Y indicates the result of a score,is an interception, is the impact of credit receipts from financial institutions and is the effect of variable controls. The control variables used in this study are the age of the entrepreneur, the level of education of the entrepreneur, the length of business, business network, computer usage status, certification ownership status, haki ownership status, business management system, cooperative participation status, business area (city / village) and the number of workers.cWiYAi
The validity of the PSM method takes into account two conditions, namely:
-
1. ConditionalIndependence, a condition in
which control variables are not affected by the or absence of treatment
-
2. There is good common support between
participants who get treatment and those who do not get treatment (Khandker, Koolwal &Samad, 2010)
In equation, asumsi Conditional
Indendence is interpreted into the following formulas:
⅛rΛf)∙-^l¾
Where presenting UMK who receives credit, while is UMK who does not receive credit.
yT
Meanwhile, to obtain a Treament on
Treated (TOT) value, the necessary assumptions are recorded weaker, namely
Uc)-^l^
The second assumption related to common support that is required to meet good or satisfactory conditions. With these conditions, the comparison of the two groups can be matched and accounted for statistically. Theformula is written as follows:
(0 < p(τi = 1∣X1) < 1)
For tot calculations, the formula can be further widened or made easieragain, namely with the followingequations:
(P{Ti = l∣Xi) < 1) results are any difference or poor matching
Once both assumptions are met, the TOT quality, it is advisable to take steps at the can be calculated. The formulaic equation can be beginning back until you get satisfactory written as follows: matching quality.
TOTpsm = EP(X)MYT = 1,P(X)] - E(Yc∖T = O, P(X)]}
In the steps of the PSM method, the first step is to estimateits propensity score. There are two stages in this first step, namely determining the model and the variables that must be included in the model (Caliendo & Kopeinig, 2008). The type of model used in this study is the logit model.
The second step is to determine the matching algorithm. There are five algorithms: Nearest Neighbour (NN) Matching, Radius Matching, Stratification matching, Kernel Matching and Weighting Matching. Among these methods there is no superior method there is only a trade off process between bias and variance in estimating the estimated value of ATT. In this study, the Nearest Neighbour algorithm was chosen as the main algorithm,while several other algorithms forrobustnesstests.
The final step in the PSM method isthe matchingqualityassessment. Uji standardized bias, different tests before and after matching(t-test),and quality tests of combining variables in a matched sample (F-test/HotellingTest) into several stages tested in this last step. In terms of results, good matching quality showed no significant difference in the sample group used. While if the
RESULTS AND DISCUSSIONS
Table 1 shows that there are 87,355 companies or about 18.8 percent of the total UMK has received credit from financial institutions. In addition, the credit position given by Commercial Banks to UMK always increases every year. The average credit increase is around 1.99 trillion rupiah. Thus, the government's expectations in increasing UMK output are getting higher but the impact related to credit receipts on UMK in Bali is still not scientifically available.
Based on the number of UMK who receive credit compared to those who do not receive credit in table 1, nantinya will be done matching(matching) between the two so that it can be known theimpact of crediton UMK income. Basic matching uses the control variables described in the previous section. Meanwhile, the resulting probit propensity score model based on the research control variables is presented in table 2.
Tabel 1.
UMK company Menerima Kredit and Tidak Menerima Kredit from Lembaga Keuangan
|
UMK Credit Recipients |
UMK Is Not a Credit Recipient |
Total |
|
87.355 |
377.432 |
464.787 |
Sumber: SE2016-Advanced Data Processed Researchers
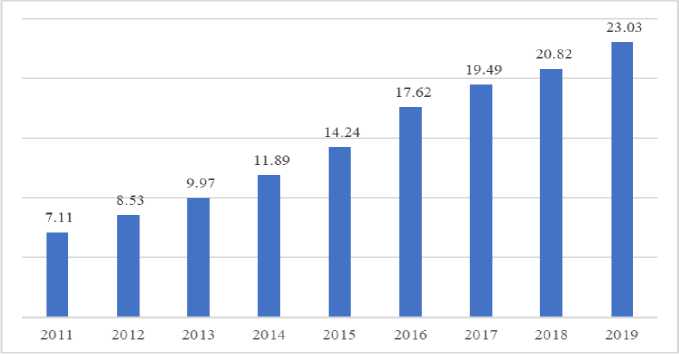
Source: Bank Indonesia
Figure 2. UMK Credit Position given by Commercial Bank (trillion rupiah)
Tabel 2.
|
Credit Receipt Probit Model |
Estimasi Parameter | |
|
Variabel Kontrol |
Koefisien |
Standar Error |
|
Umur Pengusaha |
0,0795 |
0,0358 |
|
Jenjang Pendidikan Pengusaha |
-0,0641 |
0,0095 |
|
Lama Usaha |
-0,0483 |
0,0095 |
|
Jaringan Usaha |
-0,3541 |
0,0851 |
|
Penggunaan Komputer |
0,0090 |
0,0267 |
|
Kepemilikan Sertifikasi |
-0,0956 |
0,0610 |
|
Kepemilikan Haki |
0,0402 |
0,0852 |
|
Sistem Pengelolaan Usaha |
0,0126 |
0,0328 |
|
Partisipasi Koperasi |
-0,0724 |
0,0305 |
|
Wilayah Usaha |
-0,0467 |
0,0206 |
|
Jumlah Tenaga Kerja |
-0,1963 |
0,0710 |
|
_Konstan |
1,2077 |
0,2755 |
Source: STATA ProcessedResults;
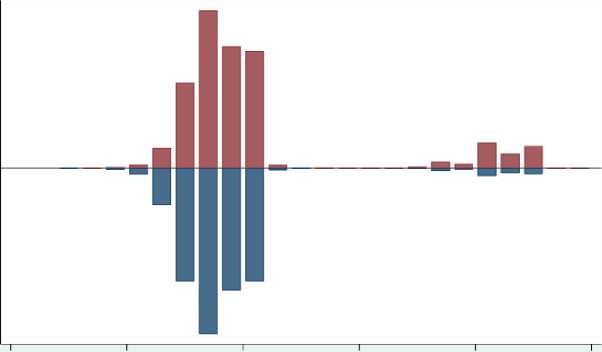
Based on the coefficients in the probitmodel, the business network variable becomes the variable that has the most influence in estimating propensity score. In contrast, the weakest computer usage variables. Meanwhile, from the interpretation of figure 2,the propensity score checkgraph shows good common support quality. This is seen from the comparison of the length of the umk group chart that gets treatment (credit recipients) with those who do not get treatment proportionally have the same length. Likewise from the results of stata processed
property balance (figure 3)that shows the results in line. The balance property results are declared satisfactory so that it can be continued to the matching stage with the Near Neighbour (NN) algorithm. The number of blocks created as many as 6 blocks, meaning that there are 6 blocks that can be optimally juxtaposed between the umk unit of the credit recipient with the non-recipient of credit (there is no significant difference in the propensity score between the credit recipient (code 0 credit access) with those who do not receive credit (code 1 credit access) in each block.
O .1 .2 .3 .4 .5
Propensity Score
^^∣ Untreated ^^∣ Treated
Source: STATA ProcessedResults;
-
Figure 2. Distribution of Propensity Score Credit Receipts
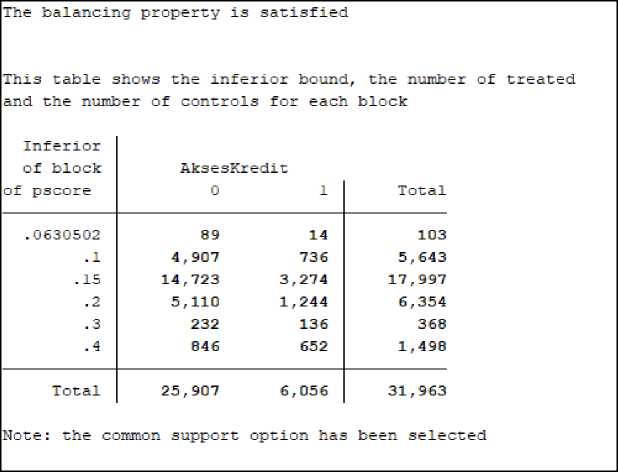
Source: STATA ProcessedResults;
-
Figure 3. Test Balancing Property Score Results
Based on the results of matching with the NN algorithm, the processed results showed a test value of 17.35. It states that the resulting model is significant at a 95 percent confidence level. In
addition, the average treatment effects on the treated (ATT) score from the test results was recorded at 0.37. Thus, the impact of credit has a significant positive effect in increasing UMK revenue by 37 percent.
ATT estimation with Nearest Neighbor Matching method (random draw version)
Analytical standard errors
|
n. |
treat. |
n. |
contr. |
ATT |
Std. Err. |
t |
|
6056 |
25044 |
0.370 |
0.021 |
17.350 |
Note: the numbers of treated and controls refer to actual nearest neighbour matches
Source: STATA ProcessedResults;
-
Figure 4. ATT Credit Impact on UMK Revenue with NN Matching Algorithm
Matching tests with other algorithms, stratification, kernel and radius are also used. The move was made for robust (robust) testing of psm models. Of the overall test results of the matchingalgorithm, the whole obtained a significant t value at a confidence level of 95 percent. Thus, the psm model of research can be said to be tough(robust).
|
ATT estimation with the |
Stratification method JZS | |||
|
Analytical |
Standard errc | |||
|
n. treat. |
n. contr. |
ATT |
Std. Err. |
t |
|
6056 |
25907 |
0.396 |
0.021 |
19.170 |
Source: STATA ProcessedResults;
Figure 5. ATT Credit Impact on UMK Revenue with Strata Matching Algorithm
|
ATT estimation with the Bootstrapped standard eι |
Kernel Matching rrors |
method | |||
|
n. treat. n. |
c□ntr. |
ATT |
Std |
Err . |
t |
|
6056 |
25907 |
0.414 |
0.022 |
19.221 | |
Source: STATA ProcessedResults;
Figure 6. ATT Credit Impact on UMK Revenue with Kernel Matching Algorithm
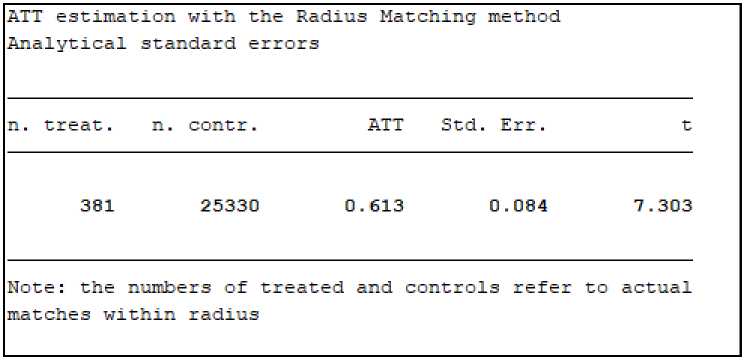
Source: STATA ProcessedResults;
Figure 7. ATT Credit Impact on UMK Revenue with Radius Matching Algorithm
CONCLUSIONS AND SUGGESTIONS
The entire study used the PSM method in measuring the impact of credit from financial institutions on UMK income. The test results stated that credit was able to increase UMK
revenue positively significantly. With a confidence level of 95 percent, credit is able to increase UMK revenue by 37 percent. The results of this study are also in line with the results of similar studies at home (Stefani;2010,
Hurricane;2013, Sri;2017 & Rosnita;2019) and abroad (Pham et al;2011 & Dadson et al;2012). With the opportunity that is able to increase business income, credit capital if it can also be an aid that can improve the welfare of business actors. Even in studies in countries that are quite backward, credit is declared able to be a helper for pre-welfare families to get out of the poverty line (Victor et al;2018, Tomi;2015, Kibet et
al;2015, Choudhury et al;2017 & Mehran et al;2018). Of course, this can be a reference for the government to become a policy. Credit when compared to Cash Direct Assistance (BLT) has the advantage of the existence of a basic capital return factor so that the financial process can rotate and become sustainable business capital for other entrepreneurs.
Researchers realize that there are still various limitations in this study, such as 1) The PSM method still has the possibility of biased statistical results due to the comparison process between treatment groups. Nevertheless, with the existing data conditions, this method becomes the best choice; 2) Further research is needed regarding the measurement of the effectiveness of the amount of credit given to UMK. This becomes important because the higher the credit loan, the higher the probability of profits and losses on the company's balance sheet. In addition, various further studies related to credit in the current condition are felt increasingly needed. With the condition of the Covid-19 pandemic that occurred and the high expectations of business actors related to additional business capital (Covid-19 Impact Survey on Business Actors; BPS, 2020), various advanced information related to business credit should be strategic information for the government in determining policy.
REFERENSI
Angrist, J. D. & J. S. Pischke. (2008). Mostly Harmless Econometrics : An Empiricist’s Companion. Massaschusetts Institute of
Technology and The London School of Economics
Arsyad, L. (2010). Ekonomi Pembangunan.
Yogyakarta: UPP STIM YKPN
Badan Pusat Statistik Provinsi Bali. (2019). Analisis Hasil SE2016 Lanjutan Potensi Peningkatan Kinerja Usaha Mikro Kecil di Provinsi Bali. Denpasar
Badan Pusat Statistik Provinsi Bali. (2020). Hasil Survei Dampak Covid-19 Terhadap Sosial Demografi dan Pelaku Usaha Provinsi Bali 2020. Denpasar
Badan Pusat Statitistik Republik Indonesia. (2019). Analisis Hasil SE2016 Lanjutan Potensi Peningkatan Kinerja Usaha Mikro Kecil. Jakarta
Caliendo, M., & Kopenig, S. (2005). Some Pratical Guidance for the Implementation of Propensity Score Matching. IZA Institute for the Study of Labor, Discussion paper no. 1588
Heckman, G.J. (1997). Dunkl Operators. Asterisque, 245, 223-246
Kasmir. (2007). Dasar-Dasar Perbankan. PT Raja Grafindo Persada, Jakarta
OECD. (2009). National Accounts of OECD Countries 2009. Volume I, Main Aggregates, OECD Publishing
Olexandr Yemelyanov, Tetyana Petrushka, Anastasiya Symak, Olena Trevoho, Anatolii Turylo, Oksana Kurylo, Lesia Danchak, Dmytro Symak & Lilia Leysk. (2020). Microcredits for Sustainable Development of Small Ukrainian Enterprises: Efficiency,
Accessibility, and Government Contribution. Sustainability 2020, 12, 6184
Parker, S.C. (2009). The Economics of Entrepreneurship. Cambridge University
Press, New York
Rosenbaum, P.R. & Rubin, D.B. (1983). The Central Role of The Propensity Score in Observational Studies for Causal Effects. Biometrika, 70(1), 41-55.
https://doi.org/10.1093/biomet/70.1.41
Syamsuddin Lukman. (2004). Manajemen Keuangan Perusahaan. PT Raja Grafindo Persada, Jakarta
Tambunan, Tulus T.H. (2011). Development of Micro, Small and Medium Enterprises and Their Constrains: A Story from Indonesia.Gadjah Mada International Journal of Business Vol. 13, No. 1 (January – April 2011): 21 - 43
Undang-undang Republik Indonesia Nomor 20 Tahun 2008 Tentang UMKM
303
Discussion and feedback