Planning Consistency and the Political Budget Cycle in Indonesia
on
Vol. 14 No.2, Agustus 2021
ISSN : 2301-8968
JURNAL
EKONOMI KUANTITATIF
TERAPAN
The The Impact of COVID-19 on FinTech Lending in Indonesia: Evidence From Interrupted Time Series Analysis
Abdul Khaliq
The Analysis of Willingness to Pay (WTP) Visitors to The Development of Rafting Toutism in Serayu Watershed nobel sudrajad, waridin, jaka aminata, indah susilowati
The Dynamics of Exchange Rate, Inflation, and Trade Balance in Indonesia
Yon Widiyono, David Kaluge, Nayaka Artha Wicesa
PROVINCE Analysis of Financial Institutions Credit Impact on MSE Income in Bali Province Ksama Putra, Ni Putu Wiwin Setyari
Volatilitas inflasi sebagai fenomena kombinasi moneter-fiskal di Indonesia
Eli Marnia Henira, Raja Masbar, Chenny Seftarita
Planning Consistency and the Political Budget Cycle in Indonesia
Farina Rahmawati, Khoirunurrofik Khoirunurrofik
The Dynamics of Credit Procyclicality and Stability of Macroeconomics in Indonesia Ni Putu Nina Eka Lestari, Made Kembar Sri Budhi, I Ketut Sudama,
Ni Nyoman Reni Suasih, I Nyoman taun
Relatiomships Between Characteristic of Local Government and Website Based Financial
Gabriela Amanda Widyastuti, Dena Natalia Damayanti, Marwata
Balinese Indigenous Knowledge about Water : A Way to Achieve Water Sustainability
Amrita Nugraheni Sarawaty, I Wayan Gita Kesuma, I Gusti Wayan Murjana Yasa
The Relationship Among Economic Structure, Sectoral Workforce, and Community Welfare in Bali Province
I Nyoman Mahendrayasa
Halaman Denpasar ISSN
JEKT Volume 14 Nomor 2
243-431 Agustus 2021 2301-8968
pISSN : 2301 - 8968
JEKT ♦ 14 [2] : 327-350
eISSN : 2303 - 0186
Planning Consistency and the Political Budget Cycle in Indonesia:
Simultaneous Regional Elections in 2017 and 2018
Farina Rahmawati Khoirunurrofik
Pemalang Regency Local Govermet Universitas Indonesia
ABSTRACT
This study aims to find empirical evidence of the relationship between planning and the practices associated with political budget cycles in Indonesia, with reference to the simultaneous regional head elections held in 2017 and 2018. A fixed-effect method using least-square dummy variables analyzes the role of planning in the relationship between local-government spending and political budget cycle behaviors. The results indicate that consistency between planning and budgeting can control the discretion applied by regional heads to increase and decrease budget expenditure in the two years before an election, one year before an election and in the election year itself. The magnitude of these reductions or increases differs between types of expenditure. The association between planning and the political budget cycle is significant in the two years before an election for primary expenditure allocations and in a year before an election for allocations of capital expenditure, social assistance, and grants and subsidies.
Keywords: political budget cycle, planning consistency, incumbent, Indonesia, local election.
JEL Classification: H72, H75
INTRODUCTION
Planning plays an important role in realizing development goals that are formulated with clear and measurable targets in order to produce an effective
and efficient budget. However, the budget formulation process is closely related to the political process and so the resulting budget is very reliant on the activities and decisions of the politicians involved. To be effective,
budget formulation must be consistent with planning: the more synchronous and consistent the formulation, the better the government's performance will be and the more likely development goals are to be achieved. When entering a general election period, economic policy is often used to influence voting, in that the politicians who run the government and are entitled to compete in forthcoming election will behave opportunistically by using the budget they have access to for particular allocations (Klein & Sakurai, 2015; Chortareas, Logothetis, & Papandreou, 2016). In election years, incumbents running for office tend to increase certain spending to send out a “good signal” that reflects their performance (Nordhaus, 1975; Rogoff, 1990). It is therefore important that planning of budget needs is carried out to minimize the potential non-neutrality of stakeholder behavior in the budget process (Lee, 2014).
The absence of a study that explains the relationship between consistency and political budget cycle practices is the
motivation for this study, which aims to analyze the relationship between budget planning and trends in political budget cycle practices of local governments in Indonesia. Indonesia regulates simultaneous elections for regional heads in its implementation of regional autonomy policies including development planning and budgeting authority. This research hypothesizes that the consistency index for planning and expenditure as political budget cycle practices can be controlled. This study predicts a relationship between consistency and political cycles with lower budget expenditure.
As the world’s largest developing country (by population), Indonesia's political system is a young democracy with characteristics of low ideological division, loyalty to small parties, and the importance of money politics (Gonschorek, Schulze, & Sjahrir, 2018). Both communities and regional heads have opportunistic attitudes in taking advantage of the election period. Due to the high cost of regional elections, money politics, especially political
dowries and vote buying, cause rampant corruption in elections of regional heads.
To reduce or avoid campaign costs, an incumbent who has a budgetary function in local fiscal policy has an incentive to take advantage of certain budget components that will have the effect of attracting voters, such as grants, social assistance, and financial assistance (Sjahrir, Kis-Katos, & Schulze, 2013). In addition to the large discretion available to regional heads in regional election budgets, accountability at the regional level is still weak and democratization has not contributed significantly to reducing waste in regional government spending (Sjahrir, Kis-Katos, & Schulze, 2014). Budgetary order is one of the important solutions that can be built into the formulation of fiscal policy in the election period, regulated in a self-help budget institutional arrangement that involves the community in fiscal agreements (Sanchez, 2007). Accordingly, Indonesia has established the Regional Development Planning Consultation
(Musyawarah Perencanaan Pembangunan Daerah, known as Musrenbangda) in an effort to involve the community in the process of compiling a regional development plan that can then be used to produce a Regional Medium-Term Development Plan (Rencana Pembangunan Jangka Menengah Daerah or RPJMD). This process requires the regional government budget to be referred annually to the RPJMD. Synchronization and consistency of the budget with development planning requirements are essential to ensure appropriate performance of local governments in achieving targets and efficiency in their use of resources.
The first direct local-election implementation in Indonesia recognized political budget cycles in the regional government budgets allocated, especially for incumbents running again for election, together with increases in local-government expenditure in the categories of unexpected expenditure, subsidies, social assistance, financial assistance, interest, and grants (Sjahrir et
al., 2013). However, in regions led by elected regional heads, public investment decreased and the direct election process did not increase the accountability of local elites (Kis-Katos & Sjahrir, 2017). Direct elections have, however, increased local governments’ responsiveness, increasing expenditure directly related to the community, such as in the health sector (Skoufias, Narayan, Dasgupta, & Kaiser, 2014). During an election year, an increase in the health budget can be utilized by regional heads in enhancing the image they present to the community.
There are various studies on the political budget cycle in Indonesia had been conducted, such as Sjahrir et al. (2013); Skoufias et al. (2014); Pierskalla & Sacks (2018); and Wiguna & Khoirunurrofik (2021). This research expects to contribute to the literature in twofold analyses. First, this study provides new findings that indicate planning consistency can be correlated or related to expenditure allocations as a reflection of political budget cycle practices. Second, according to our knowledge,
this study is the first to provide evidence that there is a relationship between planning and expenditure realization during the election period in situations in which the incumbent can utilize the budget for their electoral interests.
This paper is organized as follows. The first section provides an overview of the importance of the research and its novelty. The second section presents literature reviews and the third section outlines the research methodology and data. The fourth section sets out our findings and discussion, followed by conclusions and implications in the fifth section.
RESEARCH METHODS
This research uses regional government annual APBD realization data from 2015 to 2019 and any data used relates to provincial, district, and city-level participants in the 2017 and 2018 regional elections, and to the consistency of RKPDs with localgovernment RPJMDs for the period 2016
to 2019. This study uses fixed-effect panel data in which the localgovernment entity (province, district, or city) has different budget characteristics for each year, producing individual
specific effects following the research of Sjahrir et al. (2013), Chortareas et al. (2016) and Wiguna & Khoirunurrofik, (2021).
Table 1. Description of variables
|
Dependent variables | ||||
|
Variable |
Description |
Unit |
Source | |
|
GOVEXi,t |
1. Realization of sub-personnel expenditure (billion |
Logarithmic |
Ministry |
of |
|
rupiah)
|
Finance | |||
|
(billion rupiah) | ||||
|
Independent variables | ||||
|
CONSi,t |
RKPD consistency index against RPJMD |
Ministry Home |
of | |
|
Affairs | ||||
|
DEY i,t-2 |
Dummy variable (1 = two years before the election, 0 = |
Dummy | ||
|
other) |
variable | |||
|
DEY i,t-1 |
Dummy variable (1 = one year before the election, 0 = |
Dummy | ||
|
other) |
variable | |||
|
DEY i,t |
Dummy variable (1 = year before the election, 0 = other) |
Dummy variable | ||
|
DInc i, t |
Dummy variable of the participation of regional heads in |
Dummy |
KPU | |
|
regional elections (1 = running for themselves, 0 = not) |
variable | |||
|
DWin i, t |
Dummy variable of incumbent regional head's victory (1 = |
Dummy |
KPU | |
|
win, 0 = no) |
variable | |||
|
DPartyi,t |
Dummy variable of affiliated political party (1 = affiliated |
Dummy |
KPU | |
|
with a political party supporting the national government, 0 = other ) |
variable | |||
|
TOTREVi,t |
Total revenue (billion rupiah) |
Logarithmic |
Ministry Finance |
of |
|
LOCREVi,t |
Local revenue (billion rupiah) |
Logarithmic |
Ministry Finance |
of |
|
GRDPi,t |
Gross regional domestic product (billion rupiah) |
Logarithmic |
BPS | |
|
POP i, t |
Total population (million people) |
People |
BPS | |
|
POV i, t |
Number of poor people (million people) |
People |
BPS | |
|
OURi,t |
Open unemployment rate |
BPS | ||
|
HDIi,t |
Human development index |
BPS | ||
|
SERVANT i, t |
Number of national public ASN (hundred people) |
People |
BPS | |
DISASTERi,t Number of disasters Source: authors’ results
However, there are time invariance variables in this study; namely, the variables whose values do not change over time are the incumbent and winning variables. To address this concern, least-squares dummy variables (LSDV) analysis is used with ordinary least squares (OLS) estimation, incorporating the time-effect element so that the individual variable is not constant over time. The effect of the time effect is calculated by adding an individual dummy to avoid the trap of dummy variables, namely, conditions where perfect collinearity occurs (Gujarati, Porter, & Gunasekar, 2012). The equation model in this study can therefore be written as follows:
BPS
log GOVEXi,t = β0 Di,t + β1 CONSi,t
+ β2DEYi,t-2 + β3DEYi,t-l + β4DEYi,t
+ β5DInci,t + ββDEYi,t-2xDInci,t
+ β7DEYi,t-1xDInci,t + β8DEYi,txDInci,t
+ β9DEYi,t-2xDInCi,t xCONSi,t
+ β10DEYi,t-1xDInci,t xCONSi,t
+ β11DEYi,txDInci,t xCONSi,t + β12DWinit
+ β13 DPartyit + β14 log TOTREVi,t
+ β15log LOCREVit + βi6log GRDPi,t
+ β17POPi,t + β18POVi,t + β19OURi,t
+ β20HDIit + β21SERVANTit
+ β22DISASTERi,t
+ Si,t (1)
where GOVEXi,t are the logs of personnel expenditure, capital expenditure, social expenditure, education expenditure, health expenditure, and infrastructure expenditure in regional government i year t; Di,t is an individual dummy; CONSt,t is the consistency index of RKPD to RPJMD in local government i year t; the possibility of finding political budget cycles if the values β6, β7, and β8 are positive and statistically different from 0; the relationship between the consistency of planning in the election year effect is indicated by the values β9, β10, and β11; and εi,t is the error term.
The main variable interacts with the incumbent dummy variable and the election year effect to answer the research questions. This process aims to look at the substantive relationship between planning and regional government budgeting in the year before the local election, during localelection administration, and after the election, to identify whether it is influenced by the incumbent regional head running again for election. In the econometric model, control variables are used, namely regional characteristics such as population, regional income, and number of employees, and the level of community welfare, such as human development, poverty, unemployment, and number of disasters.
This study uses government expenditure (GOVEXi,t ) as the dependent variable to reveal the political budget cycle, as in the study by Sjahrir et al. (2013) that uses local-government spending by categorizing administrative expenses and other expenses. This study uses personnel, capital, and social spending data (social assistance, grants,
and subsidies) because this type of expenditure is the largest area of discretion for regional heads in regional elections (Sjahrir et al., 2013; Pierskalla & Sacks, 2018). In addition, this study also references local-government budgets for education, health, and infrastructure, because these three budget functions are closely related to essential public services and are the favorites for regional heads to use in their efforts to attract voters. The election effect in this study (DEYi,t-2, DEYi,t-ι, DEYi,t) refers to Sjahrir et al.’s (2013) study that divides the two preelection and election years. Voters do not see the development results of the budget expenditure plan directly (Nordhaus, 1975); therefore, to deliver investment returns to voters in the campaign year, politicians must budget fiscal spending two years before the election.
The selection of control variables that reflect economic conditions is based on the regional income variables TOTREVi,t, LOCREVi,t') as used in the study by Bonfatti and Forni (2019).
These are chosen because all localgovernment expenditures are highly correlated with the amount of regional income. This approach is used because the realization of local-government budget will have a large impact and influence on the performance of the regional economy as reflected in the gross regional domestic product GRDPiit (Sjahrir et al., 2013; Wiguna & Khoirunurrofik, 2021).
The control variable that reflects political conditions is the variable status of the incumbent Dlncif, as used in the study of Klein and Sakurai (2015) which measures the possibility of fiscal policy being carried out by a first-period regional head who is allowed to run again. The winning incumbent variable (DWini,t) is applied because the incumbent uses fiscal policy to increase popularity (Eryilmaz & Mercan, 2015). The more opportunistic the incumbent is prepared to be in order to win, the more they will take advantage of fiscal policy. The political parties variable (DPartyi,t) is used in this study because regional heads who are not affiliated to
national political parties cause a cycle of expenditure in election year budgets motivated by election administration.
The selection of variables based on demographic conditions is as follows: the population variable ((POPi,t ) is used in this study because population size affects the level of demand for government services, which in turn is reflected in the amount of budget expenditure (Klein & Sakurai, 2015); the unemployment rate variable (OURi∣t) is used because a higher rate of unemployment in the community will encourage local governments to issue social assistance to alleviate poverty levels through means such as providing grants. Moreover, we add the the human development index variable (HDliit) to measure the human capital of people in the region. The study also uses a control variable for the amount of ASN (SERVANTit), because the number of ASNs can be correlated with the amount of sub-expenditure on personnel. Finally, the number of poor people (POVi∣t) and the number of
disasters (DISASTER^) are used because
these variables can correlate with changes in provision for the poor and for local-government social programs, such as providing social assistance, giving grants, and providing subsidies in the event of disasters.
RESULTS AND DISCUSSION
The variable of interest, namely the consistency index of RPJMD/RKPD, has an average of 82.17, with a minimum value of 41% for Central Java Province in 2018 and 100% for Central Java
Province in 2019, 2017, and 2016, DKI Jakarta Province in 2017 and 2019, and West Java Province in 2016 and 2017. The standard deviation of 11.33 means that the maximum increase and decrease in the consistency variable mean is ± 11.33%. The coefficient of variation of the consistency variable is 0.14%, i.e. the data is close to being homogeneous. Table 2 presents the data on the average consistency of RPJMD/RKPD.
Table 2. Summary statistics
|
Variables |
Statistics | |||||
|
Note |
Min |
Mean |
Max |
Std. dev. Coef. | ||
|
Personnel expenditure |
1040 |
93.13 |
768.62 |
21852.42 |
1380.70 |
1.79 |
|
Capital expenditure |
1040 |
35.43 |
440.57 |
14118.61 |
780.93 |
1.78 |
|
Social expenditure |
1040 |
0 |
313.83 |
20102.04 |
1273.93 |
4.06 |
|
Education expenditure |
1040 |
1.59 |
597.09 |
16153.35 |
1324.71 |
2.22 |
|
Health expenditure |
1040 |
0.30 |
269.86 |
8936.16 |
525.23 |
1.95 |
|
Infrastructure expenditure |
1040 |
0 |
299.96 |
15436.75 |
752.18 |
2.51 |
|
Consistency |
1040 |
41 |
82.17 |
100 |
11.33 |
0.14 |
|
Total revenue |
1040 |
56.38 |
2402.59 |
64823.89 |
4844.98 |
2.02 |
|
Local revenue |
1040 |
1.87 |
723.29 |
43901.49 |
3102.71 |
4.29 |
|
Elect-2 |
1040 |
0 |
0.25 |
1 |
0.43 |
1.73 |
|
Elect-1 |
1040 |
0 |
0.25 |
1 |
0.43 |
1.73 |
|
Elect |
1040 |
0 |
0.25 |
1 |
0.43 |
1.73 |
|
Incumbent |
1040 |
0 |
0.64 |
1 |
0.48 |
0.75 |
|
Winning |
1040 |
0 |
0.45 |
1 |
0.49 |
1.11 |
|
Party |
1040 |
0 |
2.21 |
4 |
1.77 |
0.79 |
|
GRDP |
1040 |
174.98 |
68225.96 |
2840828 |
247345 |
3.62 |
|
Population |
1040 |
0.01 |
1.34 |
48.68 |
4.56 |
3.42 |
|
Poverty |
1040 |
1.23 |
146.64 |
4789.12 |
494.10 |
3.37 |
|
OUR |
1040 |
0.11 |
5.16 |
17.05 |
2.69 |
0.52 |
|
HDI |
1040 |
26.56 |
68.54 |
86.65 |
6.54 |
0.95 |
|
Servant |
1040 |
10.05 |
141.52 |
4143.14 |
398.06 |
2.81 |
|
Disaster |
1040 |
0 |
18.89 |
2741 |
104.39 |
5.52 |
Source: authors’ results
92
90
88
86
84
82
80
Average Consistency Index
78
76
74
2016
2017
2018
2019
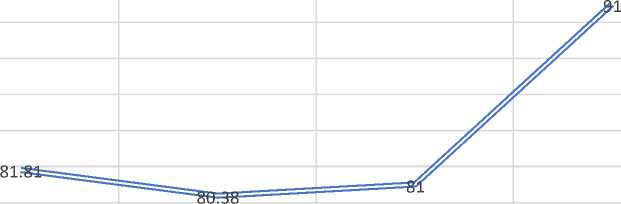
Figure 1. Average consistence of the 34 provinces in Indonesia
Source: Ministry of Home Affairs, 2019
Figure 1 shows that during the four-year period of 2016 to 2019, the lowest national average consistence was in 2017, namely 80.38 then increasing in 2018 to 81. The average level of consistency of the RPJMD toward localgovernment RKPD in Indonesia increased significantly in the 2019 fiscal year, reaching a value of 91. For local governments that carried out the 2017 local election, 2019 is the second year of implementing the RPJMD, while local governments that held 2018 local elections, 2019 is the third year of implementing the RPJMD. Increasing the planning consistency index can be
interpreted as an effort to achieve the regional head's vision and mission through the RKPD being adjusted to match the program listed in the RPJMD, after becoming an elected regional head. The 2017 local election was held by 96 regional governments and the 2018 election by 164 local governments, as presented in Table 3. In terms of regional heads' participation in local elections, several variables are shown in the table below (Table 4), which compares average regional government spending between regional heads who are running for re-election and regional heads who do not run again.
Table 3. Incumbent performance in local elections
|
Selection type |
Number of regions |
Total |
Incumbent Win |
Lose | |
|
2017 |
2018 | ||||
|
Governor election |
7 |
17 |
15 |
8 |
7 |
|
Mayor election |
18 |
36 |
42 |
31 |
11 |
|
Regent election |
71 |
111 |
109 |
77 |
32 |
|
Total |
96 |
164 |
166 |
116 |
50 |
Source: authors’ results
Table 4. Comparison of the mean of several variables (Rp billion)
|
Variables Running (1) Incumbent Not running (0) | ||
|
Personnel expenditure |
823.32 |
672.02 |
|
Capital expenditure |
463.63 |
399.84 |
|
Social expenditure |
373.32 |
208.77 |
|
Education expenditure |
621.67 |
519.62 |
|
Health expenditure |
286.74 |
217.46 |
|
Infrastructure expenditure |
327.00 |
252.18 |
|
Consistency |
81.74 |
82.95 |
|
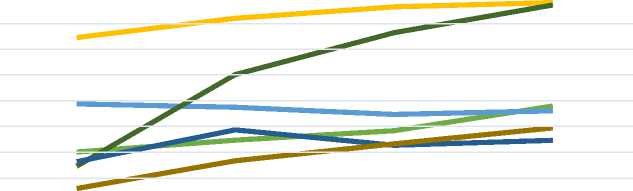
Source: authors’ results Regional governments that are led by regional heads who run again have a higher average (mean) amount of personnel expenditure, capital expenditure, social spending, education expenditure, spending on health functions, and spending on infrastructure functions than regions led by regional heads not participating in the regional head elections. If further analyzed, as shown in Figure 2, the |
government spending led by regional heads who run again for the two years before the local election, one year before the local election, the year for the local election, and one year after the election can be seen. While the average expenditures for personnel, social, capital, education, and health have increased over the years, the average capital and infrastructure expenditures decreased during the election year | |
trend of the average regional (Elect).
1000
900
800
700
600
500
400
300
200
100
|
0 |
Elect-2 |
Elect-1 |
Elect |
Elect+1 |
|
Social |
296.5 |
343.1 |
378.5 |
475.2 |
|
Capital |
483.6 |
470.6 |
442.8 |
457.4 |
|
Personnel |
740.7 |
815.2 |
861 |
876.4 |
|
Education |
241.6 |
596.9 |
759.8 |
866.9 |
|
Infrastructure |
259.5 |
382.9 |
323.3 |
342.37 |
|
Health |
155.8 |
264 |
328.6 |
390.7 |
Figure 2. Average expenditure comparison (Rp billion)
Source: authors’ results
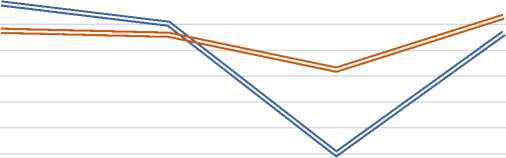
In addition to the differences in average expenditure, Table 4 shows that the average consistency index value of local governments led by incumbents who ran again was lower, namely 81.74, compared to regions led by regional heads but did not run again, namely 82.95. From Figure 3, it can be seen that in the year the regional head elections were held, the average value of the consistency index of regional
governments led by regional heads who ran again decreased sharply to 73.97% compared to regions led by regional heads who did not run again at 80.49 %. This indicates that there were programs in the RKPD in the year the elections were held that were not in accordance with the existing programs in the RPJMD, leading to a fall in the consistency index in that year.
88
86
84
82
80
78
76
74
72
70
|
68 |
Elect-2 |
Elect-1 |
Elect |
Elect+1 |
|
Incumbent=1 |
85.61 |
84.05 |
73.97 |
83.32 |
|
Incumbent=0 |
83.51 |
83.19 |
80.49 |
84.59 |
Figure 3. Average consistency comparison Source: authors’ results
Political budget cycle behavior in personnel spending, capital expenditure, social spending, education budgets, health budgets, and infrastructure budgets can be revealed by analyzing the data through the coefficient values of the Elect-2 x Incumbent, Elect-1 x Incumbent, and Elect x Incumbent interaction variables, as shown in Tables 5 and 6. Overall, the
coefficient value is positive where in the two years before the local election, one year before the local election, and the year of the election there was an increase in local-government spending on personnel, capital expenditure, social assistance, grants and subsidies, education, health, and infrastructure, except in the two years before the election for the health budget.
Table 5. Dummy election year and dummy incumbent estimation coefficients
|
Dependent variable |
Log of personnel expenditure |
Log of capital expenditure |
Log of social expenditure |
|
Variables |
Model (4) |
Model (4) |
Model (4) |
|
Elect-2 x Incumbent |
0.1044*** |
0.0651 |
0.0579 |
|
(DEYi't-2xDInci't) |
(0.0307) |
(0.0436) |
(0.1375) |
|
Elect-1 x Incumbent |
0.0418 |
0.0849** |
0.2158 |
|
(DEYi,t-ιxDInci,t) |
(0.0305) |
(0.0432) |
(0.1360) |
|
Elect x Incumbent |
0.0354 |
0.1240*** |
0.1814 |
|
(DEYitxDInciιt) |
(0.0315) |
(0.0447) |
(0.1407) |
Significant coefficient: * p < 0.10; ** p < 0.05; *** p < 0.01. Source: authors’ results
In personnel spending, the three interaction variables indicate an increase in personnel spending in the two years before the election of 10.44%, one year before the election of 4.18%, and the year of the election of 3.54% for local governments led by regional heads who run again. It can thus be said that there was a political budget cycle in the employee expenditure budget in the two pre-election years and that it was statistically significant. Increasing personnel expenditure is one way for incumbents to attract the attention of employees who are also voters in the regional elections. As one example, a significant increase in personnel spending in the two years before the elections occurred in the form of Regional Performance Allowances (TKD) for civil servants in several regions. The steps to increase TKD are in line with efforts to improve the bureaucracy in terms of the welfare of the apparatus, although at the same time it has a beneficial value for the incumbent in gaining the sympathy of
voters from the ASN sector if they compete in the elections.
An increase in personnel spending in this study is also in line with the findings of Skoufias et al. (2014) and Wiguna and Khoirunurrofik (2021). Their findings show the results of an increase in employee expenditure in the election year that was put in place because candidates could “buy” political support around election time by increasing employee welfare, so that employees felt satisfied with the performance of the regional head. In addition, politicians pay great attention to the composition of employee spending because employees can influence policy during the election period and influence election results (Huber, 2016). However, an increase in personnel spending in an election year contradicts a study by Pierskalla and Sacks (2018) which found a decrease in personnel spending in the election year in regions led by incumbents running for regional elections.
For capital expenditure, the three interaction variables indicate an increase two years before the election of 6.51%, one year before the election of 8.49%, and in the year of the election of 12.4% for local governments led by regional heads who run again. It informs that there is a significant political budget cycle in the capital expenditure budget one year before the election and the year the election is held. There was an increase in capital expenditure one year before the local election and the election year, one of which was due to the delayed completion of development, so that in the last year of the regional head's term of office, the development programs contained in the RPJMD were completed to pursue targeted achievements.
The findings of this study are in line with those of Klein and Sakurai (2015) and Wiguna and Khoirunurrofik (2021) which indicate that incumbents reduce local tax revenues and adjust budget composition by increasing capital expenditure while maintaining the budget deficit at the same level. Capital spending requires the support of very
strong regional heads, even though an increase in capital spending is also often associated with increased corruption, especially when it is coupled with weak audit results (Lewis & Hendrawan, 2019). Supervision of capital spending in the election year therefore needs to be improved. Studies indicating a decrease in capital spending in an election year include that of Rogoff (1990), which states that in the election year there will be an increase in government consumption spending and a decrease in capital expenditure, and Pierskalla and Sacks (2018), which concludes that in the election year there will be a decrease in capital spending. The incumbent is significantly subject to public scrutiny and this prevents incumbents and civil servants from facilitating complicated capital investments.
For social spending, the three interaction variables indicate an increase in spending on social resources, grants, and subsidies in the two years before the regional elections of 5.79%, one year before regional elections of 21.58%, and in the year of the regional elections of
18.14% for local governments led by a regional head who is running again, although it is not statistically significant. These results indicate that incumbents have influenced discretionary spending, especially on social spending. Theincumbents behave opportunistically by increasing spending which affects their electability. This evidence is also in line
with previous research on the electoral budget expenditure cycle which states that incumbents who wish to be reelected prefer to increase this type of budget expenditure sub-category, by channeling donations and social assistance to citizens (discretionary funds) at election time to attract potential voters (Sjahrir et al., 2013).
Table 6. Dummy election year and dummy incumbent estimation coefficients
|
Dependent variable: |
Log of education expenditure |
Log of health expenditure |
Log of infrastructure expenditure |
|
Variables |
Model (4) |
Model (4) |
Model (4) |
|
Elect-2 x Incumbent |
0.0441 |
-0.0289 |
0.1163 |
|
(DEYi't-2xDInci't) |
(0.1319) |
(0.1047) |
(0.1278) |
|
Elect-1 x Incumbent |
0.1022 |
0.0814 |
0.1335 |
|
(DEYi,t-1xDInci,t) |
(0.1308) |
(0.1039) |
(0.1265) |
|
Elect x Incumbent |
0.0448 |
0.0437 |
0.1744 |
|
(DEYi,txDInci,t) |
(0.1353) |
(0.1074) |
(0.1311) |
Significant coefficient : * p < 0.10; ** p < 0.05; *** p <0.01. Source: authors’ results
which, in analyzing the education sector In the education budget, the three interaction variables indicate an increase
in the two years before the election of
4.37%, one year before the election of
10.21%, and the year of the election of
4.48% for local governments led by regional heads who run for re-election. The increase in spending in the education sector is in accordance with studies by Pierskalla and Sacks (2020)
Planning Consistency and the Political Budget Cycle in Indonesia: Simultaneous Regional Elections.. budget, found that in an election year, incumbent regional heads recruited more contract teachers who were not included in the remuneration received from the central government. Politicians set the timing of teacher recruitment to take place in an election year so as to reap political benefits. There is ample circumstantial evidence that the recruitment of contract teachers in Indonesia is seriously distorted when
the hiring of contract teachers' hiring can be a useful and effective way of improving student learning outcomes in some schools. Chang et al. (2013) stated that the appointment of contract teachers in Indonesia is characterized by corruption, lack of transparency, regional primitiveness, and co-option to the ruling authorities’ political interests, with many teachers not being appointed according to the minimum standard requirements for teacher competence.
For the health budget, the three interaction variables indicate a decrease in the two years before the election of 2.89%, but there is an increase in expenditure in the one year before the election of 8.14% and the year of the election of 4.37% for local governments led by regional heads who run again. This result support previous studies of Skoufias et al. (2014) who observe that spending on the health budget increased significantly in the year regional head elections were held. In OECD countries, incumbents also behave opportunistically in increasing health spending in an election year because health budgets are an important topic in
electoral debates that greatly affect voters’ interests (Potrafke, 2010). Improved health services can convince the public of the quality of regional heads who are seen to “side” with the people.
In the infrastructure budget, the three interaction variables indicate an increase in the two years before the election of 11.63%, one year before the election of 13.35%, and the year of the election of 17.44% for local governments led by regional heads who are running again. Thus it can be said that there is a political budget cycle in the infrastructure budget, although it is not statistically significant. An increase in this type of infrastructure spending is also similar to studies by Drazen and Eslava (2010) and Wiguna and Khoirunurrofik (2021) which find an increase in infrastructure spending in an election year because it attracts the attention of voters. Politicians prefer to focus on infrastructure spending rather than other spending allocations to attract more potential voters, because infrastructure spending is related to investment projects to build roads or
public facilities that benefit the community (Uribe & Pilar, 2013).
The relationship between the consistency of planning and political budget cycle behavior in personnel spending is seen through the interaction variables Elect-2 x Incumbent x Consistency, Elect-1 x Incumbent x Consistency, and Elect x Incumbent x Consistency. In capital expenditure, the coefficient value of the interaction variable Elect-1 x Incumbent x Consistency in Model (5) is 0.0084 and in Model (6) is 0.0082, both of which are significant at the 5% level. This indicates that the planning consistency index value one year before regional head elections in regions where the regional head is running for re-election is associated with or has a positive
correlation (relationship) with capital expenditure of 0.82% to 0.84% as compared to regions that are running for re-election where the regional head did not run again. In social spending, the coefficient value of the interaction variable Elect-1 x Incumbent x Consistency in Model (5) is 0.0243 and in Model (6) is 0.0237, both of which are significant at the 1% level. This indicates that the planning consistency index value one year before the regional head elections in a region led by a regional head who is running for re-election is associated with or has a positive correlation (relationship) with spending on social assistance, grants and subsidies of 2.37% to 2.43% as compared to regions led by regional heads who did not run again.
Table 7. Political budget cycle comparisons
|
Dependent variable: Personnel expenditure | |||
|
Election year effect x Incumbent |
Election year effect x Incumbent x Consistency | ||
|
Model (4) |
Model (5) |
Model (6) | |
|
Elect-2 (DEYi,t-2) |
0.1044*** |
-0.0010 |
-0.0008 |
|
(0.0307) |
(0.0024) |
(0.0024) | |
|
Elect-1 (DEYi,t-1) |
0.0418 |
0.0015 |
0.0017 |
|
(0.0305) |
(0.0025) |
(0.0025) | |
|
Elect (DEYi,t) |
0.0354 |
0.0038 |
0.0041 |
|
(0.0315) |
(0.0027) |
(0.0027) | |
|
Dependent variable: Capital expenditure | |||
|
Election year effect x Incumbent |
Election year effect x |
Incumbent x Consistency | |
|
Model (4) |
Model (5) |
Model (6) | |
|
Elect-2 (DEYiιt-2) |
0.0651 |
0.0051 |
0.0053 |
|
Elect-1 (DEYif-ι) Elect (DEYif) |
(0.0436) 0.0849** (0.0432) 0.1240*** (0.0447) |
(0.0034) 0.0084** (0.0035) 0.0053 (0.0038) |
(0.0034) 0.0082** (0.0035) 0.0047 (0.0038) |
|
Dependent variable: Social expenditure | |||
|
Election year effect x Incumbent |
Election year effect x Incumbent x Consistency | ||
|
Model (4) |
Model (5) |
Model (6) | |
|
Elect-2 (DEYif-2) |
0.0579 |
0.0020 |
0.0018 |
|
(0.1375) |
(0.0107) |
(0.0106) | |
|
Elect-1 (DEYif-ι) |
0.2158 |
0.0243*** |
0.0237*** |
|
(0.1360) |
(0.0111) |
(0.0110) | |
|
Elect (DEYi,t) |
0.1814 |
0.0017 |
0.0011 |
|
(0.1407) |
(0.0120) |
(0.0119) | |
|
Dependent Variable: Education expenditure | |||
|
Election year effect x Incumbent |
Election year effect x Incumbent x Consistency | ||
|
Model (4) |
Model (5) |
Model (6) | |
|
Elect-2 (DEYif-2) |
0.0441 |
-0.0234** |
-0.0239** |
|
(0.1319) |
(0.0102) |
(0.0102) | |
|
Elect-1 (DEYi,t-ι) |
0.1022 |
-0.0166 |
-0.0162 |
|
(0.1308) |
(0.0106) |
(0.0106) | |
|
Elect (DEYif) |
0.0448 |
-0.0052 |
-0.0063 |
|
(0.1353) |
(0.0115) |
(0.0115) | |
|
Dependent Variable: Health Expenditure | |||
|
Election year effect x Incumbent |
Election year effect x Incumbent x Consistency | ||
|
Model (4) |
Model (5) |
Model (6) | |
|
Elect-2 (DEYif-2) |
-0.0289 |
-0.0144* |
-0.0140* |
|
(0.1047) |
(0.0081) |
(0.0081) | |
|
Elect-1 (DEYif-ι) |
0.0814 |
-0.0004 |
0.0005 |
|
(0.1039) |
(0.0085) |
(0.0084) | |
|
Elect (DEYi,t) |
0.0437 |
-0.0027 |
-0.0022 |
|
(0.1074) |
(0.0092) |
(0.0091) | |
|
Dependent Variable: Infrastructure Expenditure | |||
|
Election year effect x Incumbent |
Election year effect x Incumbent x Consistency | ||
|
Model (4) |
Model (5) |
Model (6) | |
|
Elect-2 |
0.1163 |
-0.0467*** |
-0.0470*** |
|
(DEYif-2) |
(0.1278) |
(0.0098) |
(0.0097) |
|
Elect-1 |
0.1335 |
-0.0060 |
-0.0056 |
|
(DEYif-ι) |
(0.1265) |
(0.0101) |
(0.0101) |
|
Elect (DEYif) |
0.1744 |
0.0009 |
-0.0004 |
|
(0.1311) |
(0.0110) |
(0.0110) | |
|
Significant coefficient: * p < 0.10; ** p < 0.05; *** p < 0. |
01. Source: authors’ results | ||
|
In the education budget, the coefficient |
elections in regions |
led by regional | |
|
value of the Elect-2 x Incumbent x |
heads who are running for re-election is | ||
|
Consistency interaction variable in |
associated with or |
has a negative | |
|
Model (5) is minus 0.0234 and in Model |
correlation (relationship) with | ||
|
(6) is minus 0.0239, both significant at |
expenditure on education functions of | ||
|
the 5% level. This indicates that the |
2.34% to 2.39% compared to regions led | ||
|
planning consistency index value in the |
by a regional head |
who does not run | |
|
two years before the regional head |
again. In the health budget, the | ||
coefficient value of the Elect-2 x Incumbent x Consistency interaction variable in Model (5) is minus 0.0144 and in Model (6) is minus 0.0140, both significant at the 10% level. This indicates that the planning consistency index value in the two years before the regional head elections in a region led by a head running for re-election is associated with or has a negative correlation (relationship) with expenditure on health functions of 1.43% to 1.45% compared to regions led by a regional head who does not run again. In the infrastructure budget, the coefficient value of the Elect-2 x Incumbent x Consistency interaction variable in Model (5) is minus 0.0467 and in Model (6) is minus 0.0470, both significant at the 1% level. This indicates that the planning consistency index value in the two years before the regional head elections in a region led by a regional head running for reelection is associated with or has a negative correlation (relationship) with expenditure on infrastructure functions of 4.67% to 4.7% compared to regions
led by a regional head who does not run again.
Given these differences in the amount of expenditure before and after elections interacting with consistency in
planning, it is very important to pay attention to consistency between planning and budgeting at election time because it is an indicator useful for assessing local-government
performance and thus ensuring that all government programs and activities effectively achieve the goals that have been determined. This consistency can minimize the opportunistic attitude of regional heads in seeking benefits from budget allocations which help them to obtain election-winning votes
(Nordhaus, 1975; Rogoff, 1990). Opportunistic attitudes of this type lead to inconsistencies in the performance of regional expenditure in election years through the use of the allocation composition of expenditure (Drazen & Eslava, 2010), when in fact the main problem faced in regions is limited resources and revenue available to finance activities.
CONCLUSION
There have been many studies discussing political budget cycles at both national and regional levels. This research aims to analyze the relationship between planning consistency and political budget cycles in case studies of local governments participating in the 2017 and 2018 local elections in Indonesia. The study finds that consistency between planning and budgeting can control regional heads’ discretion around increasing and decreasing budget expenditures in the two years before the election, one year before the election, and in the year of the election. The magnitude of these reductions and increases differs between types of expenditure.
In the year of a local election and one year before, there was a significant increase in the allocation of capital expenditures, while in the two years before the local election there was a significant increase in the allocation of personnel spending. The relationship between planning and the political budget cycle is significant in the two
years before the election for education, health, and infrastructure, while this relationship is significant in the year before the election for the allocation of capital expenditure, social assistance expenditure, and grants and subsidies.
Given the consistent relationship between planning and budgeting and practices of the political budget cycle that can increase or decrease budget expenditures as a form of regional heads’ discretion, all stakeholders, including central government, local government, and the Regional People's Representative Council (DPRD), who also play a role in determining and using the budget, should be able to review budget documents in the year the regional head elections are held so that they are adjusted to the programs listed in the Regional Medium-Term Development Plan to ensure budget synchronization with development planning.
It is reasonable to suggest that a number of limitations might have influenced the results of this study, such as not controlling for the variable
characteristics of the individual regional heads, such as their educational background, or for the condition of the Regional Representative Council which of course influences the determination of the budget plan of political parties in the Regional People's Representative Council (DPRD). In addition, the use of a regional head dummy cannot accommodate the possibility of regional heads who have served for two terms supporting replacement candidates for leadership from the same political party. Further research could add control variables for candidates from the elected regional heads’ political parties because of possible relationships to budget allocations during the election period. It would then be advisable to use data over a longer period to produce a comprehensive analysis.
REFERENCES
Alesina, A., & Paradisi, M. (2017).
Political budget cycles: Evidence from Italian cities. Economics & Politics, 29(2), 157-177.
Bonfatti, A. & Forni, L. (2019). Fiscal rules to tame the political budget cycle: Evidence from Italian
municipalities. European Journal of Political Economy, 60, 10–18.
Brender, A. & Drazen, A. (2013). Elections, leaders, and the composition of government spending. Journal of Public Economics, 97, 18–31.
Chortareas, G., Logothetis, V., &
Papandreou, A. (2016). Political budget cycles and reelection prospects in Greece’s
municipalities. European Journal of Political Economy, 43, 1–13.
Cioffi, M., Messina, G., & Tommasino, P. (2012). Parties, institutions and political budget cycles at municipal level: evidence from Italy. Banca d’Italia working paper, 885.
Drazen, A. & Eslava, M. (2010). Electoral manipulation via voter-friendly spending: Theory and evidence. Journal of Development
Economics, 92(1), 39–52.
Eryilmaz, F., & Mercan, M. (2015).
POLITICAL BUDGET CYCLES: EVIDENCE FROM TURKEY. Annals of'Constantin
Brancusi'University of Targu-Jiu. Economy Series, (2).
Goncalves, S. (2014) The effects of participatory budgeting on municipal expenditures and infant mortality in Brazil. World Development, 53, 94–110.
Gonschorek, G., Schulze, G., & Sjahrir, B. S. (2018). To the ones in need or the ones you need? The
political economy of central
discreationary grants empirical evidence form Indonesia.
European Journal of Political Economy, 54, 240–260.
Gujarati, D. N., Porter, D. C., &
Gunasekar, S. (2012). Basic econometrics. Tata McGraw-Hill Education.
Kis-Katos, K. & Sjahrir, B. S. (2017). The impact of fiscal and political decentralization on local public investment in Indonesia. Journal of Comparative Economics, 45, 344–365.
Klein, F. A., & Sakurai, S. N. (2015). Term limits and political budget cycles at the local level: evidence from a young democracy. European Journal of Political Economy, 37, 21-36..
Kurunmaki, L. & Miller, P. (2011). Regulatory hybrids: Partnership, budgeting, and modernising government. Management
Accounting Research, 22(4), 220– 241.
Lee, S. (2014). The impact of the Korean preliminary feasibility study on budgetary decisions (A Thesis Submitted for the Degree of Doctor of Philosophy, University of Birmingham, UK).
http://etheses.bham.ac.uk/id/e print/5179/1/Lee14PhD.pdf
Lewis, B. & Hendrawan, A. (2019). The impact of majority coalitions on local government spending, service delivery and corruption in Indonesia. European Journal of Politic Economics, 58, 178–191.
Nordhaus, W. (1975). The political business cycle. Review of Economic Studies, 2, 169–190.
Pierskalla, J. H. & Sacks, A. (2018). Unpaved road ahead: The
consequences of election cycles for capital expenditure. Journal Politics, 80(2), 510–524.
Potrafke, N. (2010). The growth of public health expenditures in OECD countries: do government ideology and electoral motives matter?. Journal of Health Economics, 29(6), 797-810.
Rogoff, K. (1990). Equilibrium political budget cycles. The American Economic Review, 80(1), 21–36.
Sanchez, F. C. (2007). Incentives for budget discipline in the presence of elections. European Journal of Political Economy, 23(4), 863–884.
Sjahrir, B. S., Kis-Katos, K. & Schulze, G. G. (2013). Political budget cycles in Indonesia at the district level. Economics Letters, 120(2), 342– 345.
Sjahrir, B. S., Kis-Katos, K. & Schulze, G.G. (2014). Administrative overspending in Indonesian districts: The role of local politics. World Development, 59, 166–183.
Skoufias, E., Narayan, A., Dasgupta, B., & Kaiser, K. (2014). Electoral accountability andlocal
World Bank.
Wiguna, G. E., & Khoirunurrofik, K. Political budget cycle patterns
and the role of coalition parties in
|
shaping Indonesian government spending. |
local Asia- |
Pacific Journal of Regional Science, 1-24.
351
Discussion and feedback