The Effect of Economic Openness, Democracy, and Institutional Quality on Indonesia Exports to ASEAN Plus Three
on
pISSN : 2301 – 8968
JEKT ♦ 14 [1] : 115-143
eISSN : 2303 – 0186
The Effect of Economic Openness, Democracy, and Institutional Quality on Indonesia Exports to ASEAN Plus Three
Wikantioso
Universitas Padjadjaran
ABSTRACT
The ASEAN Charter Agreement and the cooperation of the East Asia Free Trade Area ASEAN+3 provide momentum for ASEAN countries to increase economic openness, strengthen the application of democratic principles, and improve institutional quality to enhance trade cooperation. This study aims to explore the role of economic openness, democracy, and institutional quality in increasing Indonesia's exports to ASEAN countries plus three during the 1996-2017 period using the augmented gravity model. The results showed that the openness of ASEAN+3 to trade (trade% of GDP), democracy, and institutional quality of Indonesia and ASEAN+3 as Indonesia's export destination had positive effects in increasing Indonesia's exports to ASEAN+3. However foreign direct investment in Indonesia and ASEAN+3 does not affect the export.
Keyword: trade gravity model, economic openness, democracy, governance institution, Indonesia's export, ASEAN+3
JEL classifications : F1, F2, K0
The world economy underwent a fundamental change due to the impact of globalization which united the economies between countries to become integrated and interdependent. This dependence on its essence arises as a form of human consciousness to need one another because the scarcity of resources in the country is not enough to be able to overcome their needs. Therefore, openness to relationships between countries is believed to increase prosperity through international trade.
One of the integration efforts is the formation of trade blocks to reduce trade barriers between member countries to increase trade and accelerate economic growth. With this goal, the countries of Southeast Asia developed economic cooperation, especially trade in 1992 through the 4th ASEAN Summit in Singapore, which resulted in an agreement to realize the ASEAN Free Trade Area (AFTA) within a period of 15 years whose realization was accelerated to 2002. The objectives of AFTA : (1) Making the ASEAN region a competitive place of production so that ASEAN products have strong competitiveness in the global market, (2) Attracting more Foreign Direct Investment, and (3) Increasing trade between ASEAN members ( Ministry of Trade, 2002). the
ASEAN economic cooperation agreement has been expanded to reach the East Asia region by involving 3 Asian tiger countries namely China, South Korea, and Japan or better known as the ASEAN Plus Three (ASEAN + 3) trade cooperation which was formed in 1997 in Malaysia when the region Asia is being hit by an economic crisis as an effort to develop economic cooperation. One agreement that was realized was the East Asia Free Trade (EAFTA) or free trade in the East Asian region (ASEAN Secretariat, 2018).
The development of the economic cooperation agreement shows that the countries of Southeast Asia and East Asia are increasingly integrated and interdependent with their neighbors. This can be seen from the economic openness shown by the level of trade openness and foreign direct investment (FDI). Trade openness is shown by the ratio of total exports and imports to gross domestic product (Mankiw, 2016). Based on data from the percentage of the trade-in Gross Domestic Product (GDP) from the World Development Indicator in 2018 shows the level of trade openness for ASEAN + 3 countries, Singapore is the country with the highest level of trade openness in ASEAN with an average above 300%. Then Malaysia, Thailand, Vietnam, Cambodia, and Brunei
Darussalam whose average level of trade openness is above 100%. The Philippines, Laos, Myanmar, Indonesia, and South Korea have an average trade openness level of less than 100%. Meanwhile, China and Japan have an average openness level of less than 50%. In the Southeast Asian region, Indonesia's exports were mostly targeted at countries with economic openness levels above 100%.
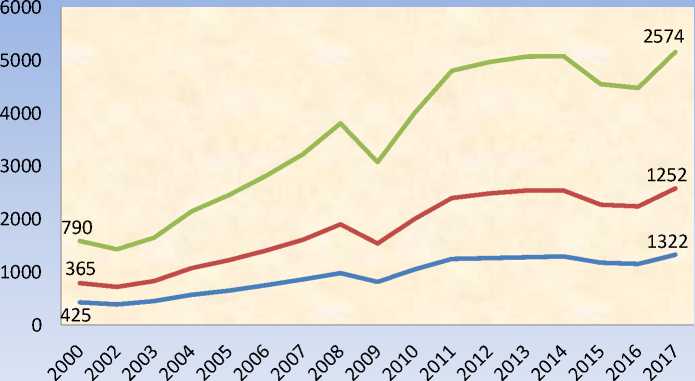
Over the past decade trade statistics increased significantly with the value of goods exports of US$ 2.6 billion and service exports of US$ 703.2 billion in 2017. The following Graph 1.1 illustrates the development of the value of exports, imports, and trade balance in ASEAN over the years 2000 – 2017
^^^^^^ EKSPOR <■■■■■■»IMPOR ^^^^■*TOTAL PERDAGANGAN
Source : ASEAN Secretariat, 2018
Graph 1.1 ASEAN Trade Trends 2000 – 2017 (Milion USD)
Total trade in ASEAN increased almost 3.5 While the largest portion of imports was 20.3% from times from 2000 which was the only US $ 790 billion China, 9.1% from Japan, 8.3% from the European to USD 2,574 billion in 2017. Exports consistently Union, 7.9% from South Korea, and 7.3% from the increased during this period, except in 2009 which United States. The total ASEAN + 3 trade-in 2017 had declined, and at the end of the year, 2017 reached accounted for 31.6% of the total ASEAN trade USD 1,322 billion. At the same time, total goods (ASEAN Secretariat, ASEAN statistical database, imports reached USD 1,252 billion, but it was still 2018).
lower than exports, so it still showed a positive trade
balance. Intra-ASEAN trade collectively provides the The contribution of Indonesia's exports to
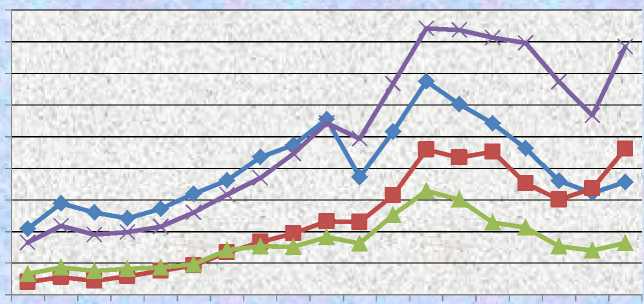
largest portion of total ASEAN trade. The share of ASEAN+3 countries also showed good development exports and imports of intra-ASEAN goods in 1999 of US$ 24,004.3 million until 2010 reaching respectively were 23.5% and 22.3% of total exports USD 115,143.4 million although it tended to decline and imports in 2017. The other largest percentage of during 2011-2016 than in 2017 again showed an exports were to several ASEAN trading partners increase to USD 88,248.3 million. The following including 14.1% to China, 12, 1% to the European figure 1.2 illustrates more fully the development of Union, 10.8% to the United States, and 8% to Japan. Indonesia's export contributions to ASEAN + 3 during the period 1999 – 2017 :
45,000.0
40,000.0
35,000.0
30,000.0
25,000.0
20,000.0
15,000.0
10,000.0
5,000.0
0.0
—♦—JPN
—■-CHN
-⅛- KOR
ASEAN
Source : data.imf.org, tahun 2018
Figure 1.2. Indonesian exports to ASEAN + 3, 1999 - 2017 (Million USD)
Indonesia's exports to all ASEAN countries are higher than to Japan, China, and South Korea which reached USD 39,221.3 million in 2017 and even reached USD 42,098.9 million over the past 20 years. When viewed per individual country, 8 of Indonesia's largest trading partners in the ASEAN + 3 region are in sequence, Japan, China, Singapore, South Korea, Malaysia, Vietnam, the Philippines, and Thailand. The eight countries have a very high level of economic openness to international trade as seen from the percentage of the ratio of trade (exports and imports) to the country's gross domestic product. Making it easier for Indonesian export commodities to enter the domestic market.
In the next stage by taking into account the achievement of significant economic cooperation and bearing in mind the shared interests, and interdependence between ASEAN member countries bound by geography, common goals, and common destiny 1, all the leaders of the executive bodies of ASEAN countries agreed to sign The ASEAN Charter at the November 2007 Summit held in Singapore, some of the agreements were firstly the commitment of economic openness of all ASEAN countries to the flow of goods, services, labor, and capital as written in ASEAN goals and principles2.
Second, commitment to implement democratic principles and third, improving the quality of institutions, especially good governance as in the ASEAN Charter in the opening3, objectives4, and principles5.
International trade is more complex than domestic trade because trading countries differ in many respects such as differences in political, economic, cultural, institutional and legal systems that affect trade between countries. The issue of democracy included in the points of the ASEAN Charter agreement occurs because the main agenda of globalization is market liberalization for international trade. A free market requires fair and competitive competition among economic actors by minimizing government interference
trade rules and regimes based on ASEAN rules to carry out economic commitments effectively and progressively reduce towards removing all types of barriers to regional economic integration, in economies that are market driven..
that can distort the market. Therefore, democracy is considered as a political infrastructure that can support
market mechanisms running well because it is conceptually committed to limiting the dominance of a group's power over the majority group that determines economic and political policies in a country. A democratic state upholds the rights of individual citizens to achieve prosperity the role of the state is only present to maintain public order, uphold the law agreed upon by the constitution, and manage public goods. So that a democratic country is expected to implement economic policies that support competitive markets.
Several recent studies have shown empirical evidence that democratization has a positive role in increasing cooperation, reducing barriers, and increasing trade between countries (Donna, et al. 2018; Yogatama and Hastiadi, 2016; Balding, 2010; Yu, 2010; Milner and Kubota, 2005; Duc Cindy et al, 2004; Mansfield, et al, 2000). So that a country will more easily get trade benefits if it exports its superior commodities to a democratic country because it is more open to international trade than autocratic countries which are usually protective. However, in certain cases O'Rourke and Taylor (2006) state that democratization can inhibit trade, especially in countries where the majority of government supporters are groups that benefit from trade protection policies. Yogatama and Hastiadi (2016) also found that democratization in member countries of the Organization of Islamic Conferences which fall into the category of low-income countries resulted in policies that protect their domestic economy from imported goods or are more closed to international trade.
The issue of commitment to run good governance or good governance institutions is also included in the ASEAN Charter agreement because the presence of good governance institutions will encourage the creation of competitive international trade. Institutions include a set of formal and informal rules and enforcement mechanisms that ensure that the competitive competition market mechanism operates as it should. Institutions provide equal opportunities for individuals to carry out economic activities, protect property rights, and limit the behavior of politicians and other influential groups who seek to gain profits in a harmful way. Therefore, good quality institutions are also the main infrastructure to support international trade cooperation, especially at the ASEAN + 3 level.
any recent studies have shown empirical evidence that good quality institutions play an important role in strengthening export orientation. Faruq (2011) in his research showed that institutional quality is at least in three variables, namely low level of corruption, efficient quality of bureaucracy, and guaranteed ownership rights will improve the quality of a country's exports. Other empirical research also shows that good institutional or governance quality is an important aspect of increasing trade (Yogatama and Hastiadi, 2016; Abidin et al, 2013, Balding, 2010; de Groot et al, 2004). However, Yu (2010) also found that good quality institutions can provide incentives for domestic producers to increase innovation, investment, and productivity in producing quality local products to increase the competitiveness of domestic products against imported products will consequently be a factor in creating substitution import.
Economic openness to trade and investment, democratization, and institutional improvement are thought to be factors that play a role in increasing and inhibiting trade. Therefore, this research will focus on investigating the influence of the three on Indonesia's exports to ASEAN + 3 member countries (Japan, China, and South Korea). The problem to be identified from this research is to answer the following problems:
-
1. Does the openness of the ASEAN + 3 economies towards trade and foreign direct investment, the quality of democracy, and the quality of governance institutions affect Indonesia's exports to ASEAN + 3 ?
-
1. Determine the effect of economic openness on foreign direct investment and trade, the quality of democratization, and the quality of government institutions on the performance of Indonesia's exports to ASEAN + 3.
Export and import activities are complex processes because each country has different uniqueness or characteristics so that many factors
that play a role in increasing or even hindering trade, namely economic openness policy, gross domestic product size, geographical distance, a political system adopted, and the quality of government institutions also play a role in determining the intensity of trade between the two countries as explained in the next section.
-
4.1.1. Effects of Economic Openness on Trade
Economic openness is represented by international trade and Foreign Direct Investment (FDI) which reflects the flow of goods, services, and capital between countries. If both of them can freely enter and exit from one country to another without obstacles, it will benefit the economies of both countries. Trade and FDI are proven to be the driving force of domestic and regional economic growth as
Table. 4.1. Difference between Export Orientation and Import Substitution Policy
evidenced by several studies by Suliswanto (2016), Krisharianto and Hartono (2007), Ahmed et al (2008), Jawas (2008), Carceres (2009), Iqbal (2009) 2010). A country's economic openness can affect trade depends on two things, namely :
The economic policy of a country's government in the context of the international economy is divided into two, namely inward-looking policy or outwardlooking policy. Broadly speaking, the differences between the two types of policies are summarized in the following table 4.1
|
Outward-Looking Orientation Policy |
Inward-Looking Orientation Poliicy |
|
Free trade and export expansion policy |
Protectionist policies and import substitution |
|
Open domestic economic policy |
The domestic economic policy remains closed |
|
Open door policy towards foreign aid |
Dependence on domestic savings and selfsufficiency in resources |
|
Open door policy towards foreign investment |
Obstacles to foreign investment except those oriented to import substitution |
|
Open door policy on immigration |
Barriers to immigration |
Source : Hla Mynt (1984) in Kuncoro (2006)
Countries that implement inward-looking policy spur economic development by developing industrialization of import substitution and using economic planning as a bulwark to protect external influences that are considered disturbing and undesirable, so that inward-looking strategies can be interpreted as protectionist policies and place greater emphasis on import substitution (Kuncoro, 2006). Countries that implement inward-looking policies the level of economic openness to trade is low - seen from the contribution of trade (exports and imports) to a low gross domestic product - so that it will hamper exports from other countries that enter the domestic market with various protection measures such as tariffs, quota, or even import ban.
On the other hand, countries that implement outward-oriented economic policies develop industrialization of export expansion and implement domestic economic policies that are open to free trade with other countries. Countries that implement outward-looking policy policies have a high level of economic openness to trade - seen from the
contribution of trade (exports and imports) to the high gross domestic product - so that it provides an opportunity for other countries to export their superior products to the country.
Outward-oriented policies that aggressively export promotion will attract FDI inflows through efficiency in the private market when competition in the international market drives managerial efficiency and innovation, which causes foreign investors to become more interested in export-oriented domestic companies. The climate of international trade competition will increase the export productivity of recipient countries. Increased productivity will reduce the cost of capital utilization, which means promising a higher rate of return for foreign investors. So that it will attract inflows of foreign investment (Zhang and Felmingham, 2001). Also, the outward-looking policy will be a stimulus for the entry of efficiency-seeking investment that creates export expansion (Dunning, 1998; Gray, 1998).
Foreign direct investment (FDI) or direct foreign investment is a real investment where investors invest much capital to build various facilities for production and or marketing in other countries such as factories, capital goods, buildings, land, etc. including if investors buy companies existing in host countries through share ownership, mergers or acquisitions (Hill, 2003 and Salvatore, 2013).
The world investment report published in the United Nations Conference on Trade and Development in 1996 states that FDI and international trade are interconnected. Vernon product cycle theory (1966) which explains the dynamic comparative advantage that is the stage of production will move from the country that first created a new product innovation (home country) to a country that offers low production costs such as the existence of cheap labor, so the country is initially an exporter can be an importer country (Salvatore, 2013).
FDI will be trade-oriented or not trade-oriented depending on the motives of investors in making direct investments. According to Mallampally and Sauvant (1999), FDI will create trade if the motivation is Resource seeking and asset seeking FDI, that is, companies invest in a country to access production factors and assets cheaply and obtain infrastructure facilities. Economic factors that attract this type of FDI, for example, are natural resources as raw material, cheap labor, physical infrastructure, and the presence of technology, innovation, and other assets such as brands owned by FDI destination countries. According to Habib and Zurawicki (2002) investors including asset seeking FDI will prefer their investment destination countries that have high mastery of science and technology. This type of FDI includes FDI that supports trade. Then the motivation of Efficiency-seeking FDI can also increase trade, namely companies investing directly in a country to get a production location that offers low-cost production. For example, the direct investment will reduce transportation and communication costs and benefit from host country membership in regional free trade agreements that can build regional marketing networks for companies.
Whereas Market-seeking FDI is a company considering investing directly in a country so that it
is close to a large market location for its products. Economic factors that attract this type of FDI are per capita income, market size, global and regional market access, market structure, and special preferences of consumers in a country. Including market-seeking FDI, the motive of avoiding trade tariffs by host country Mundell (1957) called it FDI tariff-jumping. Market-seeking FDI is carried out to more quickly expand trade to other countries, especially those that implement trade protection policies in addition to being closer to consumers (Wei and Liu, 2001). It seems that market seeking FDI is the same as Horizontal FDI, that is, foreign investors, invest their capital by establishing companies that produce the same final product as the parent company's products in their home country (home country) to make it easier to access foreign markets. So, this type of FDI is anti-trade.
The gravity model is a model that adopts Newton's theory of gravity which is applied and adjusted in the context of trade between countries. Newton's Law of Gravity says the force acting between two objects is proportional to the mass of each object and inversely proportional to the square of the distance of the two objects. In the context of trade between countries, it can be stated that the intensity of trade is influenced by the size and geographical distance of the two countries. The size of the economies of the two countries can be represented by national income or Gross Domestic Product (GDP). So that mathematically the trade relations between the two countries can be written :
Where A is a constant, T_xy is the value of trade between country x and country y, Y_x is country GDP x and Y_y is country GDP y, D_xy is the distance between the two countries. The value of trade between two countries is proportional to GDP and inversely proportional or will decrease with distance. The gravity model shows a negative relationship between distance and trade because transportation costs will certainly be more expensive if the distance of the two countries that trade farther so that distance is a determinant factor that determines the intensity of trade between the two countries, the equation is a gravity model of world trade (Krugman et al, 2012 ).
GDP is used as a measure of a country because for an exporting country it reflects its production
capacity, while for an importing country it is a measure of absorption capacity for imports (Kalbasi, 2001 in Yuniarti, 2007). So that a country will trade more intensively with another country whose GDP is greater than a country whose GDP is small and will trade more intensively with a country whose distance is closer than a country whose geographical location is far and will be more intensive trading with countries that implement economic systems open than countries with closed economic systems (Salvatore, 2013).
Democracy is closely related to the teachings of individualism, namely the philosophy of life that teaches freedom for every human being to achieve the goals of economic and political interests. So, private interests get higher rights than the interests of the state. Individualism is built on 2 principles: first, every individual must be guaranteed and protected by freedom of human rights and expression. Second, community welfare will be better achieved if each individual is free to pursue their respective economic interests. The main message of individualism is political and economic freedom are the basic rules that form the foundation of society (Hill, 2013).
So, in a practical sense individualism translates to be more closely related to the democratic political system and the free market economic system. Therefore, the democratic system is seen as a political system that provides a conducive environment for international trade because it is more pro-business and pro-free trade (Hill, 2003). Mansfield, et al (2000) stated that related to political policy choices towards trade barriers namely if two democratic countries trade with one another, the trade barriers are lower than trade between a democratic country and an autocracy state. Or in other words, the flow of trade is greater if the countries that trade with each other are democratic. Whereas if the two trading countries are autocracy countries tend to protect themselves with trade barriers which are relatively more stringent than if an autocracy state with a democratic country.
The reason supporting Mansfiled et al (2004) is that democratic political institutions affect bilateral trade between the two countries because (1) democratic countries are easier to negotiate trade agreements; (2) democratic countries tend to easily reduce tariff barriers with their trading partners; and (3) low transaction costs (Cindy et al, 2004).
Scientists and policymakers believe that democracy will bring about creating better quality institutions. Barro (1999) in Yu (2009) states that democracy can create a fair and competitive market through the presence of the rule of law and its disciplined enforcement and protection of property rights (property rights). Balding (2011) states that two reasons explain that democracy influences trade, first democracy will produce political freedom and economic freedom and openness that can realize international trade. Both democracies will create better institutions, political policies, regulations, rules and law enforcement such as protection of property rights, low levels of corruption, transparency, and accountability.
Yu (2010) states that democracy will have an impact on trade because the application of democracy to the political system in exporting and importing countries will improve product quality, reduce trade costs, and increase bilateral trade. For exporters, this improvement becomes an incentive to increase exports. If the quality of democracy of the exporting country is getting better, it will produce better institutions in the form of protection of consumer rights, regulations related to better product quality, and protection of economic actors through disciplined law enforcement that will improve the quality of products and the reputation of exporting countries in the world market. As for importing countries, democratization will have an impact on tariff reductions.
But there is also an anomaly that for importing countries the improvement tends to potentially increase trade barriers and reduce imports because the importing country has been able to present quality products with efficient production costs (Yu, 2010). Thus, improving the quality of products in democratic importing countries will provide fierce competition for imported products that enter their countries, thereby potentially reducing imports and trade. Correspondingly, O'Rourke and Taylor (2006) state that democracy can create more protectionist trade policies in countries whose labor benefits from trade barriers from tariffs or tariffs. Yogatama and Hastiadi (2016) concluded that democracy in an importing country that is included in the category of low-income countries is protecting the domestic market from imported goods.
Institutions are rules both formal and informal and their enforcement mechanisms that regulate market participants and their organizations interact
with each other and interact in society (Nugent, 1998 in Ihsan, 2003). Institutions limit human deviant behavior to build structures of political, economic and social interaction that create order and reduce uncertainty in conducting transactions. Formal rules include constitutions, statutes, laws, laws, employment contracts, government regulations. Formal rules form political systems (structures and systems of government and individual rights), economic systems (ownership rights, contracts), and security and order systems (police, judiciary). Informal rules include experience, traditional values, ethics, customs, religion, and so on. These formal and informal rules will not mean anything if they are not accompanied by enforcement efforts (North, 1994 in Yustika, 2012).
The presence of quality institutions or institutions is needed to support the realization of a fairer and more competitive competition market mechanism as the objectives of the free trade cooperation agreement as explained by several researchers: Faruq (2011) mentions 3 aspects of institutional indicators that are the most important measures for strengthening export orientation, namely: the level of corruption, the quality of bureaucracy, and ownership rights. Good institutional conditions shown by the low level of corruption, bureaucratic efficiency, and guaranteed ownership rights will improve the quality of a country's exports. These three institutions contribute to reducing production costs and transaction costs, reducing uncertainty, and increasing incentives for producers to invest and innovate to produce better quality and quantity of products so that commodity competitiveness increases. Conversely, if a country has a high level of corruption, bureaucratic inefficiency, and lack of protection of guaranteed ownership rights, it causes transaction costs and high production costs so that competitiveness is low and the products produced cannot compete in the international market.
Then, Jansen and Nordas (2004) in Yogatama and Hastiadi (2013) explained that the quality of institutions will affect international trade because 3 things, firstly, inefficient institutions including cost factors for domestic exporters have the effect of reducing the competitiveness of products in the international world, which means that they have an impact negative for exports. Second, transaction
costs due to institutional inefficiencies will have an impact on increasing the selling price of the final product from imported goods so that it has a negative impact on imports.
Anderson and Marcouiller (2002) state that to overcome the inefficiencies of these institutions, trade must be supported by effective law enforcement and transparent and impartial government regulations so that it will increase the involvement of countries in the trade as both exporters and importers. Third, the conflict between trading partner countries if there is a disagreement between the two in the matter of trade barriers both tariffs and non-tariffs, the cause is the absence of good institutions to regulate fair trade agreements. Completing the third point, Linders et al (2005) states that the root of the problem of conflict between trading partners is the occurrence of distrust between trading partners related to commitments to carry out contracts in an obedient principle (consistently). If the distribution continues, even if a country reduces its trade barriers, other countries will not necessarily want to increase their trade relations with that country.
So, to realize a fair and competitive competition mechanism in the context of international trade, it requires the presence of quality institutions whose form is the ability of the government to present the first improvement in the quality of economic regulations and pro-business trade (regulatory quality) to provide opportunities for the private sector to compete in markets without interference government hands which can cause disequilibrium in the international trade market. Second, creating a rule of law that provides legal certainty, protection of property rights, and consistent and fair enforcement of the law for the creation of law order. Third, effective government bureaucratic services oriented towards creating efficiency in the business sector. Fourth, control corruption to reduce economic costs due to losses from corruptive behavior. Fifth, the presence of transparency and accountability in the implementation of government.
This research mostly refers, replicates, and modifies from previous studies that use the basic model of the theory of trade gravity by adding several variables related to economic openness, democracy, and institutional cohesion.
-
1) Pros and Cons of Trade Liberalization Increases Exports
Abidin et al (2013) prove that Malaysia's export opportunities to OIC member countries are increasing if the trade ratios of OIC member countries and Malaysia also increase. Likewise, Mohsen et al (2016) proved trade liberalization in addition to increasing exports but also increasing Syrian imports, namely there is a two-way relationship between trade and export openness and the direction of trade openness towards imports. Trade openness also provides easy access for domestic producers to obtain cheaper imported production inputs. Babatunde (2009) proved that trade liberalization policies can improve the export performance of Sub-Saharan African countries through increased access to imported production inputs and a more competitive and stable real effective exchange rate.
On the other hand, trade liberalization will increase the volume of imports more than increase export performance which further aggravates the trade balance deficit if the performance of the domestic economy is weak. Hoque and Yusop (2012) prove it in the case of Bangladesh that trade liberalization is statistically significant but the impact on export aggregates is low and increases imports more than exports. Then the domestic economic performance factors such as gross domestic product growth, technology transfer, price stability, infrastructure, and the construction of backward linkage industry that actually improve export performance. So, failure to increase domestic economic growth will cause trade liberalization policies to increase imports rather than increase exports.
-
2) Pros and Cons of Foreign Direct Investment (FDI) Increasing Exports
If the incoming FDI is vertical FDI which aims to obtain an efficient production location (efficiency-seeking FDI)then FDI is related to exports following the results of research Jawahid et 123
al (2016) in Pakistan concluded that FDI inflows have a positive effect on export performance due to Pakistan's superiority which has an Export Processing Zone facility or an integrated export-oriented industrial zone and a large workforce has attracted the interest of export-oriented FDI. The inclusion of vertical FDI also has a positive effect on increasing exports because the motivation is to find a company operating location in a country that provides abundant production inputs as evidenced by the research of Ullah and Yasmeen (2014) in Bangladesh and Anwar and Nguyen (2011) and Xuan and Xing (2008) on exports Vietnam to its trading partner countries.
However, some studies prove that FDI does not effect on exports, Mohanty and Sethi (2019) examine the effect of FDI on Indian exports with the Auto Regressive Distributed Lag (ARDL) method, concluding that FDI has a negative and significant effect on the long-term performance of Indian exports but has an effect positive in the short term.
After several countries join as members of the trade bloc who want a commitment to open the economy and remove trade barriers to exports and imports from fellow members, they will come into contact with a reality of each country's uniqueness namely the applied political system that influences trade as evidenced by research Mansfield et al (2000), Duc Cindy et al (2004), Milner and Kubota (2005), and Yu (2010) that democratic state pairs have trade relations that are more open than mixed state pairs (democracy with autocracy) because democratic countries are obstacles lower trade. This conclusion is reinforced by Assoumou Ondo (2017) finding that improvements in democratization make a country (Gabon a sample of countries studied) more open to trade so that trade cooperation with partner countries is freer. Even democratization can increase trade significantly by contributing around 3% to 4% to the growth of bilateral trade as the result of Yu's (2010) research. This happens because the development of democratization in a country is usually accompanied by improvements in institutions that support the realization of fair and competitive free trade and reduce unobservable costs such as transaction costs, uncertainty, etc. so that democracy
has a positive effect on international trade as Yu's research results (2010) ).
However, Balding (2010) found different research results that democracy and its supporting elements were not convincing to encourage international trade because only high-income countries benefited from trade while middle and low-income countries were statistically insignificant. So that what affects trade is not the democratic factor but the high and low of national income. Although the results of the study of Yogatama and Hastiadi (2016) generally conclude that democratization has a positive effect on increasing Indonesia's exports to member countries of the Organization of the Islamic Conference (OIC), the results are complementary to Balding's (2010) findings, namely that OIC countries included the lower-income category applies a more closed economic policy to trade to protect its domestic market from imported goods.
Good institutional quality will have a positive effect on trade, while indicators used as a measure of institutional quality vary among researchers Faruq (2011) proves that good institutional size is evidenced by low levels of corruption, efficient bureaucracy, and security guarantees of property ownership rights. will be an incentive that moves producers to innovate, invest and expand that can increase their productivity in producing export goods. Abidin et al (2013) used a measure of the level of corruption based on the corruption perception index from Transparency International proving that the low level of corruption between two trading countries would increase trade. meanwhile, Yogatama and Hastiadi (2016) in the case of Indonesia's exports to OIC member countries use a governance index measure from the World Bank that details the institution into 6 assessment indicators namely government effectiveness, control of corruption, political stability and absence of violence, voice and accountability, rule of law, and rule of quality also produce the same conclusion that improving governance institutions in government has a positive effect on increasing trade.
Poor quality of institutions becomes unobservable trading costs which become trade
barriers and barriers to the process of integration of regional trade cooperation as found by Kucharcukova et al (2012) when examining trade relations between the countries of southeastern and commonwealth independent countries.
Some researchers explain that good institutional quality can have a positive effect on trade when first, in a democratic country as the results of Yu's study (2010) concluded that democracy and institutional quality go hand in hand when good democratic quality will be followed by improved institutional quality. Secondly, it is in a country with good infrastructure quality as the results of research by Francois and Manchin (2013) which concludes that the quality of institutions and access to transportation and communication infrastructure accessible to exporters and importers will increase trade. Third, the two countries that trade have the same level of institutional quality as the results of De Groot et al (2004) who analyzed that the similarity in the quality of the institutions that trade affects the intensity of trade between the two and the low quality of institutions has an impact on increasing transaction costs so that it will become a barrier to trade
This research will use augmented gravity model panel data analysis for 22 years of observation (1996-2017) by entering the basic variables of the gravity model of trade (GDP and distance between countries) plus variables of economic openness, political liberalization index, and quality of institutions to determine the effect of all variables mentioned to Indonesia's exports to ASEAN + 3 countries, namely Singapore, Malaysia, Thailand, the Philippines, Vietnam, Myanmar, Japan, China, and South Korea.
The econometric model that will be examined refers to the model used by Ullah and Yasmeen (2014), Abidin et al (2013), Anwar and Nguyen (2011), Xuan and Xing (2008), and Yogatama and Hastiadi (2016) are as follows:
ln(EΧit)=αi+β1 ln(GDPIDNt)
+β2 ln(GDPAPTit)+β3 ln(DISTit) +β4ln( OPENAPΤit)+ β5FDIIDNt +β6 FDIAPTit + β7POLIDN t
+β8 POLAPTit+β9GOVIDN t +β10GOVAPTit+eit
Table 6.1 Model Description :
|
Variable |
Description of Variables / Data Types |
Hypothesis |
Data source | |
|
ln(EΧit ) |
The logarithm of the value of Indonesian exports to each of the ASEAN countries + 3 (billion US $) as the dependent variable |
DOT IMF | ||
|
ln(GDPIDNt) |
Logarithm of Indonesian GDP based on 2010 constant prices (US $) |
+ |
WDI World Bank | |
|
ln(GDPAPT t) |
Logarithm of GDP of each ASEAN + 3 member countries based on 2010 constant prices (US $) |
+ |
WDI World Bank | |
|
ln(DIST t) |
Logarithm The distance between the Tanjung Priok port in Indonesia and the main port in each of the ASEAN + 3 member countries (Nautical Miles) |
- | ||
|
ln(OPENAPTt) |
Level of Economic Openness of each ASEAN + 3 countries towards trade as measured by the formula (Export + Import): GDP |
+ |
WDI World Bank | |
|
FDIIDN t |
Foreign Direct Investment net inflow to Indonesia (% of GDP) |
+ |
WDI World Bank | |
|
FDIAPT |
Foreign Direct Investment net inflow to each ASEAN + 3 countries (% of GDP) |
- |
WDI World Bank | |
|
POLIDN t |
Indonesian Democracy Index |
+ |
Polity IV | |
|
POLAPT t |
Democracy Index of each ASEAN + 3 countries |
+ |
Polity IV | |
|
GOVIDN t |
Total Governance Index values for Indonesia |
+ |
WGI World Bank dan ICRG | |
|
GOVAPT t |
Number of Governance Index scores for each ASEAN + 3 countries |
+ |
WGI World Bank dan ICRG | |
|
t |
: |
Time series in years | ||
|
i |
: |
Each country is a member of ASEAN +3 | ||
|
α |
: |
intercept | ||
|
Β |
: |
Slope (n = 1, 2, ....) | ||
|
¾ |
: |
Error term |
Explanations related to variables in the model are as follows :
-
1. This study uses the logarithm of Indonesia's export value to each of the ASEAN + 3 member countries which is symbolized by ln (EX_it) as the dependent variable which is influenced by a number of independent variables in the augmented gravity model framework. Dependent variable data was obtained from The Direction of Trade Statistics published by the International Monetary Fund.
-
2. The basic variable of the gravity model is the size/capacity of a country represented by GDP and distance. Indonesian GDP shows a measure of Indonesia's productivity capability while partner countries' GDP shows the ability of import demand of ASEAN + 3 countries or it can be said also the market size of ASEAN + 3 countries. Both are expected to have a positive effect on Indonesia's exports to ASEAN + 3 countries. GDP data is sourced from the World Development Indicator published by the World Bank. Whereas the distance variable (DIST) represents the cost of transportation which has a
negative impact on bilateral trade, meaning that the further the distance of the two countries, the smaller the volume of trade because transportation costs are more expensive. Distance data on the DIST variable is sourced from https://sea-distances.org which measures the distance in nautical miles between the Tanjung Priok port in Indonesia and the main ports in ASEAN + 3 countries including Malaca Port (Malaysia), Bangkok Port (Thailand ), Singapore Harbor (Singapore), Manila Harbor (Philippines), Ho Chi Min Port (Vietnam), Tokyo Port (Japan), Shanghai Port (China), Busan Port (South Korea), and Yangoon Port (Myanmar).
-
3. The effect of economic openness is represented by the ratio of trade to GDP (exports plus imports divided by GDP) of each country belonging to ASEAN + 3 which refers to the study of Abidin et al (2013). The greater the value of the ratio of trade to GDP of a country shows that the country is very open and dependent on international trade in increasing GDP so that it can be suspected to be a factor affecting Indonesia's exports to that country. Variable data on trade to GDP ratio was obtained from the World Development Indicator published by the World Bank.
-
4. Then economic openness from the ease of foreign direct investment inflows refers to research conducted by Ullah and Yasmeen (2014), Anwar and Nguyen (2011), and Xuan and Xing (2008). The data used is the foreign direct investment net inflow to Indonesia (% of GDP) that entered Indonesia (FDIIDN) and to each of the countries -ASEAN + 3 (FDIAPT). These two variables represent the phenomenon of free flow of goods and capital and the government's economic policy choices whether to look outside or look inside to see the effect on Indonesia's exports to ASEAN + 3. Net FDI% GDP GDP data was obtained from the World Development Indicator published by the World Bank.
-
5. The Democracy Variables POLIDNt and POLAPTit refer to the research of Yogatama and Hastiadi (2016) which are a combination of autocracy index and democracy index derived from the Polity IV Project6. by subtracting the
autocracy score from the democratic score so that it gets a score in the scale range of -10 and 10. A value of -10 indicates the country with the most autocracy value and a value of 10 indicates the country with the most democratic value (Marshal et al, 2018)
-
6. The variable quality of government institutions also refers to the research of Yogatama and Hastiadi (2016) by taking data sources on an indexed dataset published by the World Bank sourced from the International Country Risk Guide (ICRG) index by grouping based on the Worldwide Governance Index (WGI) consists of 6 types of groups size Voice and Accountability (VA), Political Stability and Absence of Violence (PV), Government Effectiveness (GE), Regulatory Quality (RQ), Rule of Law (RL), and Control of Corruption (CC) with Details are shown in Table 6.2 below
The Polity IV Project is a research project created by The Center for Systemic Peace (www.systemicpeace.org), a research institute that focuses on researching systems, behavior, and political dynamics in 167 countries. Polity IV provides an annual assessment of the conditions of
autocracy, democracy, regime transitions, conflict and armed intervention in 167 countries.
Table 6.2. Institutional Quality Assessment Components
Group
Assessment Components
Point (max.)
RQ
Investment profile
12
PV
Government stability
12
Internal conflict
12
External conflict
12
Socioeconomic conditions
12
Ethnic tensions
6
Religious Tensions
6
VA
Military in politics
6
Democratic accountability
6
RL
Law and order
6
CC
Corruption
6
GE
Bureaucratic quality
4
TOTAL
100
Source : World Governance Indicator World Bank, 2018
International Country Risk Guide Political Risk Service, 2018
The index assessment is based on a subjective analysis of the assessment component information that is available throughout the year of observation. The highest value indicates the lower business risk in a country due to the high quality of institutions. While the lowest value indicates the higher business risk in a country due to the low quality of the institution.
Table 7.1 provides descriptive statistics of the variables used in this study. In general, these variables can be divided into three groups, namely: the basic variable gravity model as a measure of the attractiveness of exports between countries, the democratic variable as a measure of political liberalization, the governance variable as a measure of institutional quality, and the variable of economic openness.
Table 7.1. Descriptive Statistics of Variables
|
Variable |
Obs |
Mean |
Std. Dev. |
Min |
Max |
|
lnEX |
198 |
8.02 |
1.49 |
3.82 |
10.43 |
|
lnGDPIDN |
198 |
27.19 |
0.30 |
26.78 |
27.72 |
|
lnGDPAPT |
198 |
26.64 |
1.66 |
23.15 |
29.95 |
|
lnDIST |
198 |
7.28 |
0.59 |
6.26 |
8.08 |
|
lnOPENAPT |
198 |
4.44 |
0.82 |
2.91 |
6.09 |
|
FDIIDN |
198 |
1.13 |
1.57 |
-2.75 |
2.92 |
|
FDIAPT |
198 |
4.42 |
5.46 |
-0.05 |
26.52 |
|
POLIDN |
198 |
5.77 |
4.94 |
-7 |
9 |
|
POLAPT |
198 |
1.61 |
6.82 |
-8 |
10 |
|
GOVIDN |
198 |
54.97 |
6.59 |
43.83 |
66.92 |
|
GOVAPT |
198 |
69.26 |
11.11 |
46.16 |
89.13 |
The basic variable of the gravity model consists of Indonesia's export log to ASEAN + 3 countries as the dependent variable, Indonesia's GDP log as an exporting country, the ASEAN + 3
GDP log as an importing country, and the Distance log from Indonesia to each country ASEAN + 3 countries..
Next, the political liberalization variable is the democratization political index consisting of POLIDN for Indonesia and POLAPT for all ASEAN + 3 member countries. Table 7.1 shows the index of political liberalization as an approach to democratization on a scale ranging from -8 to 10. This shows that the political system in ASEAN + 3 countries is diverse, ranging from countries that have survived with a political system of autocracy for 22 years observations such as China and Vietnam (index value -7) and Singapore (-2), to very democratic countries such as Japan (10), South Korea (8), and the Philippines (8). Meanwhile, Indonesia has experienced periods that tend to be autarchic (index value -5 in 1998) but since then it has begun to undergo a process of democratization and has begun to stabilize until 2017 on a scale of 9 so that Indonesia is a very democratic country.
Then the institutional quality variable is shown by the Governance Index which is a calculation of the six indexes (control of corruption, government effectiveness, voice and accountability, political stability and absence of violence, regulatory quality, and rule of law) to describe the quality of institutions in ASEAN countries +3. The governance index that shows the quality of its value is in the range of 0 to 100, getting closer to the value of 100 means that the quality of a country's institutions is getting better and vice versa the closer to 0 the quality of institutions is considered poor. Table 7.1 shows that the governance index of ASEAN + 3 countries is in the range between 43.83 and 89.13. A value of 43.83 is the lowest value of Indonesia during 1999, indicating bad governance occurred because of the economic and political crisis the fall of the new order government turned to the reform era when it happened. Then, the value of 89.13 shows the average value of the best quality of governance among the countries observed achieved by Singapore and Japan.
The variable economic openness shows the freedom of flow of goods/services and capital between countries, represented by the variable openness and foreign direct investment. Trade openness in the lowest range of 2.91 is the natural logarithm of the percentage of Japan's trade openness in 1999 which was only 18.35% of its GDP. While the highest value of 6.09 is the natural logarithm of Singapore's% GDP trade which in 2008 reached 441%. Singapore is indeed a country with the highest level of trade openness
with an average of 300% then Malaysia, Thailand, and Vietnam averaging above 100%. Whereas the Philippines, Indonesia, South Korea, China and Japan, the average trade openness is between 60% - 100%. Then the foreign direct investment net inflow variable from the balance of payment for Indonesia (FDIIDN) reached its lowest point in 1998, which was -2.75 because the assets coming in from FDI were smaller than their liabilities. This happened because the economic and political crisis that hit Indonesia caused many investors to move their investments to other countries that were relatively safer and had less risk of crisis.
This study uses panel data and adopts a gravity model of international trade. The initial stage of research with panel data is to determine the best model among the three-panel data models commonly used, namely the Common Effect Model (CEM), Fixed Effect Model (FEM), or Random Effect Model (REM). This study determines using the Random Effect Model (REM) as the most appropriate panel data analysis method to achieve the research objectives for several reasons as follows :
First, the Fixed Effect Model Method cannot be used because this study adopts the concept of a gravity model using geographical distance variables between countries whose values are fixed throughout the year of observation (timeinvariant variable). The Fixed Effect Model method is a panel data model that assumes heterogeneity between individuals related to independent variables and unobserved effects remain constant over time and correlates with independent variables in the model. If the unobserved effect does not correlate with the independent variable, the Fixed Effect Model is inefficient. Therefore, this assumption causes the fixed-effect approach cannot be used to identify the impact on the variable whose value is fixed throughout the time of observation/time invariant variable (Gujarati and Porter, 2009 and Efendi and Setiawan, 2004: 116).
Second, according to Nachrowi (2006: 318), the selection of the Fixed Effect method or the Random Effect method can be done with consideration of the objectives of the analysis or there is a possibility that the data used as a basis for modeling can only be processed by one method alone due to various mathematical
technical problems that underlie the calculation. In the context of this study, FEM was constrained because it could not analyze time invariant data.
Third, according to Egger (2002) in Kepaptsoglou et al (2010)7 states that the selection of the right method whether fixed effect or random effect depends on the interests of analysis, data and state samples, and the theory underlying the model used. Both methods are indeed needed to analyze panel data, but random effects can be considered to be used if the research has an interest in estimating variables that do not change over time (time-invariant) in the gravity trade model
Fourth, based on the standard procedure Lagrange Multiplier test results show that the value of p-value (Prob> Chibar2) = 0.0209 <α = 0.05 (see attachment 2), then the random effect model is better than the common effect model
So by considering some reasons, this study establishes the random effect model as the method used to achieve the research objectives. The random effect model can be used to estimate explanatory variables whose values remain constant throughout the observation period such as distances in the gravity model. Then, REM assumes an unobserved effect is uncorrelated with all explanatory variables, whether the value of the explanatory variable is fixed throughout the time of observation or not. If the estimation results are compared between CEM and REM, the random effect model is superior to the common effect model because it is more efficient (Wooldridge, 2009: 493-496).
Table 7.2 below summarizes the results of the augmented gravity model using the Random Effect Model method :
Tabel 7.2 Estimation Results with the
Random Effect Model
|
Number of obs : 194 Number of : 9 countries : 1996 - 2017 Year : lnEX Variabel Dependen | |||
|
Variabel |
Coef. |
Std. err |
Prob. |
|
lnGDPIDN |
0.798*** |
0.150 |
0.000 |
|
lnGDPAPT |
0.821*** |
0.037 |
0.000 |
|
lnDIST |
-0.563*** |
0.138 |
0.000 |
|
lnOPENAPT |
0.421*** |
0.080 |
0.000 |
|
FDIIDN |
0.035 |
0.028 |
0.213 |
|
FDIAPT |
0.006 |
0.008 |
0.449 |
|
POLIDN |
0.025*** |
0.007 |
0.001 |
|
POLAPT |
0.025*** |
0.006 |
0.000 |
|
GOVIDN |
0.012** |
0.006 |
0.044 |
|
GOVAPT |
0.017*** |
0.005 |
0.001 |
|
_cons |
-35.49*** |
4.09 |
0.000 |
|
*** p < 0.01 , ** p < 0.05 , * p < 0.1 | |||
Trade between two countries is proportional to the economic size (GDP) of the two countries and inversely proportional to the distance, the gravity model shows a negative relationship between distance and trade because transportation costs will certainly be more expensive if the distance of the two trading countries is getting further. The equation is a gravity model of world trade (Krugman et al, 2012). In this study, economic size is represented by Indonesian GDP (GDPIDN) and GDP of ASEAN + 3 countries (GDPAPT) while distance is represented by distance (lnDIST).
Based on the results in table 7.2 Indonesia's GDP has a significant positive effect on Indonesia's exports to ASEAN + 3 at a 99% confidence level with a coefficient of 0.798. This shows that if there is an increase in Indonesia's GDP of 1%, Indonesia's exports to ASEAN + 3 will increase by an average of 0.798% with ceteris paribus requirements. GDPIDN is a representation
of Indonesia's productivity, the greater the value, the greater, the greater, the production capacity, the greater, to increase exports.
Meanwhile, the GDP coefficient of ASEAN + 3 countries (GDPAPT) as Indonesia's trade partner shows a coefficient of 0.821 has a positive effect with a confidence level of 99%. If GDPAPT increases by 1%, Indonesia's exports will increase by an average of 0.821%, ceteris paribus. GDPAPT shows the ability of absorption/absorption of the products it imports so that its imports increase along with the increasing size of the country's economy.
While the effect of distance on Indonesian exports shows a coefficient of -0.563 with a significance level of α = 1% or a confidence level of 99%, if the distance of Indonesia with ASEAN + 3 trading partner countries increases by 1% will reduce Indonesian exports by an average of -0.563%, ceteris paribus. This result can be interpreted that the farther the distance of Indonesia's export destination countries, the more expensive transportation costs to be borne thus reducing the volume of exports.
The results of estimated GDPIDN, GDPAPT, and DIST turned out to be in accordance with the concept of gravity models in the trade as stated by Tinbergen (1962) in Yuniarti (2007) as also quoted from the definition of Krugman et al (2012). The results of this study are in line with findings by Nguyen and Po (2017), Yogatama and Hastiadi (2016), Ullah and Yasmeen (2014), Anwar and Nguyen (2011), and Xuan and Xing (2008).
In the discussion of Chapter 2, a general description has been given (see figure 2.1) that a country's economic openness influences bilateral trade. In the context of this study, the economic openness of Indonesia's trading partner countries in ASEAN + 3 is represented by openness to trade, namely the total trade variable divided by gross domestic product (OPENAPT), which shows openness to transactions in goods and services. Then, from the capital side represented by foreign direct investment investing in Indonesia (FDIIDN) and in ASEAN + 3 countries (FDIAPT).
Table 7.2 estimation results show the coefficient of lnOPENAPT variable that is 0.421
with a 99% degree of confidence, meaning that if the level of trade openness shown by the ratio of trade to a gross domestic product of ASEAN + 3 countries increases by 1% will have a positive impact on increasing Indonesia's exports by an average of 0.421 % ceteris paribus. The results of the study are the same as Abidin et al (2013) which proves that the economic openness of OIC member countries has a significant positive effect on Malaysian exports. The output shows that economic integration in Southeast Asia and East Asia through the ASEAN Free Trade Area economic cooperation agreement and the East Asia Free Trade Agreement has had a positive and beneficial impact on Indonesian exports because all countries involved in the agreement open up their domestic economy to the flow of goods, more free services, capital, labor, and business actors8 so that Indonesian products can enter their domestic markets more easily.
Then FDI entering Indonesia does not affect Indonesia's exports to ASEAN + 3 countries. The same result happened in India as Mohanty and Sethi (2019) concluded that FDI did not have a significant impact on India's export performance. The characteristics between India and Indonesia are the same, namely having a potential market size. The total population of Indonesia reaches 2639 million people with a per capita income of USD 3846 per year, 50 million people belong to the upper-middle class, and 120 million residents are aspiring middle class is a large potential consumer of foreign investor products. The research output shows that government efforts to invite foreign direct investment which are expected to increase export productivity have not yielded satisfactory results because FDI entering Indonesia is oriented towards the domestic market or market-oriented investment, according to Kojima (1973) and Mallampally and Sauvant (1999) as FDI who are presently motivated to find a market in the host country. As the results of Abimanyu's study (1994) in Kuncoro (2006) on foreign direct investment of transnational companies in Indonesia conclude that FDI tends to be oriented towards the domestic market, even though the products produced have a comparative advantage for exports. The results of a study by Tjahjono (1998) also indicated that investment activities carried out so far by importing lots of
capital goods were directed to meet domestic demand, rather than being focused on export activities.
Then, the weakening of Indonesia's export performance10 caused a decline in the interest of export-oriented foreign investors to invest their capital in Indonesia. This can be listened to from the opinion of Zhang and Felmingham (2001) which states that the success of outward-oriented policies which is indicated by increased exports will attract FDI inflows due to the efficiency of private markets when competition in international markets encourages managerial efficiency and innovation that results in foreign investors becoming more interested in export-oriented domestic companies11. The climate of international trade competition will increase export productivity, reduce the cost of capital utilization, and promise a high rate of return for foreign investors. However, based on this explanation Indonesia's declining export performance causes export-oriented FDI to be less interested in investment in Indonesia.
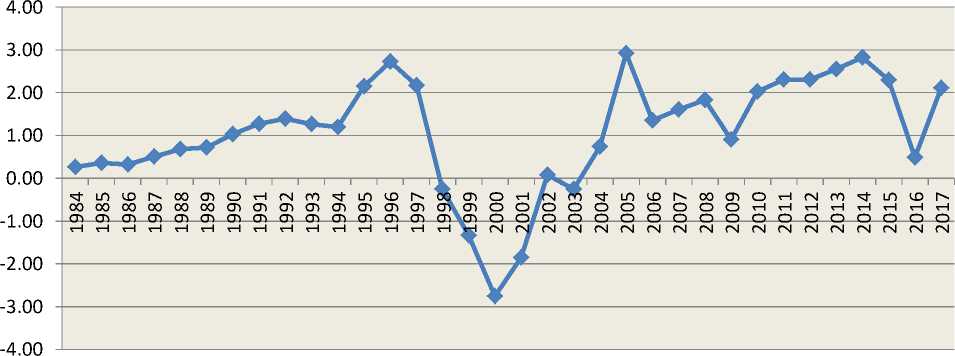
Indonesia's competitiveness in attracting FDI is still low resulting in investors being more interested in investing their capital in other countries that are more competitive and provide business efficiency. Figure 4.1 shows the statistics of net FDI inflows to Indonesia 1984-2017:
Source : World Development Indicator, World Bank (2018)
Figure 4.1 Trend of FDI Net Inflow (% GDP) to Indonesia
Based on the world ranking of FDI recipient countries, during the 1997 pre-crisis era Indonesia was among the main destination countries for FDI. Even during the 1990-1997 period, Indonesia ranked among the top 20 FDI recipient countries with a total value of FDI inflows reaching nearly 23.7 billion US dollars, only lower than Singapore and Malaysia in the ASEAN group. However, due to the 1997 crisis and the fall of the New Order government which has since then until now the post-crisis government has not been able to fully create a conducive investment/investment climate, as evidenced from a net inflow of FDI that fell to -0.25 (1998) even at the lowest point of -2.76 (2000) later in the following year showed a positive number with relatively slow fluctuations in progress. These negative and fluctuating net inflows are caused by many FDI withdrawing, relocating to other countries, or reducing the amount of FDI realization from the original plan. In the development of FDI investment in 2017 according to data from the Investment Coordinating Board (BKPM), the increase in FDI realization occurred in the tertiary sector with growth of 78%, while the primary and secondary sectors experienced a decline with negative growth of -2.2% and respectively -25.9%. The tertiary sector includes financial services and capital-intensive trade, not tradable sectors12 (goods-producing sector) such as
primary and secondary sectors so that the contribution of FDI to increase domestic productivity (towards GDP) tends to decrease, this also impacts on the contribution of FDI to insignificant exports.
Besides being caused by the impact of the economic crisis, Indonesia's low competitiveness attracts FDI inflows due to the high level of corruption. Based on Political Risk Service data from the International Country Risk Guide (2017) used in this study as one of the constituent components of the independent governance index variable, the value of Indonesia's control of corruption in 2018 is still at a low level, which is 3 of the highest value of 6, whereas in the year 2009 reached a score of 3.83 which means that there has been a decline in the performance of eradicating corruption. The high level of corruption causes a decrease in ease of investment so that it impedes investment flows, which ultimately inhibits economic growth (Mauro, 1995 in Pradiptyo, et al. 2018). Pradiptyo et al (2018) concluded that corruption is a source of investment inhibition, changing and reducing the proportion of investment, inviting black investors, reducing capital productivity, and disrupting policy implementation (especially those related to efforts to attract FDI investments that increase export productivity).
the financial industry, PT Mitsubishi UFJ Financial Group Bank acquired 94% of PT. Bank Danamon, the company's investment action aims at business expansion to take advantage of potential Indonesian consumers.
As a comparison of countries in ASEAN + 3 with the best corrupt control performance, Singapore with an average value of control of corruption of 4.50 can prove that a low level of corruption can increase the competitiveness of the country bearing the Lion Merlion in attracting FDI inflows to no less than 20% of GDP over the 22 years of observation. Singapore's export performance is also the highest among ASEAN + 3 countries, reaching an average of more than 300%. Therefore, it can be concluded that foreign investors are more interested in countries with a low level of corruption because it makes it easier for investors to invest (Pradiptyo, et al 2015).
Then the flow of direct foreign capital into ASEAN + 3 (FDIAPT) member countries was found to not affect Indonesia's exports to ASEAN + 3. The sample used is not strong enough to prove that FDIAPT is a determinant factor in the demand for Indonesian export commodities. Although not significant, positive coefficient values indicate that FDI entering ASEAN + 3 countries might not create trade substitutes for Indonesian export commodities. This means that Indonesia's export products still have a comparative advantage that cannot be substituted despite the presence of foreign capital. Onwuka's research results (2009) conclude the case of Turkey that FDI inflows into Turkey do not affect Turkish imports.
The development of democratization in Indonesia (POLIDN) and ASEAN + 3 countries (POLAPT) has a positive and significant impact on Indonesia's exports. If an increase in the scale of the Indonesian democracy index will increase Indonesia's exports to ASEAN + 3 by an average of 2.5% with a confidence level of 99%. Similarly, if an increase in the scale of the democratic index of ASEAN + 3 countries will increase Indonesia's exports to ASEAN + 3 by an average of 2.5% with a confidence level of 99%. The output of the study is consistent with that found by Assoumou Ondo (2017) that democratization increases exports of
Gabon, Yogatama and Hastiadi (2017) that democracy in Indonesia is a determinant factor that increases Indonesian exports to OIC membercountries, and Miaojie Yu (2010) towards 157 country observations, and Milner and Kubota (2005), and Mansfield et al (2000) which state that democratization contributes to the trade of up to 3% -4%.
Democracy has a positive and significant effect on Indonesia's exports because first, democracy has an impact on creating a fair and competitive market in both Indonesia and ASEAN + 3 trading partners. Democracy is inspired by the understanding of the teachings of the individualism which teaches freedom for every human being to achieve the goal of economic interests as a human right that must be upheld and prosperity will be better if each individual is given the freedom of business and opportunities for access to resources to pursue economic interests. Thus it will increase productivity through the creation of competitive markets. For bilateral trade relations, the principle of democracy in economics that has been applied has reduced trade barriers as a result of economic freedom/openness which creates a fair market.
Second, democracy has a positive and significant impact on increasing Indonesia's exports because importing countries that implement democracy have a high degree of economic openness and trade barriers are evidenced by a higher percentage of trade on gross domestic product than when the importing country was still in the autocracy stage, thus providing opportunities for exporters enter the domestic market. For example, the Philippines in 1972-1985 was a very autocratic government with the lowest IV polity index value -9. In that span of years, the percentage of trade to GDP in the Philippines was only 47% on average. After experiencing improvements to a democratic country starting in 1987 until now with the highest IV polity index value 8 trade contributions to GDP reached an average of 80% or even reached 104% in 2000. Figure 4.1 below shows the trend of Indonesia's exports to the Philippines from 1972-2017:
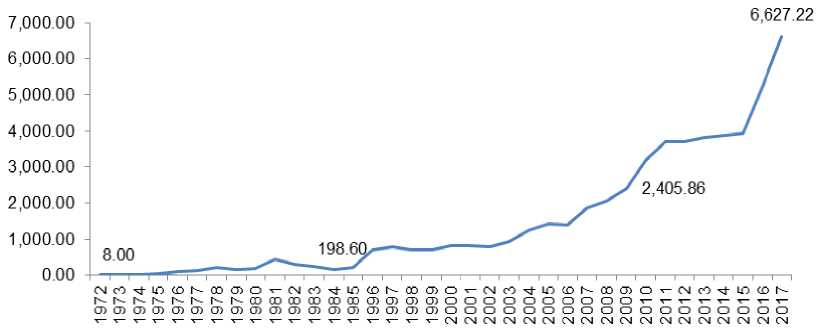
Figure 7.2 Development of Indonesian Exports to the Philippines (Million USD)
Based on Figure 7.2 the value of Indonesia's exports to the Philippines in 1972-1987 was very low at only US $ 8 million after an improvement in political institutions into democracy from 1987 to 2018. The Philippine economic openness to international trade was increasingly shown by the average trade% of GDP ratio 80% is an opportunity for Indonesian export products to enter the domestic market. It has been proven that since the period of the demonstration, Indonesian exports to the Philippines have been far more progressive.
Third, democracy increases Indonesian exports because the application of democratization improves the quality of institutions in Indonesia and ASEAN + 3 which has an impact on increasing trade, this section will be explained further in section 4.6.4 Institutional Quality of Indonesian Exports to ASEAN Countries + 3.
The ASEAN Charter Agreement is one of the important points is that ASEAN member countries agree to abide by the principles of constitutional democracy and governance which have a positive and significant impact on trade, especially Indonesian exports. There is indeed a unique feature of autocracy in ASEAN + 3, although Singapore, China, and Vietnam are politically autocratic countries, in the application of economic policies, especially the investment and pro-trade with the market, this is a successful example of integrating autocracy in politics and democracy in the economy.
The quality of Indonesian government institutions (GOVIDN) and ASEAN + 3 member countries (GOVAPT) has a positive and significant impact on Indonesia's exports to ASEAN + 3 with a
confidence level of 99%. An increase in the scale of the quality index of Indonesian government institutions increased Indonesia's exports to ASEAN + 3 by an average of 1.2%. Likewise, an increase in the scale of the institutional quality index of ASEAN + 3 member countries increased Indonesia's exports to ASEAN + 3 by an average of 1.7%. The output of this study is similar to the conclusions of Soeng and Cuyvers (2017) research that domestic institutional quality has a positive and significant effect on Cambodia's export performance, Abidin et al (2013) which proves that institutional quality in Malaysia has a significant positive effect on increasing exports of Malaysia, Yogatama and Hastiadi (2016) who found improvements in good governance of the Indonesian government and OIC member countries had a significant positive effect on increasing Indonesian exports to OIC member countries, Jasen and Nordas (2004) also concluded his research that the quality of domestic institutions had a positive and significant effect on bilateral trade, and Groot et al (2004 ) also concluded that poor quality institutions have an impact on increasing transaction costs in a trade so that good quality institutions have a positive and significant impact on increasing trade.
The contents of the ASEAN Charter is one of the points is that ASEAN member countries agreed to improve good governance institutional governance which turned out to have a positive and significant impact on trade, especially Indonesian exports. Good quality institutions are shown by decreasing the level of corruption (control of corruption), increasing the quality of government bureaucracy services (government effectiveness), increasing the quality of regulations that encourage the private sector (rule of quality) and improving the implementation of rule of law. will reduce the
risk of uncertainty from contract execution, reduce transaction costs and production costs, ensure the security of property rights, and increase confidence in bilateral trade matters.
Whereas political stability and strong security (political stability and absence of violence) create a conducive business climate for the public to carry out productive activities both in Indonesia as an exporter and in ASEAN + 3 as an importer. So that businesses will avoid the negative effects of political turmoil and fear of a lack of security in conducting business activities: producing,
exporting, or importing goods. The benefit for exporters (Indonesia) is that the domestic production process is not interrupted and increases the confidence of exporters selling their goods to countries that are safe from conflict. During the 22 years of observation in Southeast Asia and East Asia, there was no longstanding political and security instability like what happened in the Middle East. Therefore, Southeast Asia and East Asia are stable regions of prolonged political and security conflicts that have the potential to disrupt productivity and trade.
Then a good quality rule of law will guarantee order and certainty in law enforcement against any unlawful actions (eg piracy, robbery of property rights, etc.) of its citizens for the sake of creating a situation of order that helps minimize business risks. So that the exporting country (Indonesia) will increase its trade with countries that have good law enforcement because the trade costs they must bear are also low.
Thus, good quality institutions in trading partner countries will increase the confidence of exporters to export more of their products because of the low risks and costs. Likewise for domestic export producers who are getting better quality institutions in the country (Indonesia) will be incentivized to invest and innovate to produce better quality and quantity of products at low prices for the final product so that commodity competitiveness increases.
-
1. The economic openness of ASEAN + 3 member countries towards trade has a positive effect on Indonesia's exports to ASEAN + 3, these results indicate that the cooperation of the East Asia
Free Trade Area has a positive impact on the progress of ASEAN + 3 trade. While net foreign direct investment inflows to Indonesia and ASEAN + 3 member countries do not affect Indonesia's exports to ASEAN + 3.
-
2. Democratization in Indonesia and ASEAN + 3 has a positive effect on increasing Indonesia's exports to ASEAN + 3. Democracy creates a conducive economic environment in the form of a competitive market and good institutional quality so that Indonesia can increase productivity and for ASEAN + 3 to open its domestic market to other countries' export commodities.
-
3. The better quality of institutions in Indonesia will be an incentive for producers to invest and innovate to produce better quality and quantity of products at low prices for the final product so that the competitiveness of commodities increases. While the institutional conditions of ASEAN + 3 countries as export destinations become a determinant factor for Indonesian exports because all measures of governance are a consideration for business risks, the better the institutional quality of export destination countries, the business risks and trade costs are low to increase confidence for exports. Conversely, the poor quality of institutional export destination countries will reduce the interest of exporters because of the high risks and costs.
-
4. Indonesia's GDP which represents Indonesia's production capacity and the GDP of ASEAN + 3 member countries which indicates the ability of the absorption of ASEAN + 3 member countries to Indonesia's export commodities has proven to have a positive effect on increasing Indonesia's exports to ASEAN + 3. While geographical
distance has a negative effect on Indonesia's exports to ASEAN + 3, indicating the greater distance to the destination country of export the greater the cost of transportation, thereby reducing exports.
-
8.2. Policy Recommendations
-
1. The results of the gravity model research give the implication that to increase Indonesia's exports it is necessary to increase the economic capacity of Indonesia and its trading partner countries in ASEAN + 3 firstly, continue to implement and develop the ASEAN Free Trade Area and East Asia Free Trade Agreement implemented since 1997 because free trade can increase economic growth among the trading countries. Secondly, ASEAN organizations must maintain the conditions of a safe and conducive region of conflict as determined by the ASEAN Charter so as not to interfere with the production and trade activities of the Southeast and East Asia regions.
-
2. Indonesia needs to improve the quality of democracy and its governance institutions, especially in combating corruption (control of corruption), maintaining political stability and security (political stability), serving with effective and efficient bureaucracy (government effectiveness), presenting certainty and quality of pro-business regulations (regulation of quality), and guaranteeing certainty and reliable law enforcement (law and order/rule of law).
-
3. The government needs to make efforts to attract export-oriented foreign direct investment, namely the first way, make efforts to improve fundamentally the quality of government institutions, improve the quality of business ease (easy of doing business), and build infrastructure that supports production and export efficiency. Second, provide incentives for export-oriented foreign investment, for example, incentives in the form of tax cuts.
REFERENCES
Abidin, Irwan Shah Zainal et al. 2013. The Determinants of Exports between Malaysia and the OIC Member Countries: A Gravity Model Approach. Procedia Economics and Finance 5 (2013) 12 – 19. www.elsevier.com/locate/procedia.
Ahmed, Abdullahi. Cheng, D, E. dan Messinis, G. (2008). The Role of Exports, FDI and Imports in Development: New Evidence from Sub-Saharan African Countries. CSES Working Paper No. 39.
Acemoglu, Daron. (2009). Introduction to Modern Economic Growth. New Jersey: Princeton.
Acemoglu, Daron and James A. Robinson. (2012). Why Nation Fail : The Origins of Power, Prosperity, and Poverty. New York : Crown Publisher.
Anderson, J.E. and Marcouiller. (2002). Insecurity and the Pattern of Trade : An Empirical Investigation. The Review of Economics and Statistics, Vol. 84(2), 342-352.
Anwar, Sajid and Lan Phi Nguyen. (2011). Foreign direct investment and trade: The case of Vietnam. Research in International Business and Finance 25 (2011) 39–52.
Appleyard, Dennis R., dan Alfred J. Field, JR. (2001). International Economics. 4th Edition. New York: McGraw-Hill Companies, Inc.
ASEAN Secretariat. (2018). ASEAN Key Figure 2018. Jakarta : ASEAN Secretariat.
ASEAN Secretariat. (2018). ASEAN Statistical Yearbook 2018. Jakarta : ASEAN Secretariat.
ASEAN Secretariat. (2019). The ASEAN Charter. Jakarta : ASEAN Secretariat.
ASEAN Secretariat. (2018). Overview of ASEAN+3 Cooperation. Melalui https://asean.org/asean/external-relations/asean-3/ pada 29 April 2019
Balding, Christopher. (2010). A re-examination of the relation between democracy and international trade. The Journal of International Trade & Economic Development. 2010, 1–19.
Barro, Robert J.(1999).Determinants of democracy. Journal of Political Economy 107(S6): 158-183.
Blanchard, Oliver. (2003). Macroeconomics. 3th Edition. USA : Prentice Hall.
Carceres, A. (2009). Peranan Investasi Asing Langsung terhadap Pertumbuhan Ekonomi di Negara-Negara Asia Timur. Retrieved from http://www.laclolospalos.com
Cindy, Duc et al. (2004). Trade and democracy. An empirical investigation. seminar in june 2004 to the European Trade Study Group (ESTG) (Nottingham, September 2004) and at the AFSE Congress (Paris, September 2004).
Clarke, George RG. (2001). How Institutional Quality and Economic Factor Impact Technological Deepening in Deceloping Countries. Journal of International Development. 1097-1118.
de Groot, Henri L. F. et al. (2004). The Institutional Determinants of Bilateral Trade Patterns. KYKLOS, Vol. 57 - 2004 - Fasc. 1, 103–124
Donna, Duddy Roesmara, et al. (2018). Does Democracy Increase Bilateral Trade in MENA Region?. MPRA Paper No. 86369, posted 25 April 2018 15:44 UTC. Online at https://mpra.ub.uni-muenchen.de/86369/.
Doyle, Eleanor and Inmaculada Martinez-Zarzoso. (2011). Productivity, Trade, and Institutional Quality: A Panel Analysis. Southern Economic Journal 2011, 77(3), 726– 752.
Effendi, Nury dan Maman Setiawan. (2014). Ekonometrika Pendekatan Teori dan Terapan. Jakarta : Penerbit Salemba Empat.
Faruq, Hasan A. (2011). How Institutions Affect Export Quality. Economic Systems 35(2011) 586-606.
Francois, Joseph and Miriam Manchin. (2013). Institution, Infrastructure, and Trade. World Development, Vol. 46, issue C, 165-175.
Galiani, Sebastian and Gustavo Torrens. (2013). Autocracy, Democracy, and Trade Policy. Journal of International Economics, 93(1), Page 173-193.
Gujarati, N Damodar and Dawn C. Porter. (2009). Basic Economterics Fifth Edition. New York, USA : McGraw-Hill Irwin
Hill, Charles W.L. (2003). International Business : Competing in the Global Marketpalce – 4 th ed. New York, USA : McGraw-Hill.
Ikhsan, Mohamad. (2003). Reformasi Institusi dan Pembangunan Ekonomi. Working Paper No.1/2003. Jakarta : LPEM UI.
Iqbal, M. S. (2010). Causality Relationship between Foreign Direct Investment, Trade and Economic Growth in Pakistan. Asian Social Science, 6(9), 82–89.
Jawas, M. (2008). Pengaruh Penanaman Modal Asing dan Ekspor Terhadap Pertumbuhan Ekonomi di Negara – Negara Muslim: 20042005. Yogyakarta: Fakultas Ekonomi Universitas Islam Indonesia.
Krisharianto, Josef dan Hartono, D. (2007). Kajian Hubungan antara Pertumbuhan Ekonomi, Perdagangan Internasional dan Foreign Direct Investment. Fakultas Ekonomi-Universitas Indonesia.
Krugman, Paul et all. (2012). International Economics : Theory and Policy - 9 th ed. Boston, USA : Pearson.
Mansfield, Edward D, et al. (2000). Free to Trade: Democracies, Autocracies, and International Trade. American Political Science Review Vol. 94, No. 2 June 2000
Mohsen, Adel Shakeeb et al. (2016). Trade Liberalization, Export, and Imports in Syria. Foreign Trade Review XX(X) 1–12. Indian Institute of Foreign Trade. SAGE Publications.
Nurachmandani, Setya. (2009). Fisika 2 Untuk SMA/MA Kelas XI. Jakarta : Pusat Perbukuan, Departemen Pendidikan Nasional.
Kementerian Perdagangan. (2002). “ASEAN Free Trade Area (AFTA)”. Melalui http://www.kemendag.go.id/files/regulasi/2002/ 01/AFTA.htm pada 29 April 2019.
Kepaptsoglou, Konstantinos and Matthew G. Karlaftis and Dimitrios Tsamboulas. (2010). The Gravity Model Specification for Modeling International Trade Flows and Free Trade Agreement Effects: A 10-Year Review of Empirical Studies. The Open Economics Journal, 2010, 3, 1-13.
Krugman, Paul R. and Maurice Obstffeld. (2000). International Economics Theory and Policy Fifth Edition. Massachusetts : Addison-Wesley Publishing Company.
Krugman, Paul R et al. (2012). International Economics Theory and Policy 9th edition. Massachusetts : Addison-Wesley Pearson Publishing Company.
Kojima, Kiyoshi. (1973). ‘A Macroeconomic Approach to Foreign Direct Investment’. Hitosubashi Journal of Economics, Vol. 14, 121.
Kojima, Kiyoshi. (1975). ‘International Trade and Foreign Investment : Substitute or Conmplement’. Hitosubashi Journal of Economics, Vol. 16, 1-12.
Kuncoro, Mudrajad. (2007). Ekonomika Industri Indonesia : Menuju Negara Industri Baru 2030? Yogyakarta : CV Andi Offset.
Kuncoro, Mudrajad. (2006). Ekonomika Pembangunan : Teori, Masalah, dan Kebijakan. Yogyaarta : UPP STIM YKPN.
Linders, GJM et al. (2005). Cultural and Institutional Determinants of Bilateral Trade Flows. Tinbergen Institute Discussion Paper, TI 2005-074/3.
Mankiw, N. Gregory. (2016). Macroeconomics 9th ed. New York: Worth Publishers.
Markusen, James R. (1995). ‘The Boundaries Enterprises and The Theory of International Trade’. Journal of Economic Perspectives, Vol. 9, No. 2, 169-189.
Mauro, P. (1995). “Corruption and Growth”. The Quarterly Journal of Economics 110(3): 681-712.
Milner, Helen V and Keiko Kubota. (2005). Why the Move to Free Trade? Democracy and Trade Policy in the Developing Countries. International Organization, Vol. 59, No. 1 (Winter, 2005), pp. 107-143. Cambridge University Press.
Nachrowi, N. Djalal dan Hardius Usman. (2006). Pendekatan Populer dan Praktis Ekonometrika untuk Analisis Ekonomi dan Keuangan. Jakarta: LPFE Universitas Indonesia.
North,D. (1990). Institution, Institutional Change and Econoic Performance. New York : Cambridge University Press.
Ondo, Assoumou. (2017). Trade Openness and Democracy: The Case of Gabon. Modern Economy, 2017, 8, 191-198
O’Rourke, KH and Taylor. (2006). Democracy and Protecsionism. NBER Working Paper Series 12250.
Pradiptyo, Rimawan & Wirotomo, Abraham & Hilman, Rafiazka & Azzani, Meikha. (2015).
Naskah Akademik Prakarsa Bulaksumur Anti Korupsi.
Pradiptyo, Rimawan dkk. (2019). Naskah Akademik Menghapus Pulau Integritas atau Membangun Kepulauan Berintegritas ? Rekomendasi Ekonom Terhadap Pelemahan Penindakan dan Pencegahan Korupsi.
Rahardja, Prathama dan Mandala Manurung. (2008). Pengantar Ilmu Ekonomi (Mikroekonomi dan Makroekonomi) edisi ketiga. Jakarta : Lembaga Penerbit Fakultas Ekonomi Universitas Indonesia.
Salvatore, Dominick. (2013). International Economics : 11th ed. United States of America : Jhon Wiley & Sons, Inc .
Suliswanto, Muhammad Sri Wahyudi. (2016). Tingkat Keterbukaan Ekonomi Di Negara Asean-5. Jurnal Neo Bis Volume 10, No. 1, Juni 2016.
Tambunan, Tulus. T.H. (2004).Globalisasi dan Perdagangan Internasional. Bogor: Ghalia Indonesia.
Tjahjono, Endy Dwi. (1998). Fundamental Ekonomi, Contagion Effect Dan Krisis Asia. Buletin Ekonomi Moneter dan Perbankan, September 1998. Jakarta : Bank Indonesia.
Todaro, Michael P and Stephen C. Smith. (2015). Economic Development 12th ed. United States of America : Pearson.
Ullah, Muhammad Shariat and Farida Yasmeen. (2014). FDI and export linkage revisited: The case of Bangladesh. Journal of Economic & Financial Studies, 02(01), 14-19. Vol. 02, No. 01: February (2014).
Vernon, Raymond. (1966). ‘International Investment and International Trade in the Product Life Cycle’. Quarterly Journal of Economics, Mei 1966, 190-207.
Wei, Yingqi dan Xiaming Liu. (2001). ‘Foreign Direct Investment in China : Determinan and Impact’. Edward Elgar Publishing, Inc. Massachusetts.
World Bank. (1993). The East Asian Miracle. Oxford University Press. London.
Xuan, Nguyen Thanh and Yuqing Xing. (2008). Foreign direct investment and exports The experiences of Vietnam. Journal of Economics of Transition Volume 16(2) 2008, 183–197.
Yogatama, Aditya Rangga dan Fithra Faisal Hastiadi. (2016). The Role of Democracy and Governance in the Enhancement of Indonesian Export to The Organization of Islamic Coorporation (OIC) Countries. Journal of Economic Cooperation and Development 37, 4, 2016, page. 51-78.
Yu, Miaojie. (2010). Trade, Democracy, And The Gravity Equation. Journal of Development Economics 91 (2010) 289–300.
Yudanto, Noor dan M. Setyawan Santoso. (1998). Dampak Krisis Moneter Terhadap Sektor Riil. Bulletin of Monetary Economics and Banking. Vol. 1 No. 2 (1998) September. Jakarta : Bank Indonesia.
Yuniarti, Dini. (2007). Analisis Determinan Perdagangan Bilateral Indonesia Pendekatan Gravity Model. Jurnal Ekonomi Pembangunan. Vol.12 No.2, Agustus 2007 hal 99-109.
Yustika, Ahmad Erani. (2000). Industrialisasi Pinggiran. Yogyakarta : Pustaka Pelajar.
Yustika, Ahmad Erani. (2012). Ekonomi Kelembagaan : Paradigma, Teori, dan Kebijakan. Jakarta : Erlangga.
Widarjono, Agus. (2018). Ekonometrika : Pengantar dan Aplikasinya Disertai Panduan Eview Edisi Kelima. Yogyakarta : UPP STIM YKPN.
Williamson, O.E. (1985). The Economic Institutions of Capitalism : Firms, Mrkets, Relational Contracting. New York : Free Press.
Zhang, Qing and Bruce Felmingham. (2001). The Relationship between Inward Direct Foreign Investment and China’s Provincial Export Trade. China Economic Review. 12, 82-99
|
World Bank. (2019). World Development Indicator. |
http://ditjenppi.kemendag.go.id/index.php/asea n/asean-1-fta/asean-china |
|
Wooldridge, Jeffrey M. (2009). Intorductory Econometrics A Modern Approach 5th Edition. South-Western USA : Cengage Learning. |
http://ditjenppi.kemendag.go.id/index.php/asea n/asean-1-fta/asean-jepang |
http://ditjenppi.kemendag.go.id/index.php/asea n/asean-1-fta/asean-korea
Appendix
-
Appendix 1: summary of statistical data
Variable ∣
Obs
Mean
Std. Dev.
Min
Max
InEX I
198
8.020085
1.494313
3.821192
10.42569
InGDPIDN I
198
27.1928
.3018706
26.78416
27.71762
InGDPAPT I
198
26.639
1.662023
23.15026
29.94958
InDIST I
198
7.279849
.5892673
6.263398
8.081475
InOPENAPT I
198
4.442371
.8184384
2.909573
6.090413
FDIIDN I
198
1.125324
1.570537
-2.75744
2.916115
FDIAPT I
194
4.419822
5.465693
-.0529075
26.52121
POLIDN I
198
5.772727
4.938594
-7
9
POLAPT I
198
1.611111
6.820786
-8
10
GOVIDN I
198
54.97159
6.587444
43.83333
66.91667
GOVAPT I
198
69.26006
11.11758
46.16667
89.125
-
Appendix 2: test results of Breusch and Pagan Lagrangian multiplier test
Breusch and Pagan Lagrangian multiplier test for random effects
InEX[NEGARA,t] = Xb + u[NEGARA] + e[NEGARA,t]
Estimated results:
I Var sd = sqrt(Var)
---------+-----------------------------
|
InEX I 2.043075 e I .0765723 u I .0030636 |
1.429362 .276717 .05535 | |
|
Test: |
Var(U) = 0 | |
|
chibar2(01) = |
4.14 | |
|
Prob > chibar2 = |
0.0209 |
-
Appendix 3: estimation results Random Effect Model GLS regression
R andean-effects
Group variable
R-sq: within between overall
corr(u_if X)
GLS regression
NEGARA
= 0.8262
= 0.9865
= 0.9429
= O [assumed}
Number of obs =
Number of groups =
Obs per group: min =
194
9
IS
21.6
22
2137.13
0.0000
Wald c
Frob >
avg = max =
hi2(10) =
chi2 =
InEX I
Coef. Std. Err. z
P>∣Ξ∣
[95% Conf.
Interval]
InGDPIDN I
.7984109 .1505719 5.30
0.000
.5032954
1.093526
InGDPAPT I
.8215802 .0372682 22.05
0.000
.743536
.3946245
InDIST I
-.5635107 .1381862 -4.05
0.000
-.3343507
-.2926707
InDPENAPT ∣
.4211434 .0307093 5.22
0.000
.262 9562
.5793307
FDIIDN I
.0349334 .0230336 1.25
0.213
-.0200213
.0898881
FDIAFT I
.006376 .003425 0.76
0.449
-.0101425
.0223946
POLIDN I
.0256154 .0074126 3.46
0.001
.0110399
.0401463
FOLAFT I
.02524 .0061255 4.12
0.000
.0132336
.0372465
GOVIDN I
.0121351 .0060327 2.01
0.044
.0003112
.0239591
GOVAPT I
.0173346 .0051334 3.35
0.001
.0072253
.0275439
_cons I
-35.49425 4.09815 -8.66
0.000
-43.52647
-27.46202
sigma_u ∣ sigma_e ∣ rho I
.05535001
.27671701
.03347037 (fraction of variance due
to u i)
-
Appendix 4: Multicollinearity Detection Test Results with VIF
Variable ∣ VIF 1/VIF
|
InDIST I |
7.10 |
0.140881 |
|
InOPENAPT ∣ |
4.90 |
0.204036 |
|
GOVAPT I |
3.79 |
0.263567 |
|
InGDPAPT ∣ |
3.75 |
0.266663 |
|
InGDPIDN ∣ |
3.34 |
0.299454 |
|
FDIIDN I |
3.32 |
0.300823 |
|
FDIAPT I |
2.59 |
0.346233 |
|
GOVIDN I |
2.62 |
0.381665 |
|
FOLIDN I |
2.03 |
0.480019 |
|
POLAPT I |
2.02 |
0.493390 |
----------+-----------
Mean VIF ∣ 3.58
Bieasch-Pagan ∕ Cook-Beisberg test for Iieteroskedasticity Ho: Constant variance Variables: fitted values of InEX
chi2(l) = 1.22
Prob > cħi2 = 0.2631
Wooldridge test for autocorrelation in panel data HO: no first-order autocorrelation
F( 1, 8) = 2.542
Prob > F = 0.1495
143
Discussion and feedback