Profitability, Company Sizes, Number Of Audit Committe, And Size Of KAP On Audit Delay (Empirical studies in property and real estate companies listed on the Indonesia Stock Exchange in 2014 - 2018)
on
Vol. 13 No.2, Agustus 2020
ISSN : 2301-8968
JURNAL
EKONOMI KUANTITATIF TERAPAN
Pengeluaran Pemerintah Sektor Pertanian, Produksi dan Kemiskinan Pedesaan di Indonesia Bayu Kharisma, Adhitya Wardhana, Aldo Febrari Hutabara
Mother’s Status and The Prevalence of Smoking Habits Among Adolescent A Survey in Pontianak City, Indonesia
Restiatun Massardi
Profitability, Company Sizes, Numer of Audit Committee, and Size of KAP on Audit Delay
Audina Ria Mawardani, David Adechandra Pesudo
Volatilitas Kurs dan Saham Mengikuti Model EGARCH(1,1) Berdistribusi Versi Skew Normal dan Student-t
Anggita M. Kusumawati, Didit B. Nugroho, Leopoldus R. Sasongko
Benarkan Perempuan Bekerja dan Berpendidikan Mempengaruhi Tingkat Perceraian Kasus Jawa Barat Nenny Hendajany, Ae Suaesih
Analisis Pengaruh Substitusi Tenaga Kerja Asing Terhadap Tenaga Kerja Domestik Pada Masa Sebelum dan Sesudah Kebijakan Bebas Visa Kunjungan Di Indonesia Firda Zahrani Hidayat, Palupi Lindiasari Samputra, dan Heru Subiyantoro
Apakah Indeks Pembangunan Manusia dan Hotel Mempengaruhi Disparitas Pendapatan
Muhammad Amrullah, Setyo Tri Wahyudi, Marlina Ekawaty
Eksistensi Industri Keci Kerajinan Kuningan di Kabupaten Klungkung
Ni Nyoman Yuliarmi, Anak Agung Istri Ngurah Marheni
Analisis Pengeluaran Rumah Tangga Dalam Bidang Pendidikan, Kesehatan dan, Biaaya Adat di Kecamatan Tembuku Kabupaten Bangli
I Wayan Wenagama
Integrasi Perdagangan dan Keselarasan Siklus Bisnis di ASEAN
Halaman Denpasar ISSN
JEKT Volume 13 Nomor 2 211-356 Agustus 2020 2301-8968
EKONOMI KUANTITATIF TERAPAN
VOLUME 13 NO.2 AGUSTUS 2020
SUSUNAN REDAKSI
EDITOR
I Made Endra Kartika Yudha Anak Agung Ketut Ayuningsasi Anak Agung Bagus Putu Widanta
DEWAN EDITOR
I Wayan Sukadana
Ni Putu Wiwin Setyari
I Komang Gde Bendesa
Anak Agung Istri Ngurah Marhaeni Luh Gede Meydianawathi
Ni Made Tisnawati
MITRA BESTARI
Adrianus Amheka, Politeknik Negeri Kupang Made Antara, Universitas Udayana Mohammad Arsyad, Universitas Hasanudin Kadek Dian Sutrisna Artha, Universitas Indonesia
Djoni Hartono, Universitas Indonesia
Palupi Lindiasari, Universitas Indonesia Devanto Shasta Pratomo, Universitas Brawijaya Deniey Adi Purwanto, Institut Pertanian Bogor Ni Made Sukartini, Universitas Airlangga Setyo Tri Wahyudi, Universitas Brawijaya Muhammad Halley Yudhistira, Universitas Indonesia
ADMINISTRASI DAN DISTRIBUSI
I Ketut Suadnyana Ida Ayu Made Widnyani
Jurnal Ekonomi Kuantitatif Terapan diterbitkan oleh Program Studi Ekonomi Pembangunan Fakultas Ekonomi dan Bisnis Universitas Udayana dua kali dalam setahun bulan Februari Dan Agustus
ALAMAT
Ruang Jurnal, Gedung BJ lantai 3 Fakultas Ekonomi dan Bisnis Universitas Udayana Jalan PB Sudirman Denpasar
Phone: +62-361-255511/ Fax: +62-361-223344
E-mail: jekt@unud.ac.id
http://ojs.unud.ac.id/index.php/jekt
ISSN : 2301-8968
Jurnal Ekonomi Kuantitatif Terapan (JEKT) adalah jurnal yang menerapkan double blind review pada setiap artikel yang diterbitkan. JEKT diterbitkan oleh Program Studi Ekonomi Pembangunan Fakultas Ekonomi dan Bisnis Universitas Udayana dua kali dalam setahun yaitu bulan Februari dan Agustus. JEKT diterbitkan sebagai kelanjutan dari Jurnal Input, Jurnal Sosial dan Ekonomi. Input terbit berkala sebanyak dua kali dalam setahun, dengan Nomor ISSN 1978-7871, dan di tahun kelima, INPUT telah terbit sebanyak sembilan edisi, dengan terbitan terakhirnya adalah Volume V, Nomor 1 Februari 2012. Pembaharuan INPUT menjadi JEKT tercetus pada pertemuan antara tim redaksi jurnal jurusan bersama pimpinan kampus, awal Maret 2012. Setelah melakukan beberapa evaluasi dan dengan merujuk kepada Peraturan Direktur Jenderal Pendidikan Tinggi Kementrian Pendidikan Nasional Republik Insonesia Nomor 49/dikti/kep/2011 tentang Pedoman Akreditasi Terbitan Berkala Ilmiah, maka terbitlah jurnal jurusan : Jurnal Ekonomi Kuantitatif Terapan dimulai dari Volume V, Nomor 2 Agustus 2012.
Jurnal Ekonomi Kuantitatif Terapan (JEKT) beralamat di Ruang Jurnal, Gedung Program Ekstensi Lantai 1, Fakultas Ekonomi dan Bisnis Universitas Udayana. Jalan PB Sudirman Denpasar, Phone: +62-361-255511/Fax: +62-361-223344. Proses registrasi dan submit artikel dapat dilakukan melalui http://ojs. unud.ac.id/index.php/jekt. Untuk bantuan teknis, penulis dapat menghubungi, email: jekt@unud.ac.id, SMS dan WA : +6281338449077.
Berdasarkan Surat Keputusan Direktur Jenderal Penguatan Riset dan Pengembangan Kementerian Riset, Teknologi, dan Pendidikan Tinggi Nomor 36a/E/KPT/2016 tanggal 23 Mei 2016, JEKT dinyatakan telah terakreditasi B oleh Dikti. Selain terakreditasi oleh Dikti, JEKT juga telah terindeks pada Google Scholar, IPI, dan DOAJ.
JURNAL
EKONOMI KUANTITATIF TERAPAN
VOLUME 13 NO.2 AGUSTUS 2020
PENGANTAR REDAKSI
Pembaca yang terhormat,
Sampai dengan edisi ini terbit, jika pembaca menelusuri deretan jurnal-jurnal yang terdaftar di Sinta dengan kata kunci penelusuran “kuantitatif”, maka yang akan muncul adalah Jurnal Ekonomi Kuantitatif (JEKT). Dengan menjadi satu-satunya jurnal dengan fokus kuantitatif, maka JEKT dituntut untuk menampilkan terbitan dengan menggunakan pendekatan kuantitatif. Kalangan peneliti ekonomi, pembangunan dan ilmu sosial lainnya di Indonesia tentunya sudah tidak asing lagi dengan penerapan metode kuantitatif dalam melakukan analisis, khususnya analisis empiris. Terlepas dari semua itu, diatas segala kemutakhiran metode kuantitatif yang digunakan, “ceritera” yang mampu menarik pembaca dan tentunya para pembuat kebijakan untuk berpastisipasi aktif dalam membaca dan menulis di JEKT adalah yang utama. Rangkaian “ceritera” yang baik dan metode kuantitatif yang sesuai tidak akan bermakna jika data yang digunakan tidak transparan dan tidak valid.
Slogan menarik mengenai data digunakan oleh BPS, “Data Mencerdaskan Bangsa”, JEKT berkomitmen untuk berperan aktif dalam mewujudkan slogan tersebut menjadi kenyataan. Meskipun tidak selalu data yang digunakan artikel yang dipublikasi oleh JEKT menggunakan data BPS sebagai “menu” utama dalam analisisnya, data BPS pasti hampir selelu menjadi rujukan dalam setipa artikel dalam terbitan JEKT. Pentingnya satu pemahaman dan satu sumber dalam data memegang peran penting dalam analisis dan diskusi yang akan melahirkan implikasi kebijakan yang lebih tepat sasaran. Dalam edisi kali ini, JEKT kembali menerbitkan 10 artikel dengan sumber dan jenis data serta metodologi yang beragam.
Sumber data yang digunakan oleh penulis dalam edisi ini cukup bervariasi mulai sumber data sekunder sampai data primer. Artikel dengan sumber data sekunder sendiri juga memiliki variasi jenis data yang beragam mulai dari data mikro antara lain dari sumber BPS.
Akhir kata, redaksi menyimpulkan bahwa artikel-artikel yang diterbitkan oleh JEKT mulai mengalami pergeseran sejak kemunculannya pertama kali lebih dari 10 tahun silam, utamanya dari sisi data yang digunakan. Semakin banyak artikel-artikel yang menampilkan analisis dengan menggunakan data mikro baik dari sumber sekunder maupun primer. Meskipun demikian JEKT tetap membuka diri untuk artikel-artikel dengan penggunaan data agregate. Kembali ke Alenia pembuka di atas, yang terpenting bagi JEKT dalam terbitannya adalah “ceritera” yang menarik, metode kuantitatif yang sesuai dan data yang valid.
pISSN : 2301 – 8968
JEKT ♦ 13 [2] : 243-258
eISSN : 2303 – 0186
PROFITABILITY, COMPANY SIZES, NUMBER OF AUDIT COMMITTE, AND SIZE OF KAP ON AUDIT DELAY
(Empirical studies in property and real estate companies listed on the Indonesia Stock Exchange in 2014 - 2018) Audina Ria Mawardani, David Adechandra Pesudo
Universitas Kristen Satya Wacana
ABSTRACT
This study to describe the influence of Profitability, Company Size, Number of Audit Committees, and KAP Size on audit delay both partially and simultaneously on audit delay on Property and Real Estate companies in 2014-2018. The sampling technique used was purposive sampling. The samples in this study were 36 companies in the Property and Real Estate sector which were listed on the Indonesia Stock Exchange in 2014-2018, so that the research data amounted to 180. In this study using descriptive statistical analysis techniques, classic assumption test, and panel data regression analysis. The results of this study indicate that profitability and company size have a significant effect on audit delay, while for the number of audit committees, KAP size has no significant effect on audit delay. Silmultically that profitability, company size, number of audit committees, and KAP Size significantly influence the audit delay of property and real estate companies in 2014-2018.
Keywords:Audit Delay, Company Size, Number of Audit Committees, Profitability, Size of KAP.
PROFITABILITAS, UKURAN PERUSAHAAN, JUMLAH KOMITE AUDIT, DAN UKURAN KAP TERHADAP PENUNDAAN AUDIT
(Studi empiris pada perusahaan property dan real estate yang terdaftar di Bursa Efek Indonesia tahun 2014 - 2018) ABSTRAK
Penelitian ini mendeskripsikan pengaruh Profitabilitas, Ukuran Perusahaan, Jumlah Komite Audit, dan Ukuran KAP terhadap penundaan audit baik secara parsial maupun simultan terhadap penundaan audit pada perusahaan Properti dan Real Estate tahun 2014-2018. Teknik pengambilan sampel yang digunakan adalah purposive sampling. Sampel dalam penelitian ini adalah 36 perusahaan sektor Properti dan Real Estate yang terdaftar di Bursa Efek Indonesia tahun 2014-2018, sehingga data penelitian berjumlah 180. Dalam penelitian ini menggunakan teknik analisis statistik deskriptif, uji asumsi klasik, dan analisis regresi data panel. Hasil penelitian ini menunjukkan bahwa profitabilitas dan ukuran perusahaan berpengaruh signifikan terhadap audit delay, sedangkan untuk jumlah komite audit, ukuran KAP tidak berpengaruh signifikan terhadap audit delay. Secara simultan bahwa profitabilitas, ukuran perusahaan, jumlah komite audit, dan ukuran KAP berpengaruh signifikan terhadap audit delay pada perusahaan property dan real estate tahun 2014-2018.
Key words: Divorce, early marriage, education, career women
INTRODUCTION
In 2014 the property market on Southeast Asia experienced a very significant growth due to fundamental improvements in the macro economy. In Indonesia the growth of the property sector was driven by the rapid growth of the middle class which occurred in 2013 which had increased from 2004 by 37% to 56.7% (Amani & Waluyo, 2016). The property and real estate sector is one of the primary needs for which people certainly need a place to live. With the need for shelter, the government estimates that the price and availability of property in the residential sector in 2019 will increase. Some policies from the government, namely the easing of loan to value (LTV), and the million housing program can make it easier for people to the lower middle class (Kontan.co.id, 2019).
Proven Indonesia Stock Exchange (IDX) recorded the best sectors during the beginning of 2019 were property, and real estate and building construction. Noted that the sector filled with property stocks grew to 7.37% year to date (ytd). The highest of the nine sectors in the IDX (Kontan.co.id, 2019). The news is good news for investors and certainly this sector's shares will be the choice of investors to invest, causing the need for financial statements in this sector to increase, and it is expected that audit delay in this sector will also be smaller. On June 29, 2018, the Indonesia Stock Exchange noted that several companies had not yet submitted audited financial statements. From the data submitted by IDX, there are 5 (five) companies from 40 companies that have not reported the midyear audited financial statements as of 30
June 2018. For companies that have not reported the mid-year audited financial statements to the Indonesia Stock Exchange will be subject to sanctions. The deadline for submitting audited financial statements is August 30 and August 31, 2018 (Dani, 2018).
The above problem is the background of this research that the accuracy of financial reporting is a key element in adequate financial records and affects the value of information from financial statements, so that when an audit delay occurs it can have a negative impact on external parties, because the audited financial statements contain value information and profit generated by the company (Tama, 2015). In the submission of financial statements stipulated in PT Bursa Efek Jakarta (2004) regarding the obligation to submit information states the company must submit an audited financial report by a public accountant no later than the end of March at the end of the book closing date. After March 31, it is included in the audit delay. In Kartika (2011) states the length of the process of completing an audited financial statement measured from the closing date of the financial year to the date the audit financial report was issued is called audit delay.
This study tries to examine the factors that can affect audit delay. Factors thought to influence audit delay include profitability of company size, number of audit committees, and size of KAP. According to research by Prameswari (2015) states profitability has a significant effect on audit delay. This opinion is supported by research which states that profitability is very influential on audit delay (Tama, 2015). This opinion is
different from the results of Apriyana (2017) research which states that profitability has no effect on audit delay. According to research conducted Juniati, MS, & A (2016) states that company size has a significant effect on audit delay. This opinion is supported by research which states that company size has a significant effect on audit delay (Apriyana, 2017). These results are different from subsequent studies which state company size does not affect audit delay (Saemargani, 2015).
Previous research states that the number of audit committees has no significant effect on audit delay (Indriani, 2016). This research is supported by research which states that the structure of independent commissioners on the audit committee does not have a significant influence on the timeliness of financial statements (Purbasari & Rahardja, 2014). These results differ from Pattiasina (2017) research that the total audit committee has a significant effect on audit delay. According to research conducted by Saemargani (2015) states the size of KAP has no significant effect on audit delay. This research is supported by the results which state that size of KAP does not have a significant effect on audit delay (Apriyana, 2017). In contrast to subsequent studies which stated the size of the KAP affect audit delay (Yuanita, 2012).
Based on the differences in the above research results motivate researchers to re-examine the "Effect of Profitability, Company Size, Number of Audit Committees, and Size of KAP on Audit Delay (Empirical Study on Property and Real Estate Companies listed on the Indonesia Stock Exchange in 2014-2018 ".
This study aims to describe the effect of profitability, company size, number of audit committees and size of KAP on audit delay. The formulation of the problem in this study are whether profitability, company size, number of audit committees, and size of KAP have a significant effect on audit delay in property and real estate companies in 2014-2018. The focus of this research is on the 2014-2018 audit of financial statements, because when the number of comparative years increases, it can describe the actual conditions and the results to be obtained accurately. The independent variables used include profitability, company size, number of audit committees, and size of KAP, the reason for choosing this variable, because it is closely related to the company's annual financial statements. This study differs from previous studies by including the independent variable number of audit committees on the object of real estate and property research, because in a company must have an audit committee, from several previous studies there are still differences in research results, so that this study will perfect the results of previous studies.
Research Hypothesis
Audit delay is the length of the short process of completing an audit, which is seen from the closing date of the financial year to the date the audit report is issued. Audit delay can affect the accuracy of the information published, so that it will affect the level of uncertainty in making decisions based on published information (Kartika, 2011). This theory is reinforced by research which states that the longer completion of financial statement audits can trigger negative
effects on companies, because the slow audit report causes accounting information to be unreliable and irrelevant, and can create a lack of investor confidence (Felicia & Pesudo, 2019).
Profitability is a ratio to determine a company's ability to earn profits through sales or production (Bawafi & Prasetyo, 2015). This can be seen from the sales profit and investment income. To determine the profitability ratio, you can compare components in the financial statements, especially on the balance sheet and income statement. The profitability ratio for the measurement can be done with several periods. The purpose of doing with several periods is to see the development of a company in a certain period, both to see the decline or increase, at the same time with this ratio can find the cause of these changes (Kasmir, 2015a).
The purpose of the company or external parties using profitability ratios, namely: can determine the profits earned by the company in a certain period, can assess a development from earnings over time, and to assess the size of net profit after tax generated by the company (Kasmir, 2015b). The higher the profitability, the audit delay will be lower and the lower the profitability will make the audit delay higher(Tama, 2015). This means that when a company has a high level of profitability, it will rush to report its company's financial statements, because that is good news for external parties which must be immediately communicated to the public (Juniati et al., 2016). But when the level of profitability is low, the auditor will be more careful in the audit process, this situation results in the length of time the financial statements are
presented (Prameswari, 2015). From the description above, this study predicts that profitability can have a significant affect on audit delay. If the higher the profitability of company, the lower the audit delay of the company's financial statements, the lower the profitability of the company will cause a higher audit delay,because when a company with high profitability will immediately announce the good news to the public so that investors feel interested in investing in the company. Based on the explanation above, the hypothesis can be formulated:
H1: Profitability affect negatively on audit delay
Inopinion of Maryani, Respati, & Safrida (2017) the size of company assets can be a reference to determine the size of a company. In this case the size of the company can be interpreted as the size of a company. The larger the company, the performance of the company is increasing because in the company there are many employees who are competent and have enough business experience, and vice versa (Juniati et al., 2016). From the description above, this research suggests that the size of a company can have a significant effect on audit delay, so that when the size of the company will make the audit delay produced lower and vice versa the smaller the size of the company, the higher the audit delay, because the size of the company large will tend to finish financial statements more quickly and in large companies must have good internal control, making it easier for auditors to audit financial statements.
H2: Company size affect negatively on audit delay
According to POJK No 11/POJK.03 (2016), the Audit Committee is responsible to the Board of Commissioners and has the task of carrying out the functions of the Board of Commissioners. The minimum number of committee members is 3 (three) people from the Independent Commissioner and the issuer's external parties. The chair of the audit committee is the Independent Commissioner. So it can be concluded that the audit committee is a committee formed by the Board of Commissioners responsible for assisting the duties of the Board of Commissioners in conducting internal monitoring, ensuring the effectiveness of external auditors and internal auditors(Candradewi, 2019). In this study suspect that the number of audit committees has a significant impact on audit delay. When the company complies with regulations regarding the minimum number of audit committees amounting to 3 (three) people, the audit delay will be lower, and when the number of audit committees is less than 3 (three), the audit delay will be high, because the audit committee is tasked with overseeing internal and external auditors in the process audit, so it is expected that when the number of audit committees is in accordance with the standards it will make the possibility of a small audit delay. Based on the explanation above, the hypothesis can be formulated:
H3: The number of audit committees affect negatively on audit delay
According to Saemargani (2015) the Public Accountant Office (KAP) is a place for public accountants to provide services that have received permission from the Minister of Finance. Where in improving
the quality of financial statements, companies are required to use the services of a reputable accounting firm. In this case it can be shown that KAP is affiliated with The Big Four. It is assumed that KAP affiliated with The Big Four has a lot of experienced employees, so that when conducting audits more effectively and efficiently, and allows for faster completion of auditing reports (Prameswari, 2015).
In this study it is assumed that the larger the size of KAP, the smaller the audit delay, because KAP affiliated with The Big Four is assumed to have a lot of experienced employees, so that in conducting audits will be more effective and efficient, and allow the audit report completion faster. Based on the explanation above, the hypothesis can be formulated:
H4: Size of KAP affect negatively on audit delay
METHODS
This section will discuss data collection and selection, operational definitions and measurement of variables, and data analysis techniques. The data used in this study are secondary data with quantitative research data types, where the data is obtained from the company's annual financial statements that have been audited in the property and real estate sector in 2014-2018 which are listed on the Stock Exchange through the official website, www.idx.co .id. The data collection method in this study is documentation. This study uses a population of property and real estate
sector companies listed on the Stock Exchange in 2014-2018, amounting to 45 companies. The sampling technique in this study is purposive sampling. The criteria in sample selection are as follows; 1) Companies in the property and real estate sector listed on the IDX, 2) Companies in the property and real estate sector that submit audited financial statements consistently in 2014-2018, 3) The company's annual report states the number of audit committees. After purposive sampling, 36 companies met the criteria of this study.
The analytical tool used in this study is panel data regression analysis, because this study uses panel data that combines time series and cross sections. Panel data consists of 3 (three) models, namely: 1) Common Effect Model is a very simple approach, because it combines time series data and cross sections with the OLS method; 2) Fixed Effect Model is a model that is done by assuming an intercept difference; 3) Random Effect Model is estimating where variables are connected between time or individuals and in this model random selection is done randomly. At the time of model selection can be done with several tests, namely the Chow Test, Hausman Test, and Lagrange Multiplier Test (Basuki, 2016).
Y = a + b1X1it + b2X2it + b3X3it + b4X4it + e
Information :
a = constant
b = regression coefficient for each independent variable
Y = Dependent variable
X1 = Free variable 1
X2 = Independent variable 2
X3 = Independent variable 3
X4 = Independent variable 4
e = Error
t = time
I = Company
Source: Basuki (2016)
RESULTS AND DISCUSSION
In the property and real estate sector companies there are 53 companies listed on the Indonesia Stock Exchange (IDX). Based on the criteria determined using the purposive sampling method. The samples in study were 36 companies, because 18 companies did not meet the criteria and the data from the company's financial statements were incomplete. This research was conducted for 5 years so that the amount of data used as this study is 180 data. Research data processing was conducted electronically using Microsoft Excel 2010 software and eviews 10.0.
Table 1. Descriptive Statistics Test Results
Ukuran_ Jumlah_ Ukuran_KA Audit_Dela
Profitabilitas Perusahaan Komite_Audit P y
|
Mean |
4.983333 |
11.58333 |
2.994444 |
0.833333 |
79.72222 |
|
Median |
4.000000 |
12.00000 |
3.000000 |
1.000000 |
82.00000 |
|
Maximum |
26.00000 |
14.00000 |
5.000000 |
11.00000 |
101.0000 |
|
Minimum |
-6.000000 |
7.000000 |
2.000000 |
0.000000 |
48.00000 |
|
Std. Dev. |
5.289892 |
1.619970 |
0.342472 |
0.868441 |
10.20519 |
|
Skewness |
0.849312 |
-1.039438 |
0.746154 |
8.795682 |
-0.988425 |
|
Kurtosis |
4.296862 |
3.641029 |
13.52348 |
105.7078 |
3.729773 |
|
Jarque- | |||||
|
Bera |
34.25379 |
35.49479 |
847.2797 |
81437.64 |
33.30377 |
|
Probability 0.000000 |
0.000000 |
0.000000 |
0.000000 |
0.000000 | |
|
Sum |
897.0000 |
2085.000 |
539.0000 |
150.0000 |
14350.00 |
|
Sum Sq. Dev. |
5008.950 |
469.7500 |
20.99444 |
135.0000 |
18642.11 |
|
Observatio | |||||
|
ns |
180 |
180 |
180 |
180 |
180 |
Source: Data processed with Eviews 10.0
Graph 1. Normality Test Results
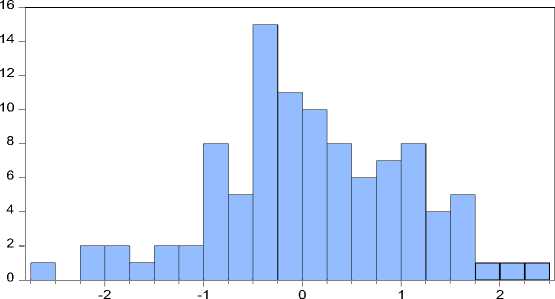
Mean Median Maximum Minimum Std. Dev. Skewness Kurtosis
Jarque-Bera Probability
Source: Data processed with Eviews 10.0
Series: Standardized Residuals
Sample 2009 2018
Observations 100
0.096629
0.013076
2.322358
-2.502696
0.965623
-0.152632
2.882619
0.445684
0.800241
Table 2. Multicollinearity Test Results
|
PROFITABILITUKURAN_PE JUMLAH_KO |
UKURAN_KA | ||
|
AS |
RUSAHAAN |
MITE_AUDIT |
P |
|
PROFITABILI | |||
|
TAS 1.000000 |
-0.250500 |
0.095544 |
-0.102758 |
|
UKURAN_PE | |||
|
RUSAHAAN -0.250500 |
1.000000 |
-0.165310 |
0.097289 |
|
JUMLAH_KO | |||
|
MITE_AUDIT 0.095544 |
-0.165310 |
1.000000 |
-0.021914 |
|
UKURAN_KA | |||
|
P -0.102758 |
0.097289 |
-0.021914 |
1.000000 |
|
Source: Data processed with Eviews 10.0 | |||
Table 3. Autocorrelation Test Results
|
R-square |
0.451222 |
Mean dependentvar |
79.72222 |
|
Ajusted R-squared |
0.298348 |
S.D. dependent var |
10.20519 |
|
S.E of regression |
8.548.341 |
Akaike info criterion |
7.322482 |
|
Sum squared resid |
10230.38 |
Schwarz criterion |
8.032028 |
|
Log likehood |
-6.190.233 |
Hannan-Quinn criter |
7.610172 |
|
F-statistic |
2.951.597 |
Durbin-Watson stat |
2.183205 |
|
Prob.(F-statistic) |
0.000002 |
Source: Data processed with Eviews 10.0
|
Variable |
Coefficient |
Std. Error |
t-Statistic |
Prob. |
|
C |
-0.458694 |
6.174121 |
-0.074293 |
0.9409 |
|
PROFITABILITAS |
0.067226 |
0.092645 |
0.725627 |
0.4693 |
|
UKURAN_PERUSAHA | ||||
|
AN |
-0.184315 |
0.378913 |
-0.486429 |
0.6274 |
|
JUMLAH_KOMITE_AU | ||||
|
DIT |
2.603452 |
1.457279 |
1.786517 |
0.0762 |
|
UKURAN_KAP |
-0.031244 |
0.449114 |
-0.069568 |
0.9446 |
|
Source: Data processed with Eviews 10.0 | ||||
|
Effects Test |
Statistic d.f. |
Prob. | |
|
Cross-section F |
1.993581 (35,140) |
0.0026 | |
|
Cross-section Chi-square |
72.791056 35 |
0.0002 | |
|
Source: Data processed with Eviews 10.0 | |||
|
Chi-Sq. | |||
|
Test Summary |
Statistic Chi-Sq. d.f. Prob. | ||
|
Cross-section random |
9.574301 4 |
0.0482 | |
|
Source: Data processed with Eviews 10.0 | |||
|
Null (no rand. effect) |
Cross-section |
Period |
Both |
|
Alternative |
One-sided |
One-sided | |
|
Breusch-Pagan |
4.808981 |
0.616325 |
5.425307 |
|
(0.0283) |
(0.4324) |
(0.0198) | |
|
Honda |
2.192939 |
-0.785064 |
0.995518 |
|
(0.0142) |
(0.7838) |
(0.1597) | |
|
King-Wu |
2.192939 |
-0.785064 |
-0.041413 |
|
(0.0142) |
(0.7838) |
(0.5165) | |
|
SLM |
2.601972 |
-0.527070 |
-- |
|
(0.0046) |
(0.7009) |
-- | |
|
GHM |
-- |
-- |
4.808981 |
|
-- |
-- |
(0.0367) | |
|
Source: Data processed with Eviews 10.0 | |||
Table 8. Determination Coefficient Test Results
R-squared Adjusted R-squared
0,45122 0,298348
Source: Data processed with Eviews 10.0
Table 9. Fixed Effect Model Results
|
Variable |
Coefficient |
Std. Error |
t-Statistic |
Prob. |
|
C |
117.2359 |
13.14038 |
8.921804 |
0.0000 |
|
PROFITABILITAS |
-0.849520 |
0.197177 |
-4.308410 |
0.0000 |
|
UKURAN_PERUSAHA | ||||
|
AN |
-3.711541 |
0.806441 |
-4.602370 |
0.0000 |
|
JUMLAH_KOMITE_AU | ||||
|
DIT |
3.261007 |
3.101525 |
1.051421 |
0.2949 |
|
UKURAN_KAP |
-0.063714 |
0.955848 |
-0.066657 |
0.9469 |
Effects Specification
Cross-section fixed (dummy variables)
|
R-squared |
0.451222 |
Mean dependent var |
79.72222 |
|
Adjusted R-squared |
0.298348 |
S.D. dependent var |
10.20519 |
|
S.E. of regression |
8.548341 |
Akaike info criterion |
7.322482 |
|
Sum squared resid |
10230.38 |
Schwarz criterion |
8.032028 |
|
Log likelihood |
-619.0233 |
Hannan-Quinn criter. |
7.610172 |
|
F-statistic |
2.951597 |
Durbin-Watson stat |
2.183205 |
|
Prob(F-statistic) |
0.000002 |
Source: Data processed with Eviews 10.0
Descriptive statistical results presented from table 1 for the variable profitability in 5 (five) years the lowest at -6, the highest reached 26. This shows that in 2014-2018 the average profitability of companies in the property and real estate sector was 4.98, so can interpret that companies in this sector in achieving profitability ratios are still quite low. For the next variable that is the size of the company in 2014 - 2018 the lowest number is 7, while the highest value reaches 14. From these results it can be seen that the average size of the company in 5 (five) years is 11.58 which is seen from total assets, so it can be concluded that the company's total assets for this sector are stable. Then for the variable number of audit committees can be seen from the table above the lowest value of 2, while the highest value is 5. These results can be concluded that the average number of audit committees in the last 5 (five) years is stable, reaching 2.99 which means that the number of audit committees in each company consists of 3 members. The next variable is the KAP size, which has the lowest value 0, while the highest value is 11, so it can be seen that the average KAP size is 0.83, which means that the KAP size in this case is affiliated with The Big Four. For the lowest audit delay variable at a value of 48, then the highest value reaches a value of 101. Based on these results it can be seen that the average audit delay in 5 (five) years at
companies in this sector is 79, which means that most of these sectors do not experiencing audit delay.
Based on the normality test results shown in graph 1, a significance value of 0.800241 was obtained. Which means that if the significance value is more than 0.05, it can be concluded that the research data is normally distributed.
Based on the results of the multicollinearity test shown in table 2, the values of all variables are smaller than 0.8. So, it can be concluded that the data in this study passed the multicollinearity test.
From the results of the autocorrelation test (table 3) the results of the formed regression model can be seen that the DW value of the formed regression equation is 2.183205 while the Durbin-Watson table value with n = 180 and k = 4, the value of dU = 1.8017 is obtained , so the value of 4 - dU = 4-1.8017 = 2.1983, so it can be concluded 1.8017 <2.1832 <2.1983, the DW value of the regression model formed in this study does not have autocorrelation.
The results of the heteroscedasticity test (table 4) above can be concluded that H0 is accepted because the probability of each independent variable is greater than alpha (0.4693; 0.6274; 0.0762> 0.05), or in other words the regression coefficient value of independent variable.
Profitability, Company Size, Number of Audit Committees and KAP size are not significant on the ABS dependent variable (RESID), so the data in this regression model can be said to be no heteroscedasticity problem.
Based on the Chow test shown in table 5, it can be concluded that H0 was rejected because of the Prob results. Transverse section F is smaller than alpha (0.0026 <0.05), so the model used in this study is the Fixed Effect Model.
Based on the Hausman Test (table 6) it can be concluded that H0 is rejected because the random Cross-section Prob results are smaller than alpha (0.0482 <0.05), so the model used in this study is the Fixed Effect Model.
Based on the Langrange Multiplier (LM) test results shown in table 7 it can be concluded that H0 is rejected because the random Prob Cross-section results are smaller than alpha (0.0283 <0.05), so the model used in this study is the Random Effect Model.
From testing the panel data regression model on the three models, it aims to strengthen the conclusions of the test, so it can be concluded that this study uses the Fix Effect model which will be further analyzed in this study.
From table 8 above shows that the test results of the coefficient of determination or Adjusted R Square obtained is 0.298348 which means that
29.8348% of the dependent variable is audit delay (Y), variations can be explained by the variable Profitability (X1), Company Size (X2), Number of Audit Committees (X3) and KAP size (X4) and the rest are explained by variables outside the variables used.
Based on the panel regression test data shown in table 9, profitability in audit delay found a value of t -4, 308410 and a significance value of 0, 0000 less than 0.005 this means that the profitability variable has a significant effect. The regression coefficient value of the profitability variable is -0.84952020 which contains a negative meaning, namely the higher the profitability, the lower the audit delay. So it can be concluded that the hypothesis "Profitability affect negatively on audit delay" is supported by data from this study. This study is in line with research conducted by Prameswari (2015) and Tama (2015) which shows that profitability has a significant influence on audit delay. That is because when companies with high profitability will immediately announce the good news to the public so that investors feel attracted to invest in companies and vice versa when companies with low profitability, the auditor will be careful in the audit process, so that it will slow down the audit process and cause audit delay.
Furthermore, based on the panel data regression test of company size on audit delay, it was found that the t value
was -4, 602370 and the significance value of 0.0000 was smaller than 0.005, this meant that the firm size variable had a significant effect. Regression coefficient of variable Company size of -3,711541 which has a negative meaning which means, if the size of the company is getting bigger, then the audit delay will be smaller.So it can be concluded that the hypothesis "Company size affect negatively on audit delay" is supported by this research data.
This research is supported by the results of the study Juniati et al. (2016) and Apriyana, (2017) which states that company size has a significant influence on audit delay. That is because large companies will tend to complete financial statements more quickly and in large companies must have good internal control, making it easier for auditors to audit financial statements, so that the audit process will be faster and audit delay will be lower.
Then it can be seen from the results of panel data regression testing the number of audit committees on audit delay found the t value of 1, 051421 and a significance value of 0, 2949 greater than 0.005 this means that the variable number of audit committees has no significant effect on audit delay. The regression coefficient value of the variable number of audit committees is 3,26,1007 which contains a positive meaning that the more the number of audit committees, the higher the audit delay. So it can be
concluded from the analysis that the hypothesis "The number of audit committees affect negatively on audit delay" is not supported by the data in this study.
This study is in line with research conducted by Indriani (2016) and Purbasari & Rahardja (2014) which states that the number of audit committees has no influence on audit delay. This is because the length of the audit process is not based on the number of audit committees but is based on the competence and experience of the committee and the auditor.
From panel data regression testing on the size of KAP on audit delay, it was found that the t value was -0.66657 and a significance value of 0, 9469 is greater than 0.005, this implies that the variable size of KAP is not significant effect on audit delay. Regression coefficient of variable size of KAP that is equal to -0, 063714 which contains a negative meaning which means the greater the size of KAP, the audit delay is lower so that from this study it can be seen that the hypothesis “Size of KAP affect negatively on audit delay "is not supported from this research data.
This study is in line with research conducted by Saemargani (2015) and Apriyana (2017) which states that the size of KAP has no influence on audit delay. This is because when a company wants to improve the quality of financial
statements, it is required to use the services of a reputable KAP. In this case it can be shown that KAP is affiliated with The Big Four. It is assumed that KAP affiliated with The Big Four has a lot of experienced employees, so that when conducting audits more effectively and efficiently and audit delay will be lower.
Simultaneously shows the significance value is 0.000002 which is less than α = 0.05 or F-count value (2.9516)> F-table (2.42), therefore the decision is Reject H0. So it can be concluded that there is an influence between Profitability (X1), Company Size (X2), Number of Audit Committees (X3) and Size of KAP (X4) on Audit Delay (Y).
CONCLUSION
From the test results and discussion in the previous section, it can be concluded that profitability has a negative effect on audit delay in property and real estate sector companies in 2014 -
2018. For company size variables have a negative effect on audit delay in property and real estate companies in 2014 - 2018. Then the variable number of audit committees has no effect on audit delay in property and real estate companies in 2014 - 2018. As for the last variable, the size of KAP has no influence on audit delay in property and real estate companies in 2014 - 2018. Simultaneously profitability variables, company size, number of audit commitments, and the size of KAP have an influence on audit delay.
For further research, it is expected to be able to multiply the research sample and increase the research period and not only focus on 1 (one) sector but can compare several sectors in the Indonesia Stock Exchange (IDX). And further research can add independent variables such as external auditor competence, solvency, contingency, audit fees, audit reputation, because the more independent variables will clarify or strengthen research
REFERENCE
Amani, F. A., & Waluyo, I. (2016).
Pengaruh Ukuran Perusahaan, Profitabilitas, Opini Audit, Dan Umur Perusahaan Terhadap Audit Delay (Studi Empiris Pada Perusahaan Property Dan Real Estate
Yang Terdaftar Di Bursa Efek Indonesia Pada Tahun 2012-2014). Nominal, Barometer Riset Akuntansi Dan Manajemen, 5(1). Https://Doi.Org/10.21831/Nominal. V5i1.11482
Apriyana, D. (2017). Pengaruh Ukuran Perushaan, Solvabilitas, Profitabilitas Dan Komite Audit Terhadap Audit Delay (Pada Perusahaan Properti Dan Real Estate Yang Terdaftar Di Bursa Efek Indonesia Pada Tahun 2012-2015). Competitive Jurnal
Akuntansi Dan Keuangan, 1(2).
Https://Doi.Org/10.31000/Competit ive.V1i2.216
Basuki, N. (2016). Analisis Regresi Dalam Penelitian Ekonomi & Bisnis. In Pt. Rajagrafindo Persada.
Bawafi, M. H., & Prasetyo, A. (2015).
Terhadap Nilai Perusahaan Dengan Profitabilitas Sebagai Variabel Pemoderasi. Jurnal Reviu Akuntansi Dan Keuangan, 5(1), 721–730.
Candradewi. (2019). Good Corporate Governance Mechanism. Jurnal Ekonomi Kuantitatif Terapan, 12, 175– 185.
Dani. (2018). 40 Emiten “Malas” Serahkan Laporan Keuangan Semester I-2018, Ini Daftarnya. Retrieved From Rabu, 12 September 2018 Website: Https://Economy.Okezone.Com/Re ad/2018/09/12/278/1949219/40-Emiten-Malas-Serahkan-Laporan-Keuangan-Semester-I-2018-Ini-Daftarnya%0a%0a
Felicia, W., & Pesudo, D. A. A. (2019). Mengapa Perusahaan Terlambat Menerbitkan Laporan Keuangan?
Perspektif Akuntansi, 2(1), 71–88.
Https://Doi.Org/10.24246/Persi.V2i 1.P71-88
Indriani, T. (2016). Analisis Faktor-Faktor Yang Mempengaruhi Audit Delay (Studi Kasus Perusahaan Lq45 Yang Terdaftar Di Bei Tahun 2014. Profit A, 9, 337.
Juniati, E., Ms, A. H., & A, A. A. (2016).
Analisis Faktor Yang Mempengaruhi Keterlambatan Penyampaian
Laporan Keuangan Pada Perusahaan Pertambangan Yang Terdaftar Di Bei Tahun 2011-2013. Jom Fekon, Vol 3(No 1), 2414–2428.
Kartika, A. (2011). Faktor-Faktor Yang Mempengaruhi Audit Delay Pada Perusahaan Manufaktur Yang
Terdaftar Di Bei. Accounting Analysis Journal, 3(2), 152–171.
Https://Doi.Org/10.1017/Cbo97811 07415324.004
Kasmir. (2015a). Analisis Laporan Keuangan. In Pt. Rajagrafindo Persada (P. 197).
Kasmir. (2015b). Analisis Laporan Keuangan. In Pt. Rajagrafindo Persada (P. 23).
Kontan.Co.Id. (2019). Analis Menilai
Kenaikan Saham Properti Di Awal 2019 Disebabkan Sudah
Undervalued. Retrieved From Kamis, 13 Juni 2019 Website:
Https://Investasi.Kontan.Co.Id/Ne ws/Analis-Menilai-Kenaikan-Saham-Properti-Di-Awal-2019-Disebabkan-
Sudah-Undervalued
Maryani, S., Respati, N. W., & Safrida, L. (2017). Pengaruh Financial Distress, Pertumbuhan Perusahaan,
Rentabilitas, Ukuran Kap, Dan Ukuran Perusahaan Terhadap Pergantian Auditor. Jurnal Reviu Akuntansi Dan Keuangan, 6(2), 873– 884.
Https://Doi.Org/10.22219/Jrak.V6i2 .04
Pattiasina, V. (2017). Analisis Pengaruh Kualitas Auditor, Ukuran
Perusahaan, Jumlah Komite Audit, Kompleksitas Operasi Perusahaan Terhadap Audit Delay Dan Opini Audit Yang Diinterveing Oleh Audit Lag. Future Jurnal Manajemen Dan Akuntansi, 5(September), 85–98.
Retrieved From
Www.Jurnal.Uniyap.Ac.Id/Index.Ph p.Future
Pojk No 11/Pojk.03. (2016). Otoritas Jasa Keuangan Republik Indonesia. Peraturan Otoritas Jasa Keuangan, (Kewajiban Penyediaan Modal Minimum Bank Umum), 1–38.
Prameswari, R. (2015). Analisis Diskriminan Untuk Memprediksi Kebangkrutan Perusahaan ( Studi
Pada Perusahaan Manufaktur Yang Terdaftar Di Bursa Efek Indonesia Tahun 2011-2013 ). Jurnal Administrasi Bisnis, 27(2), 1–8.
Pt Bursa Efek Jakarta. (2004). Peraturan Kep-306/Bej/07-2004 Nomor I-E Tentang Kewajiban Penyampaian Informasi. 1–15.
Purbasari, M., & Rahardja. (2014). Analisis Pengaruh Karakteristik Komite Audit Dan Profitabilitas Terhadap
Timeliness Laporan Keuangan (Studi Empiris Pada Perusahaan
Manufaktur Yang Terdaftar Di Bei). Diponegoro Journal Of Accounting, 3(3), 1–12.
Saemargani, R. I. (2015). Pengaruh Ukuran Perusahaan, Profitabilitas, Solvabilitas Dan Opini Auditor Terhadap Audit Delay. Jurnal Analisa Akuntansi Dan Perpajakan, Vol. 4(No. 2).
Https://Doi.Org/10.25139/Jaap.V2i2 .1397
Tama, A. I. (2015). Hubungan Profitabilitas Dengan Audit Delay Pada Perusahaan Manufaktur Sektor Aneka Industri Yang Terdaftar Di Bursa. 6(1), 73–85.
Yuanita, K. (2012). Berkala Ilmiah Mahasiswa Akuntansi. 1(3), 5.
258
Discussion and feedback