Brand Attributes and Service Quality in Networked Hotels and Their Influences on Tourist Loyalty
on
pISSN : 2301 – 8968
JEKT ♦ 13 [1] : 325-339
eISSN : 2303 – 0186
Atribut Brand dan Kualitas Layanan dari Hotel Berjejaring serta Pengaruhnya pada Loyalitas Wisatawan
ABSTRAK
Sejumlah praktik pemasaran meyakini terdapat sejumlah anteseden loyalitas pelanggan, diantaranya atribut brand, kualitas layanan dan/atau produk, serta kepuasan pelanggan. Tulisan ini ditujukan mengkaji kausalitas dari atribut brand, kualitas layanan hotel, kepuasan, dan loyalitas wisatawan pada usaha akomodasi. Menggunakan kueisoner teruji, pada Januari-Maret 2022 pasca COVID-19, data dikumpulkan dari 135 wisatawan nusantara yang menginap di tiga hotel anggota Inna Bali Grup. Model persamaan struktural (SEM) dirancang dengan atribut brand dan kualitas layanan hotel diposisikan sebagai laten eksogen, loyalitas sebagai laten endogen, dan kepuasan wisatawan sebagai laten pemediasi. Analisis data menjustifikasi adanya pengaruh positif yang nyata dari kedua laten eksogen pada kepuasan wisatawan yang menginap serta kepuasan memiliki pengaruh yang nyata pada loyalitas wisatawan dengan besar pengaruh melebihi besar pengaruh langsung dari kualitas layanan hotel.
Kata kunci: atribut brand, COVID-91, hotel berjejaring, model kuantitatif, SEM Klasifikasi JEL: C31, M31, M37
Brand Attributes and Service Quality in Networked Hotels and Their Influences on Tourist Loyalty ABSTRACT
According to marketing practices, there are several numbers of antecedents of loyalty, i.e. brand attributes, quality of products and/or services, and customer satisfaction. This research aims to determine the causality between brand attributes, hotel service quality, tourist satisfaction, and loyalty in the accommodation industry. Using questionnaire, research data gathered from January to March 2022, when Bali tourism activities began to rise after the COVID-19 pandemic. By positioning brand attributes and service quality as exogenous variables, their effects on tourist’ loyalty at three hotels belonging to the Inna Bali Group were examined with tourist satisfaction positioned as a mediating variable. Using a variance-based structural equation model, the results of the analysis shows a significant and positive effect of the two exogenous variables on tourists satisfaction. Another finding is the significant influence of tourists satisfaction ons their loyalty, with the magnitude of the effect exceeding influence of the quality of service received.
Kata kunci: atribut brand, COVID-91, hotel berjejaring, model kuantitatif, SEM Klasifikasi JEL: C31, M31, M37
INTRODUCTION
The increasing competition among businesses, the wants and needs of consumers, as well as their buying habits, make brands an important thing. Consumer's perception of the brand becomes one of several important determinants in creating a comparative and competitive advantage for the business in the long term. Thus, creating a strong brand perception in the minds of customers becomes a top priority for the business. In recent years, consumers have started to care more about the brand than the product. Businesses have to keep abreast of technological developments that provide consumers with wide choices of products/services. Consumers will choose the brand that provides the greatest benefit to them to meet their needs (Durmaz et al., 2018).
Foroudi et al. (2018) believe that there are 2 groups of brand attributes, namely (a) symbolic, and (b) functional attributes. In the accommodation
business, functional attributes such as architecture and exterior aesthetics and public spaces, guest room design and facilities, as well as furniture and bathroom facilities have a less dominant influence than symbolic attributes such as brands, logos, names on associations of product quality and/or service providers, or services with the customer's image (Kwun & Oh, 2007).
In the tourism industry, tourist loyalty is major issue in destination management. The more loyal tourists are to the destination, the greater their length of stay, which in turn has an impact on increasing their spending on traveling (Oppermann, 2000). Loyal tourists are one of some important conditions for implementing and realizing quality-based tourism. From the perspective of the tourism industry, the promotion costs incurred by business actors are relatively smaller for repeater guests compared to the costs spent on first-time visitors. Another study also shows that there is a positive linear relationship between the frequency of visits and the emotional
attachment of tourists to the destination (Sun et al., 2013).
Jan and Feng (2007) believe tourists’ satisfaction is a direct antecedent of short-term revisit intentions, but not for medium- or long-term revisit intentions. They also believe that novelty seeking is a significant antecedent of medium-term as well as for long-term revisit intentions. The role of novelty seeking and tourists’ satisfaction with the destination are the two antecedents that they believe are the main blocks of tourist loyalty. Although there has been a large amount of research on the effect of tourist satisfaction on their loyalty to a destination, research specifically aimed at examining the effect of brand attributes on tourist satisfaction on their loyalty is still limited, especially when impact of the COVID-19 pandemic recovery on the performance accounted for the accommodation business.
In the 2018-2021, the contribution of accommodation and food service activities to the formation of the gross regional domestic product (GRDP) of Bali Province (based on 2010 constant
prices) decreased from 23.38 percent (in 2018) to 16.66 percent (in 2021), with a growth rate of this sector decreased drastically, 6.70 percent in 2018 to -27.50 percent in 2020 and -10.20 percent in 2021, respectively. As a province with a high level of dependence on the tourism sector, Bali's economy was badly shaken (BPS Provinsi Bali, 2022).
Observing the vital role of brand attributes and the service quality of the accommodation business in Bali in building tourist satisfaction and their loyalty, especially for rebranding of the networked hotels after the recovery of the coronavirus disease (COVID-19); this research aims to find out:
-
1. The influence of brand attributes and service quality on the level of satisfaction of tourists who stay;
-
2. The influence of brand attributes and service quality on the loyalty of tourists who stay; and
-
3. The influence of the level of tourist satisfaction on loyalty.
METODE PENELITIAN
To answer three previous problems, qualitative and quantitative approaches were carried out simultaneously. According to Creswell (2009), the two approaches synergize where the results of quantitative analysis can be explained and elaborated in greater depth through qualitative examination.
The data was obtained through the distribution of questionnaires to 135 tourists who stayed at 3 hotels in the Inna Group Bali network. These three hotels are Inna Sindhu Beach Hotel, located at Sanur area; Grand Inna Kuta at Kuta area; and Inna Bali Heritage Hotel, located at centre of Denpasar City. For each hotel, questionnaire were randomly distributed to 45 guests regardless of their nationality, Indonesian or foreign citizen. The inclusion criteria for guests to be selected as respondents are guests who have stayed at each hotel at least twice, an indicator that shows someone is loyal to the products and/or services consumed (Parasuraman et al., 1988).
Regarding the sample, the sample size was determined a priori as many as 135
respondents considering that there were 25 items in the four latent variables. Brand attributes are measured through 5 items; hotel service quality was measured using 10 items; tourist satisfaction was measured using 7 items; and tourist loyalty is measured through 3 items. According to Hair et al. (2014), the number of samples required to measure one item of a latent variable is 5-10 respondents. Finally, ten extra respondents were included in the data collection process considering the possibility of respondents' opinions which could not be analyzed due to incomplete responses.
The research questionnaire was divided into 2 groups of information, namely the respondents’ socio-demographic aspects and respondents' perceptions of the four latent variables in the model. These perceptions were measured using a 5-degree Likert scale with a score of 1 indicating the most negative perception and a score of 5 describing the most positive perception. Before the questionnaire was distributed, the validity of the items and the reliability
of the latent variables were checked by looking at the Cronbach's alpha coefficient.
Validity and reliability checks were carried out by distributing instrument in preliminary research activities carried out in December 2021 by distributing questionnaires to 30 tourists staying at Grand Inna Kuta. The Statistical Package for Social Science (SPSS) release 22 is used to analyze the data. After the intrument has been proven qualified to
use in data collecting process, it is used to collect the primary data.
RESULTS AND DISCUSSION
Of the 135 returned questionnaires, 3 questionnaires were excluded because they were filled out incompletely. Table 1 shows the profile descriptions of 132 respondents, differentiated according to the highest level of education completed, occupation, traveling partner, and purpose of traveling to Bali.
Table 1. Profile of Respondents
|
Profile |
Category |
Percentage | ||
|
IBH N=43 |
GIK N=45 |
ISB N=44 | ||
|
High School |
2.3 |
11.1 |
11.4 | |
|
Level of Education |
Diploma |
34.9 |
33.3 |
15.9 |
|
Undergraduates |
53.5 |
44.4 |
65.9 | |
|
Graduates |
9.3 |
11.1 |
6.8 | |
|
Housewife |
4.7 |
4.4 |
9.1 | |
|
Government Employee |
27.9 |
20.0 |
6.8 | |
|
Job |
Private Employee |
16.3 |
26.7 |
31.8 |
|
Business |
27.9 |
31.1 |
31.8 | |
|
Retirement |
18.6 |
15.6 |
15.9 | |
|
Other |
4.7 |
2.2 |
4.5 | |
|
Alone |
20.9 |
13.3 |
18.2 | |
|
Couple |
48.8 |
26.7 |
40.9 | |
|
Travel Partner |
Family |
23.3 |
40.0 |
34.1 |
|
Friends |
4.7 |
17.8 |
4.5 | |
|
Other |
0.0 |
2.2 |
2.3 | |
|
Honeymoon |
2.3 |
2.2 |
6.8 | |
|
Travel Purpose |
Holiday |
32.6 |
22.2 |
18.2 |
|
Business |
44.2 |
53.3 |
56.8 | |
|
Other |
20.9 |
20.0 |
15.9 | |
Note:
IBH : Inna Bali Heritage
GIK : Grand Inna Kuta
ISB : Inna Sindhu Beach
At level of their education completed, respondents who stay at the three hotels have diploma or undergraduate education. In terms of their job, Inna Bali Hotel is chosen by tourists who work as government employees; Grand Inna Kuta is dominated by business owners; and Inna Sindhu Beach are preferred by respondents of business owners or private workers. In the aspect of traveling partners, Inna Bali Heritage and Inna Sindhu Beach are dominated by tourists who travel with their
couples, while Grand Inna Kuta is more demanding by tourists who traveling with their family. In terms of travel destinations, most of the respondents stated that the main purpose of traveling during the pandemic was to do business and/or vacation.
The results of the item validity and reliability tests for the four latent variables in the model using SPSS are shown in Table 2.Table 2. Validity and Reliability Test
|
Code |
Short Description |
ρ |
α∗ | |
|
Brand Attribute α = 0,846 |
AT1 |
Famous |
0,734 |
0,792 |
|
AT2 |
Easy to remember |
0,614 |
0,829 | |
|
AT3 |
Good image |
0,528 |
0,846 | |
|
AT4 |
Good facilities |
0,628 |
0,822 | |
|
AT5 |
Competitive price |
0,801 |
0,781 | |
|
Service Quality α = 0,881 |
KT1 |
Service |
0,526 |
0,876 |
|
KT2 |
Online catalog |
0,411 |
0,891 | |
|
KR1 |
Staff service |
0,701 |
0,862 | |
|
KR2 |
Friendly service |
0,634 |
0,869 | |
|
KR3 |
CHSE protocol |
0,651 |
0,866 | |
|
KE1 |
Communication |
0,651 |
0,866 | |
|
KE2 |
Complaint service |
0,641 |
0,867 | |
|
KRE1 |
Staff easy to contact |
0,724 |
0,860 | |
|
KRE2 |
Information |
0,689 |
0,864 | |
|
KA |
Fast response |
0,608 |
0,869 | |
|
Satisfaction α = 0,875 |
KK1 |
As promise |
0,820 |
0,834 |
|
KK2 |
Catalog easy to use |
0,612 |
0,866 | |
|
KK3 |
Staff service |
0,435 |
0,891 | |
|
KK4 |
Staff hospitality |
0,739 |
0,850 | |
|
KK5 |
Price |
0,722 |
0,850 | |
|
KK6 |
Getting information |
0,719 |
0,850 | |
|
KK7 |
Complaint handling |
0,652 |
0,858 | |
|
Loyalty α = 0,826 |
LL1 |
Will recommend |
0,728 |
0,716 |
|
LL2 |
Will invite |
0,784 |
0,659 | |
|
LL3 |
Does not switch |
0,554 |
0,892 |
Source: primary data (2022)
Table 2 shows that all latent variables have Cronbach's alpha coefficient values exceeding the lower threshold of 0.60 (Hair, Black, et al., 2014) and all items for each latent variable have exceeded the value of 0.30 as stated by Nunnally
(1975) and Field (2009). Observing these statistic, the questionnaire is appropriate to be used as a data collection instrument for the structural equation model as shown in Fig. 1.
Fig. 1 Research Model
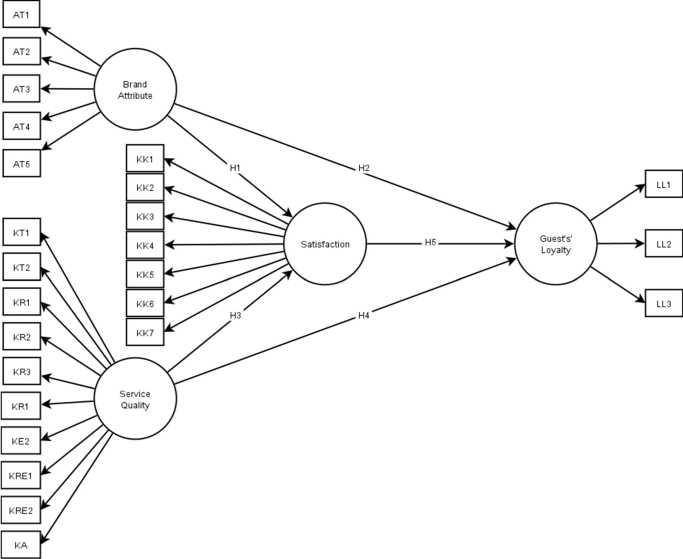
Fig. 1 shows that there are 5 hypotheses that were built to examine the causal relationship formed between latent variables. These hypotheses are:
H1 : brand attributes affect the satisfaction of tourists staying at the three member hotels of the Inna Group Bali;
H2 : brand attributes affect the loyalty of tourists who stay at the three member hotels of the Inna Group Bali;
H3 : the quality of hotel services has an effect on the satisfaction of tourists
staying at the three member hotels of the Inna Group Bali;
H4 : the quality of hotel services affects the loyalty of tourists who stay at the three member hotels of the Inna Group Bali; and
H5 : tourist satisfaction affects the loyalty of tourists staying at Hotel Inna Group Bali.
To test those hypotheses, the structural equation model in Fig. 1 was analyzed using SmartPLS 3.3. from Ringle et al.(2015). SEM examination consists of 2 sub-models, namely (a) measurement
sub-model (outer model), and (b) structural sub-model (inner model); must be done separately (Kencana & Manutami, 2017). Referring to Hair et al. (Hair, Hult, et al., 2014), analysis of the measurement sub-model, the model that shows the causality of the construct with its measuring items, should be carried out before examining the structural sub-model, the model that expresses the causality of exogenous constructs with endogenous constructs in the model. If the analysis on the measurement sub-model has produced
adequate eligibility criteria, then the structural sub-model analysis can be carried out.
The feasibility of measuring each construct is carried out by observing a number of indicators, including the outer loading value for each measuring item > 0.60 (Henseler & Starstedt, 2013); average variance extracted (AVE) value > 0.50; the value of composite reliability (CR) > 0.50 (Hair, Hult, et al., 2014). Table 3 shows the results of the final analysis on the measurement submodel.
Table 3. Measurement Analysis – Final Step
|
Code |
Outer Loading |
p-value | |
|
Brand Attribute AVE = 0.640 CR = 0.842 |
AT1 |
0.817 |
0.000 |
|
AT2 |
0.815 |
0.000 | |
|
AT3 |
0.767 |
0.000 | |
|
Service Quality AVE = 0.573 CR = 0.870 |
KE2 |
0.763 |
0.000 |
|
KR3 |
0.685 |
0.000 | |
|
KRE1 |
0.798 |
0.000 | |
|
KRE2 |
0.807 |
0.000 | |
|
KA |
0.727 |
0.000 | |
|
Satisfaction AVE = 0.534 CR = 0.873 |
KK1 |
0.703 |
0.000 |
|
KK2 |
0.658 |
0.000 | |
|
KK4 |
0.737 |
0.000 | |
|
KK5 |
0.744 |
0.000 | |
|
KK6 |
0.778 |
0.000 | |
|
KK7 |
0.758 |
0.000 | |
|
Loyalty AVE = 0.725 CR = 0.888 |
LL1 |
0.857 |
0.000 |
|
LL2 |
0.877 |
0.000 | |
|
LL3 |
0.820 |
0.000 |
Source: primary data (2022)
After the measurement model gives the values of AVE, CR, and outer loading exceeding the required lower threshold, the structural model or inner model, a model that describes interlatent causality in a structural equation model, deserves to be analyzed. The structural model analysis in this study was carried out using a bootstrap process that was set to run on 5000 subsamples. In this model, the significance of the effect of exogenous latent variables on endogenous latent variables is examined, as the basis for acceptance or rejection of the five hypotheses designed. Table 4 shows the result of inner or structural model analysis.
Table 5. Structural Model Analysis
|
Latent variables |
Path coef. |
p-value |
Note | |
|
Exogen |
Endogen | |||
|
Brand |
Satis- |
0.272 |
0,000 |
H1 |
|
Attribute |
faction |
accepted | ||
|
Brand Attribute |
Loyalty |
0.103 |
0,231 |
H2 rejected |
|
Service |
Satis- |
0.536 |
0,000 |
H1 |
|
Quality |
faction |
accepted | ||
|
Service Quality |
Loyalty |
0.318 |
0,001 |
H1 accepted |
|
Satisfaction |
Loyalty |
0.320 |
0,001 |
H1 accepted |
Source: primary data (2022)
In table 4, of the 5 direct effects that stated into 5 research hypotheses, there is one causal relationship that does not provide a significant path coefficient at the 5 percent test level. The second hypothesis which states that brand attributes affect loyalty is rejected in this study. Apart from H2, four other hypotheses were accepted. The hypothesis that brand attributes affect tourist satisfaction (H1), the hypothesis that service quality affects tourist satisfaction (H3), the hypothesis that service quality affects tourist loyalty (H4), and the hypothesis that tourist satisfaction affects tourist loyalty (H5); accepted.
The direct influence of brand attributes on tourist satisfaction staying at Inna Bali Heritage, Grand Inna Bali Kuta and Inna Sindhu Beach was examined in the first hypothesis with the results showing that brand attributes significantly affect the satisfaction of tourists staying overnight. Two dominant brand attributes (name of a hotel that has been known for a long time/AT1 and easy to remember/AT2)
are key indicators that affect the satisfaction of staying tourists.
Similar research conducted by Dewi et al. (2021) regarding the effect of brand attributes on guest satisfaction staying at Hotel Le Meredien Hotel Bali Jimbaran confirms the results of this study. Dewi et al. (2021) found that the coefficient of direct influence of brand attributes on guest satisfaction was 0.670; greater than the direct effect on this study. This is inseparable from the difference in indicators measuring brand attributes, where the researchers used the physical dimensions of the Le Meridien Hotel attributes as a measuring item for brand attributes.
Related to the second hypothesis (H2), this study found that brand attributes do not have a significant direct influence on the loyalty of tourists staying at Inna Group Bali. Table 5 shows H2 is rejected with a path coefficient of brand attributes of 0.103 (p value = 0.231 > 0.05 ). The insignificant direct influence of brand attributes on tourist loyalty is different from the research findings of Dewi et al. (2021). These researchers
found a significant direct effect of the Le Meridian Hotel brand attribute on the loyalty of staying guests. A more detailed search of the research setting conducted by these researchers shows that there are 2 loyalty reflective items that explicitly involve the word 'brand', namely the item Le Meridien brand enhance stay (Y2.1) and the item Intent to consider brand (Y2.5). In the structural equation model, if there are one or more 'similar' statement items used to measure two different latent variables, it is advisable to check the discriminant validity (DV) value of the latent variable to find out whether the statement items are worthy of measuring the variable. the first latent or measure the second latent variable. The researchers did not include the DV values of the latent variables involved in the model.
Another study which is in line with the findings of this study was conducted by Suwandi et al. (2015) which examines the causality between brand image on satisfaction and customer loyalty of express mail. The researchers found a
significant and positive effect of brand image on customer satisfaction, but there is no real evidence that brand image, although it affects customer satisfaction, affects their loyalty.
A number of studies have shown that service quality has a positive significant impact on satisfaction (Dewi et al., 2021; Kencana et al., 2019; Suwandi et al., 2015). This study shows that there is a direct and positive effect on the quality of services provided by Inna Group Bali for staying tourists. Examination of the path coefficient in Table 4 is 0.536 with p-value = 0.000 causing third hypothesis (H3) to be accepted at the 5 percent test level. This shows that the quality of service has a positive and significant effect on the satisfaction of guests staying at Inna Group Bali. According to Dewi et al. (2021), directly and/or indirectly, quality guest service tends to increase guest satisfaction.
The fourth hypothesis that examines the direct effect of service quality at Hotel Inna Group Bali on guest loyalty shows that H4 is accepted at the 5 percent test level. This justifies that there is a direct
and positive direct effect of service quality on guest loyalty at Inna Group Bali. The path coefficient in this relationship is 0.318, indicating that an increase in the quality of services provided to hotel guests by 1 unit can increase loyalty by 0.318 units.
The finding that service quality has a positive and significant effect on tourist loyalty is not in line with similar research conducted by Dewi et al. (2021). These researchers actually found that there was no significant positive effect on this causality. Although they argued that the quality of hotel services in Bali is unquestionable and tends to be the same between hotels of similar hotel classes so that loyalty is no longer determined by the quality of service received by guests, this argument tends to be inconsistent with the current service marketing theory (Kwun & Oh, 2007; Parasuraman et al., 1988; van Doorn et al., 2010) which states that the better the service quality perceived by the customer, the more loyal the customer tends to be to the service provider.
The last hypothesis that examines the direct effect of tourist satisfaction staying at Inna Group Bali on their loyalty shows that H5 is also accepted at the 5 percent test level. This proves that there is a direct influence (positive and real) from the satisfaction of tourists staying at the Inna Group Bali Hotel on their loyalty. The path coefficient value in this relationship is 0.320 with p value = 0.039, indicating that an increase in guest satisfaction by 1 unit can increase their loyalty by 0.320 units.
CONCLUSION
This research, which is generally intended to determine the role of Brand Attributes and Service Quality on Tourist Satisfaction and Loyalty who stays at the Inna Group Hotel Bali in the new normal era, concludes the following:
-
1. Brand attributes have a significant direct influence on the satisfaction of tourists staying at Inna Group Bali;
-
2. Brand attributes have an insignificant direct influence on the
loyalty of tourists staying at Inna Group Bali;
-
3. The quality of services provided by Inna Group Bali has a direct and significant effect on the satisfaction of tourists who stay;
-
4. The quality of hotel services on the loyalty of tourists who stay has a positive and significant influence; and
-
5. The satisfaction of tourists staying with their loyalty to Inna Group Bali has a positive and significant direct influence.
REFERENCES
BPS Provinsi Bali. (2020). Provinsi Bali Dalam Angka 2020. BPS Provinsi Bali.
Creswell, J. W. (2009). Research Design: Qualitative, Quantitative, and Mixed Methods Approaches (3rd Ed.). SAGE Publications. Inc.
Dewi, L. P. T. A., Wiranata, A. S., & Suryawardani, I. G. A. O. (2021). Service Quality, Brand Attributes, Satisfaction and Loyalty of Guests Staying at Le Meridien Hotel Bali Jimbaran. E-Journal Tourism, 8(1), 97–114.
Durmaz, Y., Cavusoglu, S., & Ozer, O. (2018). The effect of brand image and brand benefit on customer loyalty: The case of
Turkey. International Journal of Academic Research in Business and Social Sciences, 8(5). https://doi.org/10.6007/ijarbss /v8-i5/4140
Field, A. (2009). Discovering Statistics Using SPSS (3rd ed.). SAGE Publications, Inc.
Foroudi, P., Jin, Z., Gupta, S., Foroudi, M. M., & Kitchen, P. J. (2018). Perceptional components of brand equity: Configuring the symmetrical and asymmetrical paths to brand loyalty and brand purchase intention. In Journal of Business Research (Vol. 89).
https://doi.org/10.1016/j.jbusr es.2018.01.031
Goedertier, F., Dawar, N., Geuens, M., & Weijters, B. (2015). Brand typicality and distant novel extension acceptance: How riskreduction counters low category fit. Journal of Business Research, 68(1), 157–165. https://doi.org/ 10.1016/j.jbusres.2014.04.005
Hair, J. F., Black, W. C., Babin, B. J., & Anderson, R. E. (2014). Multivariate Data Analysis (7th ed.). Pearson Education.
Hair, J. F., Hult, G. T. M., Ringle, C. M., & Sarstedt, M. (2014). A Primer on Partial Least Squares Structural Equation Modeling (PLS-SEM). SAGE Publications, Inc.
Jang, S. C., & Feng, R. (2007). Temporal destination revisit intention: The effects of novelty seeking and satisfaction. Tourism Management, 28(2), 580–590.
https://doi.org/10.1016/ j.tourman.2006.04.024
Kencana, E. N., Darmayanti, T., & Jayanegara, K. (2019). Does motivation have meaning for loyalties? Empirical study from cultural destinations in Bali. Journal of Physics: Conference Series, 1321(2). https://doi.org/ 10.1088/1742-6596/1321/2/ 022084
Kencana, E. N., & Manutami, T. (2017). Structural model to evaluate the effect of participation and satisfaction on ecotourism sustainability. Journal of Physics: Conference Series, 893(1). https://doi.org/10. 1088/1742-6596/893/1/012030
Kotler, P., & Keller, K. L. (2016). Marketing Management (15th Ed.). Pearson.
Kwun, D. J. W., & Oh, H. (2007). Consumers’ evaluation of brand portfolios. International Journal of Hospitality Management, 26(1), 81–97.
https://doi.org/10.1016/j.ijhm. 2005.09.003
Nunnally, J. C. (1975). Psychometric Theory. 25 Years Ago and Now. Educational Researcher, 4(10), 7–21.
O’Neill, J. W., & Mattila, A. S. (2010). Hotel brand strategy. Cornell Hospitality Quarterly, 51(1), 27– 34. https://doi.org/
10.1177/1938965509352286
Oppe rmann, M. (2000). Tourism destination loyalty. Journal of Travel Research, 39(AUGUST), 78.
Parasuraman, A., Zeithaml, V. A., & Berry, L. L. (1988). SERVQUAL: A Multiple-Item Scale for Measuring Consumer
Perceptions of Service Quality. Journal of Retailing, 64(1), 12– 40.
Ringle, C. M., Wende, S., & Becker, J.-M. (2015). SmartPLS 3. SmartPLS GmbH.
Sun, X., Geng-Qing Chi, C., & Xu, H. (2013). Developing destination loyalty: The case of hainan island. Annals of Tourism Research, 43(40871060), 547–577. https://doi.org/10.1016/j.annal s.2013.04.006
Suwandi, Sularso, A., & Suroso, I. (2015). Pengaruh Kualitas Layanan, Harga dan Citra Merek Terhadap Kepuasan dan Loyalitas Pelanggan Pos Expres di Kantor Pos Bondowoso dan Situbondo.
339
Discussion and feedback