The Detail Engineering Design (DED) Online Garbage Collection System
on
Journal of Electrical, Electronics and Informatics, Vol.7 No. 1, July 2023
16
Detail Engineering Design (DED) Online Garbage Collection System
Lino Verlin1 and Ni Made Ary Esta Dewi Wirastuti2
-
1,2Department of electrical Engineering, Faculty of Engineering, Udayana University, Bali, Indonesia
Abstract - Garbage is an invaluable or worthless object that is around the community environment. Almost all cities in Indonesia experience problems in waste management. This happens because the Final Disposal Site in a city does not have enough land to accommodate. The lack of landfills has resulted in people throwing garbage into ditches, rivers and the sea. Community participation is another important factor in waste management but also necessary to utilize modern technology. Therefore to overcome to overcome this waste problem by creating an Detail Engineering Design for online Garbage Collection System. This system developed to help the process of sending waste from households to TPS and sending garbage from TPS to TPA. The results of this study are detailed engineering systems for online garbage collection which are expected to help local governments in overcoming problems with garbage. With the example of the implementation of this system for Tabanan district. The estimated funds needed are Rp. 20,607,450,400. These funds are used to build a garbage collection site or landfill and develop the application and the time required for the overall construction is six months.
Index Terms— Detail Engineering Design, Final Disposal Site, Garbage, Landfills
Garbage is an invaluable or worthless object that is around the community environment. In Indonesia we can see garbage everywhere, especially in urban areas and now it has become a big problem. Garbage in Indonesia is a very serious problem and is also a social, economic and cultural problem. And almost all cities in Indonesia experience problems in garbage processing. It happens because a TPA (Final Disposal Site) in a city does not have enough land because of that many people throw garbage into the river.
Not only in rivers, the lack of landfills has resulted in people throwing garbage into ditches, rivers and the sea. So that cleanliness and marine ecosystems will be damaged such as fish and coral reefs due to plastic waste that is thrown away by residents who live around the coast.
Indonesia is included in the top 10 countries with the largest population in the world. This problem does not rule out a number of further problems, including waste production and disposal.
Community participation is another important factor in waste management. In managing urban waste, it is also necessary to utilize modern technology. Therefore to
overcome to overcome this waste problem by creating an Detail Engineering Design (DED) for online Garbage Collection System. With this DED it is hoped that it can help the government in solving the waste problem to help channel household production waste to TPS and from TPS to TPA so it hoped with this system people will no longer litter and environmental pollution can be minimized.
This study refers to references related to existing research. Related research on waste problems and management systems and waste management efforts in Indonesia is as follows.
Several previous studies [1]–[4] have provided information about understanding the dangers of plastic waste in Indonesia. As well as efforts to strengthen the commitment and active role of local governments in implementing waste management by making waste an economic raw material. However, it is known that the quality of post-consumption waste in Indonesia is generally low, this is due to the mixing of one type of waste with another, so that scavengers get it dirty and difficult to process. So it is necessary to increase the quantity and quality of the recycling waste collection system.
Research [5] – [8] shows that community participation is another important factor in waste management. In managing urban solid waste, it is also necessary to utilize
modern technology. In today's increasingly digital era, the use of information technology to facilitate work is something that cannot be avoided. Therefore, we decided to try to make a Detailed Engineering Design of an Online Garbage Collection System in this research.
-
A. Context Diagram
Context Diagram is the highest level in the data flow diagram and contains only one process, showing the system as a whole. The process is numbered zero. All external entities shown in the context diagram are the main data flows to and from the system. The diagram contains no data stores and is deceptively simple to create. Context diagrams begin by depicting terminators, data flows, storage control flows, and a single process representing the entire system. The easiest part is to define the process (which only consists of one loop) and give it a name that represents the system. The name in this case can explain the process or work or in extreme cases it can be the name of the company which in this case represents the whole process organization.
-
B. Data Flow Diagram (DFD)
Data Flow Diagram (DFD) is a diagrams that use notations to describe the flow of system data, the use of which is very helpful to understand the system logically, structured and clear. DFD is a tool in describing or explaining DFD is often referred to as bubble charts, bubble diagrams, process models, workflow diagrams, or function models. There are two objectives in making DFD on the system including providing an indication of how data is transformed as data moves through the system and describing the functions (and sub-functions) that transform the data flow.
-
C. Decomposition Diagram
Decomposition Diagram is an activity to describe the system into its subsystems, processes and component subprocesses. Each level of abstraction displays more or less detail (as desired) about the entire system or a subset of that system. A decomposition diagram is a tool used to describe a system decomposition, also called a hierarchical chart, showing the top-down functional decomposition and system structure. Decomposition diagrams are a planning tool for more detailed process models, namely data flow diagrams.
-
D. Entity Relationship Diagram (ERD)
ERD is one of the models used to design databases with the aim of describing related data in a database. Generally, after the ERD design is completed, the next step is to design the physical database, namely making tables and indexes while still considering performance. Then after the database is complete, proceed with designing applications that involve the database. There are three components that make up the ERD including the following:
-
1) Entities are objects in the real world that can be
distinguished from other objects. Each entity must have 1 unique attribute or what is called the primary key. Within an entity there are several attributes. Attributes are characteristic descriptions of an entity or set of entities.
-
2) Relasi is a relationship between several entities. Within the relationship there is a cardinality that states the number of relationship sets between entities. This cardinality mapping consists of one-to-one which is an entity in A associated with entity B at most 1, one-to-many which is an entity in A associated with entity B more than one, and finally many-to- many which is an entity in A associated with more than one entity B and B associated with more than one A.
-
3) Line, line connecting attributes with entity sets with relationships.
-
A. System Overview
DED Online Garbage Collection System is a system developed to help the process of sending waste from households to TPS and sending garbage from TPS to TPA online with a user mechanism for placing orders then the order will be confirmed by the Driver then the Driver will go to the user's location to pick up the waste and send it to TPS or TPA according to the order address. This system can also be used to manage waste data at TPS and TPA such as data on the amount of waste available and storage capacity.
B. Context Diagrams
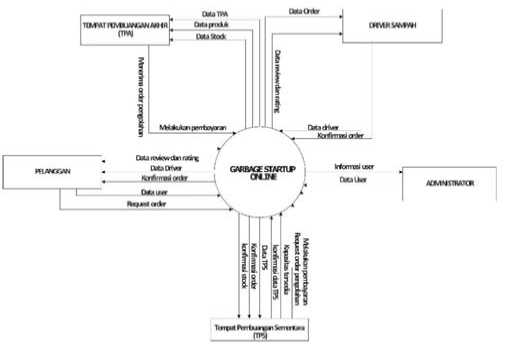
Fig.1. Context Diagrams
There are five external entities involved in the development of this application which consist of Drivers, TPS Officers, TPA Officers, Customers and Administrators. All of these entities are involved in all processes that occur in the system. The process that occurs in the system is to receive input login data in the form of usernames and passwords which are then processed into the desired information.
C. Decomposition Diagram
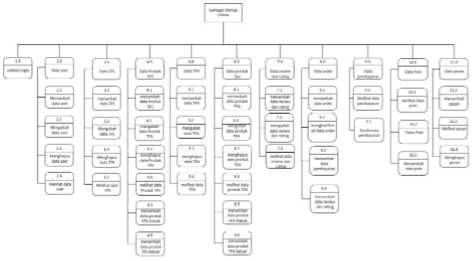
Fig.2. Decomposition Diagram
There are 10 data managed in the Waste Collection System application, these data include user data, TPS data, TPA data, TPS product data, TPA product data, review and rating data, order data, payment data, point data and message data.
D. Data Flow Diagram (DFD)
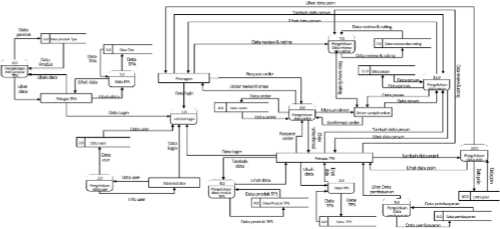
Fig. 3. Data Flow Diagram (DFD) Level 0
The process that occurs in DFD Level 0 includes 11 parts, including:
-
1) Login validation functions to ensure that user login data is correct and accurate.
-
2) User Management is used by administrators to manage users can enter into the Garbage Collection System application.
-
3) TPS data management is used by TPS officers to manage data TPS.
-
4) TPS product data management is used by TPS officers to manage product, stock and goods data at TPS.
-
5) TPA data management is used by TPA officers to manage data landfill.
-
6) TPA product data management is used by TPA Officers to manage product data, stock, goods at TPA.
-
7) Management of review and rating data is used by Customers and Officers TPS to provide feedback to Drivers.
-
8) Order data management is used to manage order request data made by Customers and TPS Officers.
-
9) Payment data management is used to manage payment data after the order has been completed.
-
10) Management of point exchange data used as a means of payment to Customers given by TPS officers.
-
11) Message data management is used to manage Officer message data.
-
12) TPS, Driver or Customer when the order is executed.
-
E. Data Requirements
The record types in the Garbage Collection System data construction are:
-
1) Login Data (contains information about user login data).
-
2) TPS Officer Data (contains information about TPS Officer data).
-
3) TPS Product Data (contains product data on TPS).
-
4) TPA Officer Data (contains information about TPA Officer data).
-
5) TPA Product Data (contains product data information on TPA).
-
6) Customer Data (contains information about Customer data).
-
7) Data Driver (contains information about Driver data).
-
8) Order Data (contains order data information).
-
9) Point data (contains Customer data point information).
-
10) Cost Data (contains information on confirmed order cost data).
-
11) Item List Data (contains information on item list data that can be exchanged for points).
-
12) Message Data (contains message data information).
-
13) Message Group Data (contains message group data information).
Based on these data requirements, the Entity Relationship Diagram (ERD) in this system can be seen in the fig.4.
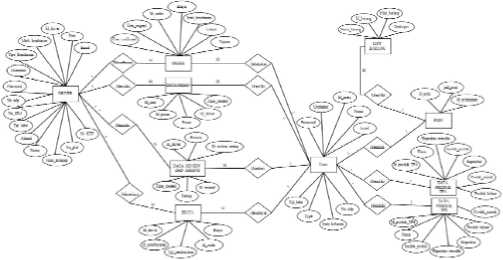
Fig.4. Entity Relationship Diagram (ERD)
-
F. Interface and functional description
-
1) Designing the menu structure
This system requires five menu structures for five users, including the following:
-
a) Admin
The admin has a main menu that can display data for all users, which also has functions for adding new user data and deleting and editing existing user data.
-
b) Drivers
The driver has several menus, one of which is the status which functions to activate or deactivate the driver status, if the driver status is active then the driver can receive orders and vice versa. Besides status, there is also a profile update menu, income and order history.
-
c) Customers
Customers have four menus which include the Order, Review and Rating, Points and Profile Update menus.
-
d) TPS officers
The TPS officer has six menus which include Order, Review and Rating menus, Points, Profile Updates, Customer Orders and Product Data.
-
e) TPA officers
TPA officers only have one main menu, namely Product Data.
b)
2) a)
Software Interface Design
Login Interface
c)

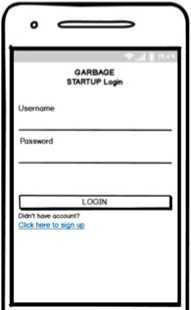
Fig. 5. Login Interface
The login page is used to login to the system. The process is by checking the user table for the input entered, namely the Username and Password. If the input entered is the same as the data in the user table, the process will proceed to the next form depending on the access rights it has. Otherwise an error message will appear. If the user does not have an account, the user can press the sign up link to be redirected to the sign up page, sign up page interface can be seen in fig.5.
d)
Admin Interface
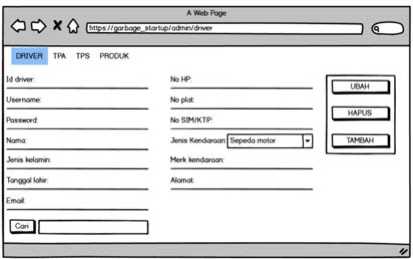
Fig. 7. Admin Interface
This page can only be accessed by administrators which consists of the functions of adding, searching, editing and deleting Driver data, TPA Officers, TPS Officers and product data.
Driver Interface
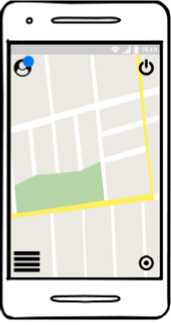
Fig. 8. Driver Interface
Display of several buttons on the main view of the Driver page consisting of buttons for account, power, location and menu. The power button functions to change the driver status to active and inactive.
Customer Interface
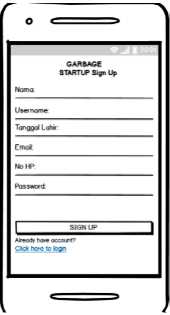
Fig. 6. Sign Up Interface
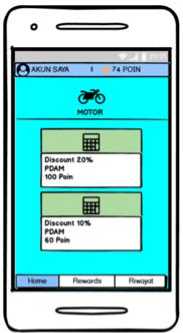
Fig. 9. Customer Interface
The customer's main page consists of accounts, points, home, rewards, history, motorbike orders and displays the latest point exchange offers.
TPS Officer Interface
e)
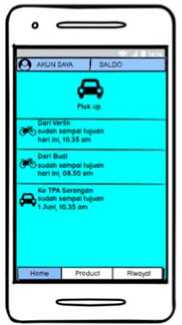
Fig. 10. TPS Officer Interface
The TPS officer main page consists of an order function with pickup and home buttons, products, history, my account, balance and account. This page also displays some of the latest order history data.
f) TPA Officer Interface
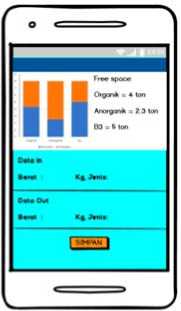
Fig. 11. TPA Officer Interface
On this page the TPA Officer can only add incoming or outgoing data. The data will be stored in a database which can later be used as a source of free space information at a TPA so that if a TPS Officer wants to send waste to a TPA it can be sent to a TPA that still has sufficient free space.
-
G. Cost and HR Requirement Data in Application Implementation
The cost data required for implementing the waste collection system application in Tabanan Regency can be seen in the following table.
TABLE I
Estimated Cost of Implementing the Application in
Tabanan Regency
|
Tempat Pengelolaan Akhir (TPA) | ||||
|
Name |
Amount |
Unit |
Unit price (Rp) |
Amount Total (Rp) |
|
Land |
10.000 |
m2 |
770.000 |
7.700.000.000 |
|
Wheel Loader |
1 |
Unit |
2.810.500.000 |
2.810.500.000 |
|
Excavator |
1 |
Unit |
1.829.000.000 |
1.829.000.000 |
|
Shovel |
5 |
Unit |
80.000 |
400.000 |
|
Weighbridge |
1 |
Unit |
30.000.000 |
30.000.000 |
|
Hangar |
8 x 20 |
m2 |
3.000.000 |
480.000.000 |
|
TPA Officer |
5 |
people |
2.625.216 |
13.126.080 |
|
Office |
4 x 4 |
m2 |
4.000.000 |
64.000.000 |
|
Total (Rp) |
12.927.026.08 0 | |||
|
Tempat Pengelolaan Sementara (TPS) | ||||
|
Name |
Amount |
Unit |
Unit price (Rp) |
Amount Total (Rp) |
|
Land |
500 |
m2 |
770.000 |
385.000.000 |
|
Hangar |
8 x 20 |
m2 |
3.000.000 |
480.000.000 |
|
Office |
4 x 4 |
m2 |
4.000.000 |
64.000.000 |
|
Wheel Loader |
1 |
unit |
587.279.000 |
587.279.000 |
|
Shovel |
5 |
unit |
80.000 |
400.000 |
|
TPS Officer |
3 |
people |
2.625.216 |
7.875.648 |
|
hanging scales |
5 |
unit |
78.000 |
390.000 |
|
Total (Rp) |
1.524.944.648 | |||
|
Total @ 5 (Rp) |
7.624.723.240 | |||
|
Application Development Fee | ||||
|
Name |
Amount |
Unit |
Unit price (Rp) |
Amount Total (Rp) |
|
Software Tester |
1 |
people |
3.500.000 |
3.500.000 |
|
Software Analis |
1 |
people |
7.000.000 |
7.000.000 |
|
Front-end Programmer |
1 |
people |
5.000.000 |
5.000.000 |
|
Bank-end Programmer |
1 |
people |
5.000.000 |
5.000.000 |
|
Domain GarbageStartup |
1 |
year |
125.000 |
125.000 |
|
Cloud Hosting |
12 |
month |
1.200.000 |
14.400.000 |
|
Total (Rp) |
35.025.000 | |||
|
Application Dissemination Fee in 2 weeks | ||||
|
Name |
Amount |
Unit |
Unit price (Rp) |
Amount Total (Rp) |
|
Banner |
5 |
page |
110.000 |
550.000 |
|
Meals |
20 x 14 |
25.000 |
7.000.000 | |
|
Sosialisation |
10 |
people |
1.312.608 |
13.126.080 |
|
Total (Rp) |
20.676.080 | |||
|
Total Requirement (Rp) |
20.607.450.40 0 | |||
Based on the data in table 1, it can be seen that the construction of a TPA in Tabanan Regency can spend Rp. 12,927,026,080. These funds are used to purchase several needs, such as 1 hectare of land at a price of Rp. 770,000/m2 . For the construction of TPS, it was found that data could spend Rp. 1,524,944,648 for the construction of 1 TPS, in Tabanan Regency there are 10 sub-districts with the estimate that 1 TPS can accommodate temporary waste from 2 sub-districts, it is concluded that Tabanan Regency
requires 5 TPS, so a total fund of Rp. 1,524,944,648 * 5 = Rp. 7,624,723,240. Its also need Rp 35,025,000 for application development fee and Rp 20,676,080 for application dissemination fee, so the total funds needed to build online garbage collection system is Rp 20,607,450,400.
Besides that, in building this application, a work plan is also needed. where the work plan for the development of the online garbage collection system application can be seen in the table II. Which can be seen that the construction and development this system is estimated would take 6 months.
TABLE II
Work Plan
|
Ruang Lingkup |
Jenis Kegiatan |
Bulan | |||||
|
1 |
2 |
3 |
4 |
5 |
6 | ||
|
TPA |
Preparation |
✓ | |||||
|
Procurement of Heavy Equipment |
✓ | ||||||
|
Land Formation |
✓ |
✓ | |||||
|
Formation of Landfill Zones/Cells |
✓ |
✓ |
✓ | ||||
|
Development of TPA WWTP |
✓ | ||||||
|
Finishing of Operational Access Road |
✓ | ||||||
|
Construction of Heavy Equipment Workshop |
✓ | ||||||
|
Clean Water Tower Construction |
✓ | ||||||
|
Construction of monitoring wells |
✓ | ||||||
|
Weigh Bridge Construction |
✓ | ||||||
|
Management Office Development |
✓ | ||||||
|
TPA Officer Recruitment |
✓ | ||||||
|
Heavy Equipment Driver Recruitment |
✓ | ||||||
|
TPS |
Preparation |
✓ | |||||
|
Procurement of Heavy Equipment |
✓ | ||||||
|
Land Formation |
✓ | ||||||
|
Finishing of Operational Access Road |
✓ |
✓ | |||||
|
Construction of Heavy Equipment Workshop |
✓ | ||||||
|
Clean Water Tower Construction |
✓ | ||||||
|
Construction of monitoring wells | |||||||
|
Weigh Bridge Construction |
✓ | ||||||
|
Management Office Development |
✓ | ||||||
|
TPA Officer Recruitment |
✓ | ||||||
|
Heavy Equipment Driver Recruitment |
✓ | ||||||
|
Aplica-tion |
Software Analyst Recruitment |
✓ | |||||
|
Recruitment of Front-End Programmers |
✓ | ||||||
|
Recruitment of Back-End Programmers |
✓ | ||||||
|
Software Tester Recruitment |
✓ | ||||||
|
System Planning |
✓ | ||||||
|
System Analysis |
✓ | ||||||
|
System planning |
✓ |
✓ | |||||
|
System Implementation |
✓ |
✓ | |||||
|
System Maintenance |
✓ | ||||||
|
Socialization |
Design, Print And Installation Of Banners |
✓ | |||||
|
Socialization Direct to the Field |
✓ | ||||||
|
Motorcycle Driver Recruitment And Pick Up |
✓ |
The results of this study are detailed engineering systems for online garbage collection which are expected to help local governments in overcoming problems with waste. Take the example of the implementation of this system for Tabanan district. Tabanan regency has 10 sub-districts and with an estimate that every 2 sub-districts need one temporary waste disposal. The estimated funds needed are Rp. 20,607,450,400. These funds are used to build a garbage collection site and develop the application. and the time required for the overall construction is six months.
References
-
[1] Kementerian Lingkungan Hidup. 2008 tentang Pengelolaan Sampah. Jakarta: Biro Hukum dan Humas Kementerian Lingkungan Hidup. Undang-Undang Republik Indonesia Nomor 18 Tahun 2008
-
[2] Baunsele dkk. 2020. Upaya Peningkatan Pemahaman Terhadap Bahaya Sampah Plastik Dan Pengolahannya Bagi Siswa-Siswi SMA Negeri 3 Kota Kupang, Nusa Tenggara Timur. Tersedia pada
http://journal.unika. ac.id/index.php/patria /article/view/2586/pdf.(09 November 2020)
-
[3] Kurnia, Nining. 2019. Sampah Menjadi Masalah Lingkungan di Indonesia. Available: https://www.kompasiana.com/niningkurnia
-
[4] Sahil dkk. 2016. Sistem Pengelolaan dan Upaya Penanggulangan Sampah Di Kelurahan Dufa- Dufa Kota Ternate. Vol 4 No (2).
-
[5] Addahlawi dkk. 2019. Implementasi Prinsip Good Enviromental Governance Dalam Pengelolaan Sampah di Indonesia. JGG-Jurnal Green Growth dan Manajemen Lingkungan, Vol.8 No.2, Desember.
-
[6] Alfath, Muhammad. 2018. Pemanfaatan Teknologi Informasi Dan Pemberdayaan Masyarakat Dalam Meningkatkan Pengelolaan Persampahandi Kota Palangka Raya.
-
[7] Mongkasa, Oswar. 2012. Pedoman Perencanaan TPA. Available: https://www.slideshare.net/OswarMungkasa/pedoman-perencanaan-tpa-metode-sanitary-landfill
-
[8] Techarea. 2017. Tahapan Membuat Website atau Software. Available: https://techarea.co.id/tahapan-membuat-website-atau-software/
-
[9] Magridira, Virsi. 2018. Apa yang Dimaksud dengan Entity Relationship Diagram?. Available: https://www.dictio.id/t/apa-yang-dimaksud-dengan-entity-relationship-diagram/15135
-
[10] Sari, Ade Puspita. 2013. Pengertian Data Flow Diagram (DFD) dan
Contoh Gambar DFD. Available: https://adepuspita28.wordpress.com/2013/10/26/pengertian- data-flow-diagram-dfd-dan-contoh-gambar-dfd/
-
[11] Ansori. 2020. Pengertian Diagram Konteks dan Contohnya. Available: https://www.ansoriweb.com/2020/04/pengertian-diagram-konteks.html
-
[12] Rahmatdi. 2019. Pengertian dan Contoh Dari Context Diagram, Data Flow Diagram, dan Flow Map. Available: https:// www.academia.edu/6078318/P
Discussion and feedback