Labeling Indonesia COVID-19 Data Using K-Means Clustering with Optimization
on
Journal of Electrical, Electronics and Informatics, p-ISSN: 2549–8304 e-ISSN: 2622–0393
22
Labeling Indonesia COVID-19 Data Using K-Means Clustering with Optimization
Duman Care Khrisne 1, I Made Arsa Suyadnya2, AA Ngurah Cakra Khana3
Department of Electrical Engineering, Faculty of Engineering Udayana University, Bukit Jimbaran Bali, Indonesia duman@unud.ac.id
Abstract COVID-19 or Corona Virus Diseases is a virus that spreads throughout the world and causes a pandemic that affects social life, education and tourism, especially in Indonesia. The government has implemented various policies to reduce the rate of cases in Indonesia. In determining policies and regulations, the role of data is very important, especially in Indonesia, but the existence of data is still small and has not been labeled. In this study, the method used to label COVID-19 data in Indonesia is using K-Means Clustering. K-means is a data processing method that produces a group that is divided into 16,936 data. Determination of the number of groups in this study using the Elbow method and optimized by the Davies Bouldin Index method. The result of this study is the number of clusters used as labeling of COVID-19 data in Indonesia. The number of clusters was obtained using the Elbow method and optimized with the Davies Bouldin Index so as to produce a total of 4 clusters and the results of the labeling obtained the number of members in each cluster which amounted to 15315 in cluster 0, 1191 in cluster 1, 222 in cluster 2 and 208 in cluster 3.
Index Term- COVID-19, K-Means, Data, Cluster, Elbow, Davies Bouldin Index.
Currently the world is facing a serious threat in the form of a virus that can kill a person. This virus is often referred to as COVID-19 or in other words Corona Virus Diseases. This virus was first discovered in Wuhan, China at a wet market which is suspected to be the cause of this virus. Problem after problem keeps popping up so that this virus has an impact on human activity patterns. The spread of this virus has an impact on social, economic and human health in the world, especially in Indonesia.
Many efforts have been made by the government to reduce the number of cases of this virus, for example, restrictions on community activities or what is often called PPKM. Policies and regulations have been issued but as a result the virus continues to spread widely among the community. It is at this time that the government's role is very important to secure the community so that the spread of the virus can be reduced. Before making a decision, the role of data is also very important as a reference for decision making.
However, the spread of COVID-19 case data in Indonesia has a very prominent weakness, namely the absence of
labels on the data. labels are very important to perform analysis for data researchers. Labeled data will be easier to reclassify for researchers.
-
A. Machine Learning
According to Samuel (1988) machine learning is how computers can run to solve their own problems without having to be programmed explicitly, machine learning uses a programming language, namely the Python language. According to Mitchell (1997) a computer is said to learn from experience E with respect to some work T and some performance measure P, if its performance on T, as measured by P, increases with experience E.
Machine learning is a method for optimizing the performance of the system by studying sample data or historical data from Alpay (2009). With machine learning, models are created either directly or indirectly, by extracting expert knowledge or from data that does not even exist, by extracting knowledge from experts or from data that is not even known to be related to how to learn it with certain algorithms.
-
B. Data Mining
Data mining is a data processing process with the aim of
finding meaningful new patterns, correlations and trends by sorting out large amounts of data stored in repositories, using pattern recognition technology as well as statistical and mathematical techniques.
According to Suntoro (2019), data mining is a process to obtain useful information from a large database that needs to be extracted so that it becomes new information and can assist in decision making. Data mining is the process of analyzing data from different sources and summing it up into information or knowledge or patterns that are important to increase profits, reduce costs, or even both Witten (2016).
-
C. Clustering
Clustering or clustering according to Tan (2006) is a process to group data into several clusters or groups so that the data in one cluster has the maximum level of similarity and the data between clusters has the minimum similarity. According to Widodo (2013) clustering is a method used to divide a data series into several groups based on previously determined similarities.
Clustering is the process of grouping data into different groups, so that the data in each subset has a useful meaning. The clustering algorithm consists of two parts, namely hierarchical and partial. The hierarchical algorithm is the process of finding clusters sequentially where the clusters are predefined, while the partitional algorithm is the process of determining all the clusters at a given time.
-
D. K-Means Algorithms
According to Priati and Ahmad (2017) the K-Means algorithm is one of the partition algorithms, because K-means basically determines the initial number of groups by identifying the initial centroid value. K-means uses an iterative process to obtain a cluster database, producing a centroid point at the end requiring the number of initial clusters required as input from the end centroid point as output.
-
E. Elbow Method
Elbow method is a method used to determine the number of clusters to be used in k-means clustering. The elbow method aims to produce information in determining the best number of clusters by looking at the percentage of comparison results between the numbers of clusters that form an elbow at a point. To find out the percentage comparison of the results between the numbers of clusters is to calculate the SSE (Sum of Square Error) of each cluster value. The larger the number of clusters, the smaller the SSE value will be.
K
ssr = ^∑^ V - C, ■ (1)
Jt=IX1 eSκ
Where:
K = number of cluster
Xi = data i
Ck = Centroid of cluster
Sum of Square Error (SSE) is a formula to measure the percentage difference between the data obtained and the estimated model that has been done previously.
-
F. Davies Bouldin Index
The Davies Bouldin index method is a cluster evaluation method. This method has an internal cluster evaluation scheme, where the results of the cluster are good or not, seen from the proximity and quantity of the data from the cluster results. This method is a method used to measure cluster validity in a grouping method. The sum of the proximity of the data to the cluster center point is referred to as cohesion. The measurement method using the Davies Bouldin Index maximizes the inter-cluster distance between C_i and C_j clusters and minimizes the distance between points in a cluster at the same time.
-
III. METHODOLOGY
Research on labeling COVID-19 data in Indonesia using the K-means clustering method with optimization of the elbow and davies bouldin index was carried out in the Lab. Electrical Engineering Computer. Implementation starts from September 2021 to January 2022. The stages of the research can be seen in Figure 1.
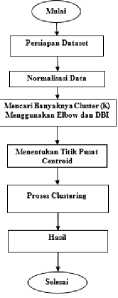
Fig. 1. Research Flow Diagram
The explanation of the flow chart in Fig 4 is as follows.
-
1. The research starts from the preparation of the
dataset, in this step a search for COVID-19
datasets in Indonesia is carried out which is
obtained on the data provider site.
-
2. In this step, the data that has been obtained is
normalized because the value in the data is too high, it must be normalized without having to reduce the value of the data.
-
3. Looking for the value of K on the Elbow method can be seen from the visual output generated from the Elbow method which forms an angled pattern. The angle at the output of this method is made the best K. And after K from Elbow is obtained, it is necessary to optimize it with Davies Bouldin Index (DBI). The best K results from DBI can be seen from the output value generated. If the DBI output is close to 0, then this value is good to be used as a K point.
-
4. In this step, the centroid point is obtained randomly, but the centroid point is very important in the clustering process
-
5. In step 5, the process of clustering can only be carried out if the Elbow and DBI methods have produced a K value.
-
6. In this final step, the result of the above test is the number of K that has been carried out using the Elbow and DBI methods. Each cluster will have its own number of members.
-
IV. RESULTS AND DISCUSSION
-
A. Data Cleaning
Data cleaning is the process of identifying errors in the dataset and taking further action to correct the data or delete data that is not appropriate. In this study, initially the amount of data from the dataset amounted to 20,816 data. After the data cleaning process is carried out, the resulting data is 16,936 data
-
B. Elbow Method Optimization
The results of the Elbow method can be seen from the visual output produced to form a pattern that resembles an elbow and at that angle it can be used as the best K value. The result of Elbow method can be seen in figure 2.
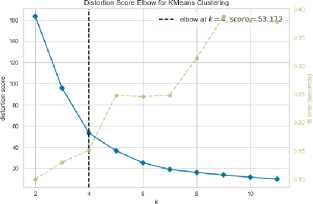
Fig.2. Result of Elbow Method
Figure 2 is the result of the application of the Elbow method. It can be seen that the output produces an angle that forms an angled pattern and produces a K value of 4 with a score of 53,172
-
C. Davies Bouldin Index Optimization
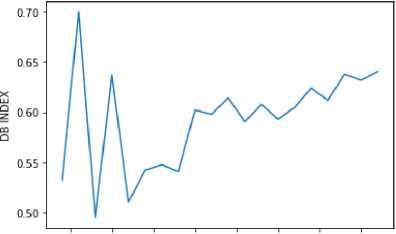
The davies bouldin index method is a cluster evaluation method. This method is a method used to measure the size of the cluster in a clustering method. This method is done by using data amounting to 16,936 data. Figure 3 is the result of the Davies Bouldin index.
ZS 5.0 7.5 10.0 12.5 15.0 17.5 20.0
Number of cluster
Fig. 3. Result Davies Bouldin Index
In the above method to find the best K value, the resulting value is close to 0 and in this method the best K results are obtained in cluster 4 with a score of 0.49.
-
D. K-Means Clustering
K-means clustering is the process of grouping data into several clusters and the data in a cluster has a similarity.
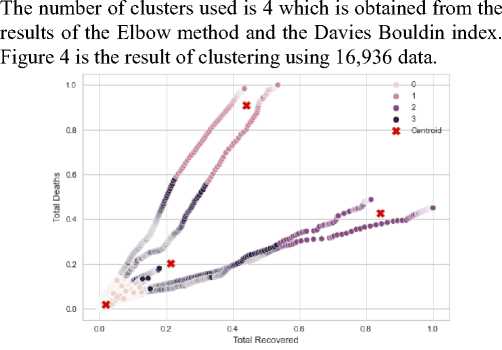
Fig 4. Relust of Clustering
Seen from Figure 4, each cluster has its own number of members. In the above clustering, it is found that in cluster 0 the number of members is 15,315 data. In cluster 1, the number of members is 208 data. In cluster 2, the number of members is 222 data. And in cluster 3, the number of members is 1191 data.
-
E. Result of Labeling COVID-19 Data in Indonesia
In this study, the label generated for the COVID-19 dataset in Indonesia is called a cluster. Figure 5 is the result of data labeling with the name cluster 0, 1, 2, and 3. In cluster 0 there is a total of 15315 data. In cluster 1 there is a total of 222 data. Cluster 2 have a total of 208 data. And in Cluster 3there is a total of 208 data.
-
F. Intra Cluster Distance
Intra-cluster distance is the distance between each data point and the cluster center point. Intra-cluster distance is calculated using the Euclidean Distance equation. Equations like the following
+ (2)
In this study, the intra-cluster distance is calculated the distance of each data to the cluster center point and looks for the average value in each cluster. Table 1 shows the average value of the intra-cluster distance for each cluster.
TABLE 1 AVERAGE DISTANCE TO CENTER POINT
|
Cluster |
Avg. Distance to Center point |
|
0 |
0.987 |
|
1 |
0.986 |
|
2 |
0.603 |
|
3 |
0.134 |
In clustering each cluster has extreme data. Extreme data is data that has unique characteristics in each cluster where the data deviates far from other data in each cluster. Extreme
data can be used as a barrier between the distance between
the data and the cluster.
The extreme data obtained can be reprocessed to find the value of the silhouette coefficient. Silhouette coefficient is a
combination of cohesion and separation testing methods. The cohesion method is a method that aims to measure the
proximity between data in a cluster. And the separation method is a method that functions to measure the distance
between data and data in other clusters.
Here are the results of the silhouette coefficient calculation. Calculations are processed using the resulting values of cohesion and separation.
{bi - ai)
Si = —:---—
max(αt-, bi)
(3)
Table 2 is the result of the calculation of the silhouette
coefficient for each cluster.
TABLE 2. RESULT SILHOUETTE COEFFICIENT
|
Silhouette Coeffcient |
Result |
|
S1 (bθ,l) |
0.767 |
|
S1 (bθ.2) |
0.745 |
|
S1 (bθ.3) |
0.511 |
|
S1 (bl,2) |
0.59 |
|
S1 (bl,3) |
0.833 |
|
Si (⅛2,3) |
0.8 |
-
G. Inter Cluster Distance
Inter-cluster distance is the distance between cluster points and other cluster points. In this study, the intercluster distance was calculated using the Pythagorean equation as follows.
: = ∙. .-.- - ': - (4)
The results of the inter-cluster distance can be seen in table 3
TABLE 3 RESULT INTER CLUSTER DISTANCE
|
Cluster Start |
Cluster Finish |
Distance |
|
0 |
1 |
0.986 |
|
0 |
2 |
0.9207 |
|
0 |
3 |
0.27 |
|
1 |
2 |
0.6410 |
|
1 |
3 |
0.7404 |
|
2 |
3 |
0.667 |
-
V. CONCLUSION
Conclusions are obtained based on the results of the analysis, as follows:
-
1. The application of a machine learning model for labeling COVID-19 data in Indonesia has been carried out using the Elbow and Davies Bouldin Index methods. The machine learning model was created using the Python programming language and using tools such as Jupyter notebook. The study begins with preparing the dataset and the dataset is reprocessed to find biased data or data that is not good. After the data is processed further normalize the data because the value in the data tends to be high, it needs to be normalized without having to reduce the value
in the data. The normalized data then looks for the best K value using the Elbow method and the Davies Bouldin Index. After the K value is obtained, the labeling clustering process can be carried out, each cluster will be calculated intra and inter-cluster distances which aim to find out how far the distance between the data and the cluster is and how far the cluster is from other clusters. In the data, each cluster has an extreme value, the extreme is the value that deviates much from the other data, and then the extreme value is searched for each cluster and looks for the cohesion and separation values. After the cohesion and separation values are obtained, the next step is to calculate the silhouette coefficient to determine the average distance between the data and other cluster data.
-
2. In the Elbow method, the best cluster results are 4, which are obtained from the elbow pattern resulting from the Elbow method. The results of the Elbow method were reoptimized with the Davies Bouldin Index method and produced the best cluster of 4 with a value of 0.49.
-
3. The results of the labeling of this study are in the form of clusters 0.1, 2 and 3 where in cluster 0 there are 15315 data, cluster 1 there are 208 data, cluster 2 there are 222 data and cluster 3 there are 1191 data.
References
[1]Abdullah, D., Susilo, S., Ahmar, A. S., Rusli, R., & Hidayat, R. (2021). The application of K-means
clustering for province clustering in Indonesia of the risk of the COVID-19 pandemic based on COVID-19 data. Quality & Quantity. https://doi.org/10.1007/s11135-021-01176-w
-
[2] Darmansah, D. D., & Wardani, N. W. (2021). Analisis Pesebaran Penularan virus corona Di Provinsi Jawa Tengah Menggunakan Metode K-means clustering. JATISI (Jurnal Teknik Informatika dan Sistem Informasi), 8(1), 105-117.
https://doi.org/10.35957/jatisi.v8i1.590
-
[3] Darmi, Y. D., & Setiawan, A. (2017). Penerapan
metode clustering K-means dalam pengelompokan penjualan produk. JURNAL MEDIA INFOTAMA, 12(2). https://doi.org/10.37676/jmi.v12i2.418
-
[4] Indraputra, Fitriana (2020). K-Means Clustering Data COVID-19, Vol (10), No.3, 275-282
-
[5] M. Abdulkareem, N., Mohsin Abdulazeez, A., Qader Zeebaree, D., & A. Hasan, D. (2021). COVID-19 world vaccination progress using machine learning classification algorithms. Qubahan Academic Journal, 1(2), 100-105. https://doi.org/10.48161/qaj.v1n2a53
-
[6] Marisa, F., Pribady, B. A., Desi, A., Maukar, A. L. (2021). Pendeteksi Daerah (Provinsi) Rawan COVID19 dengan metode unsupervised learning & algoritma k-means, Vol (12), No. 1, 17-21
-
[7] Nabila, Isnain, Permata, Abidin (2021). Analisis Data Mining Untuk Clustering Kasus Covid-19 Di Provinsi
Lampung Dengan Algoritma K-Means, Vol (2), No. 2, 100-108
-
[8] Navastara, D. A., Mursidah, E., Gonti, Y. A., Wahyuni, D., Wiyadi, P. D., & Suadi, W. (2019). Clustering topik penelitian berbasis unsupervised learning untuk rekomendasi koleksi pustaka Di perpustakaan its. JUTI: Jurnal Ilmiah Teknologi Informasi, 17 (2), 125.
https://doi.org/10.12962/j24068535.v17i2.a788
-
[9] Parhusip, H. A. (2020). Study on COVID-19 in the world and Indonesia using regression model of SVM, Bayesian ridge and gaussian. JURNAL ILMIAH
SAINS, 20(2), 49.
https://doi.org/10.35799/jis.20.2.2020.28256
-
[10] Priati, Ahmad Fauzi (2017). Data Mining dengan Teknik Clustering Menggunakan Algoritma K-Means pada Data Transaksi Superstore
-
[11] Retnoningsih E, Pramudita R. (2020). Mengenal Machine Learning Dengan Teknik Supervised Learning dan Unsupervised Learning menggunakan Python. Bina Insani ICT journal. 7 (2): 156-165
-
[12] Solichin, A., & Khairunnisa, K. (2020). Klasterisasi Persebaran virus corona (COVID-19) Di DKI Jakarta Menggunakan Metode K-means. Fountain of Informatics Journal, 5(2), 52.
https://doi.org/10.21111/fij.v5i2.4905
-
[13] Untoro, M. C., Anggraini, L., Andini, M., Retnosari, H., & Nasrulloh, M. A. (2021). Penerapan metode K-means clustering data COVID-19 Di Provinsi Jakarta. Teknologi, 11(2), 59-68.
https://doi.org/10.26594/teknologi.v11i2.2323
-
[14] Uperiati, A., Bettiza, M., & Puspasari, A. (2020). Perbandingan metode fuzzy C-means Dan K-means dalam klasifikasi kelulusan mahasiswa (Studi kasus : Jurusan manajemen, universitas maritim Raja Ali Haji. Jurnal Sustainable: Jurnal Hasil Penelitian dan Industri Terapan, 9(2), 75-81.
https://doi.org/10.31629/sustainable.v9i2.1409
-
[15] Virgantari, F., & Faridhan, Y. E. (2020). K-Means Clustering of COVID-19 Cases in Indonesia’s Provinces. Vol (5). No. 2, 1-7
-
[16] Wu, J., & Sha, S. (2021). Pattern recognition of the COVID-19 pandemic in the United States: Implications for disease mitigation. International Journal of Environmental Research and Public Health, 18(5), 2493. https://doi.org/10.3390/ijerph18052493
-
[17] Yunita, F. (2018). Penerapan data mining menggunkan algoritma K-means clustring pada penerimaan mahasiswa baru. SISTEMASI, 7(3), 238.
Discussion and feedback