Design and Implementation of Arduino-Based Weather Monitoring System in Rural
on
Journal of Electrical, Electronics and Informatics, p-ISSN: 2549–8304 e-ISSN: 2622–0393
58
Design and Implementation of Arduino-Based Weather Monitoring System in Rural
I G. A. K. Diafari Djuni H.1, I G. A. P. Raka Agung 2
-
1) Electrical Engineering Departement
Faculty of Engineering, Udayana University
Denpasar, Indonesia igakdiafari@gmail.com
-
2) Electrical Engineering Departement
Faculty of Engineering, Udayana University
Denpasar, Indonesia
Abstract The Weather Monitoring System is an instrument that measures and records meteorological parameters using sensors. This sensor serves as a measuring instrument to measure every change in weather. Output data from sensors will be sent to the web server so that it can be accessed by users or people who need weather data. Weather data obtained from temperature sensors, air humidity, wind direction and speed, and air pressure are processed by the microcontroller and sent to the web server via cellular networks. The data displayed on the web server is a graph according to the value sent by the sensor. This study began a literature study on Arduino Uno, Ethernet shield, BMP180 sensor sensor, DHT11 sensor, wind direction and speed kit, Wifi Router, 3G network modem, equipment that will be realized starting with designing and making hardware and software. Tests carried out in the telecommunications system laboratory include testing air pressure with the BMP180 Sensor, testing temperature and humidity with the DHT11 Sensor, testing kits for wind speed and direction, testing data delivery with the Wifi Router and 3G network modem, and testing all devices. From the system design and testing concluded that the Arduino-based Automatic Weather Monitoring Device on 3G Cellular Networks has good flexibility and precision because the devices can be placed in various places, especially in rural areas. Data Output from sensors can be monitored through the Thingspeak.com website, so users do not need to directly monitor where the device is placed.
Index Terms— Weather Monitoring System, Web server, Arduino, Cellular Network.
network. With the facility access to this internet network allows the occurrence of long-distance communication to send the results of sensor readings to the web server. The data collected by the weather monitoring system on the web server can be easily accessed by the operator to create an analysis or data storage. Another advantage of using a web server is that data security is more secure.
The overall flow chart illustrates the process of creating an Arduino Based Weather Station System using Cellular Networks starting from the study literature, hardware design, software design, and testing processes.
In the system block diagram design process is carried out with the hardware design process for each circuit block. At this stage, a series of microcontroller and sensors is designed and the design of sensor data on the web can be accessed by users with desktop or smartphone
The next process is to assemble each circuit block and proceed with the software design process for several blocks
of the circuit which includes designing software for sensor components used and designing software for Ethernet shields on Arduino-based microcontroller circuits.
Testing of each blocks consisting of several stages :
-
1. Testing of Arduino-based microcontroller circuits and temperature, humidity, air pressure, wind direction and speed sensors
-
2. Testing data transmission systems with modems and wifi routers on 3G networks
-
3. Testing devices and results on web servers in telecommunication system laboratory
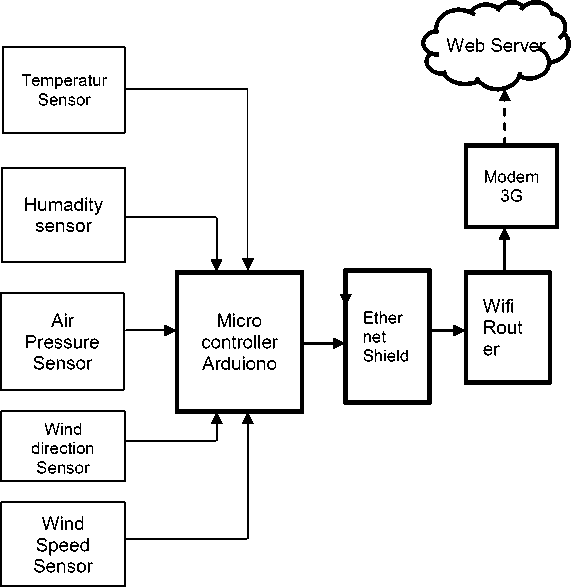
Figure 1. A block diagram of the Weather Monitoring Device system
-
III. RESULTS AND DISCUSSION
The Arduino-based Weather Monitoring System uses 4 types of sensors namely DHT22 as a humidity sensor, BMP180 sensor as a temperature and air pressure sensor, LM393 sensor as a wind speed sensor and 2SS52M sensor as a wind direction sensor. Data received by the sensor will be sent via the Cellular network using a 3G / 4G modem. The software used in this design is the Arduino IDE Software with a sensor library that is already available in the software.
-
3.1 Designing Devices with Sensors
. The sensors used in this automatic weather monitoring device have their respective functions, DHT22 sensor for measuring humidity, BMP180 sensor for measuring temperature and air pressure, LM393 sensor for measuring wind speed and 2SS52M sensor for measuring wind
direction. All sensors get the same voltage from Arduino that is 5V.
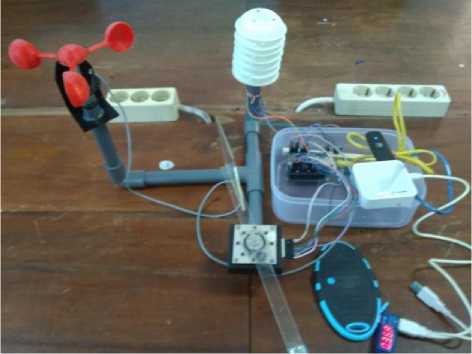
Figure 2. Device design with sensors on bread board
-
3.2 Display Design Sensor output on the Web
To display the results of the sensors used in the tool on the web, it is necessary to configure several items. The web used in this research is thinkspeak which supports Arduino-based sensor systems.
After registering on the web thinkspeak.com continues by creating a field or table containing sensor data. The number of fields used is 5 fields according to the number of sensors in the device. Use the API keys in Arduino to indicate that the device is registered on the Thinkspeak web. The output of the output display from the sensor data can be shown in the following figure.
Q ThingSpeak " Channels - Apps - Community Support -
Commercial Lfce HowtoBuy Account- SignOut
Channel Settings
Percentage complete 50⅛
Channel ID 532765
Name Mmwing-CLau
Description WacuniiAMonflonng-CLMU
Help
CboiinelssiiNealttliedauthMaThingsiieakappliutionraIIuts. Eachctiannel includes status data, once you tolled Oau in a channel, you can use ThingSpeW tops to analyze and
Channel Sellings
-
* FicWf: Check the tax to enable the Field, and enter a Heki name, each ThingSpeak channel can haw up to a talus,
-
» Iketadata: Emei Inlorrnatiun about channel OalarInckiding JSON1XML,or CSV data.
-
• IagscinterkerwrHdsthatidenoEytliechannel1SemiateUgswiih oo∣mn>s
ThlnjSpeak cIiannal specify the U Ri,
0 Lathudc 3 p er i fy r he I a lit u de posit I on In decimal degrees. Fo r ex a mρ⅛, the IatlCudeoF the City of London IS SLMTZ.
longitude of BiecAy nt London is -0.1275.
0 Cievatioei: specify die elevator. position me<e<s. FOr example, the Sleration of
on temperature, humidity, air pressure, wind speed, and wind direction
© C0M7 - □ ×
seπd
Kecepatan Angin =8.58 λ
2017/8/3 (Kamis) 13:27:47 Kelembapan: 66.60 % Temperature: 26.87 Tekanan: 1012.89 Kecepatan Angin: 8.58 temperature: 26.86 deg C, 80.35 deg F absolute pressure: 1012.91 mb, Suhu= 26.40 kelembapan udara= 65.20 Kecepatan Angin = 8.58 2017/8/3 (Kamis) 13:28:15 Kelembapan: 65.20 % Temperature: 26.86 Tekanan: 1012.91 Kecepatan Angin: 8.58 Arah Angin : Utara temperature: 26.84 deg C, 80.32 deg F absolute pressure: 1012.90 mb, Suhu= 26.40 kelembapan udara= 64.00 Kecepatan Angin = 8.58 2017/8/3 (Kamis) 13:28:42 Kelembapan: 64.00 % Temperature: 26.84 Tekanan: 1012.90 Kecepatan Angin: 8.58 temperature: 26.82 deg C, 80.28 deg F absolute pressure: 1012.89 mb, Suhu= 26.40 kelembapan udara= 63.30 Kecepatan Angin = 8.58 2017/8/3 (Kamis) 13:29:10 Kelembapan: 63.30 % Temperature: 26.82 Tekanan: 1012.89 Kecepatan Angin: 8.58 Arah Angin : Utara
QAutosaoI No line ending v ∣ 115200 baud ‰Γ∣
Figure 4. Display overall sensor data on the monitor serial
-
3.3.2 Test results on the web server
The test results data obtained results data on the graph displayed at thingspeak.com public view. Figures 5, 6, and 7 are graphs of temperature, air pressure and air humidity which data is taken for 75 minutes and in the graph changes occur at each sample time.
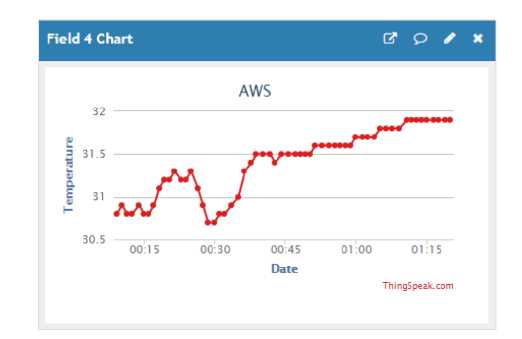
Figure 5. Temperature graph on thingspeak web server
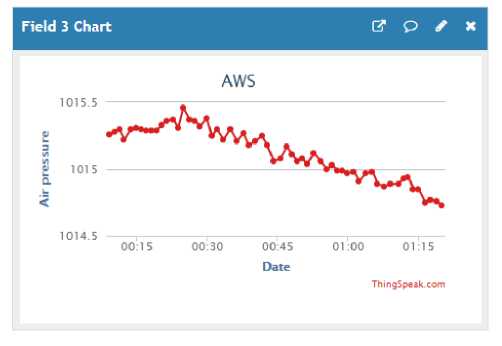
Figure 6. The air pressure graph on the thingspeak web server
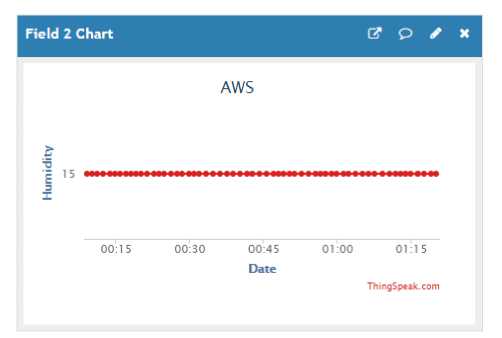
Figure 7. The air humidity graph on thingspeak web server
Figures 8 and 9 are graphs of wind speed and direction whose data is taken for 15 minutes and in the graph it appears that temperature changes occur every time the sample. To determine the direction of the wind in the thinkspeak web server, the following information is given
-
1. Numbers 1 and 5 indicate north and south
-
2. Numbers 3 and 7 indicate East and West
-
3. Numbers 2 and 6 indicate Northeast and Southwest
-
4. Numbers 4 and 8 indicate Southeast and Northwest
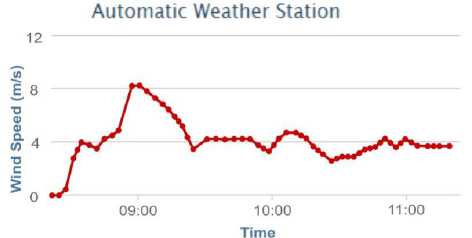
Figure 8. The wind speed graph on thingspeak web server
Automatic Weather Station
3
υ 1 E
O *
09:00 10:00 11:00
Time
Figure 9. The wind direction graph on thingspeak web server
The results of designing and testing the device, concluded that the Arduino-based Automatic Weather Monitoring Device on 3G Cellular Networks has good flexibility and precision because the devices can be placed in various places, especially in rural areas. Data Output from sensors can be monitored through the Thingspeak.com website, so users do not need to directly monitor where the device is placed.
Acknowledgment
Acknowledgments addressed to Institute of Research and Community Service (LPPM) Udayana University and
Faculty of Engineering Udayana University in Research Grants Young Lecturer Year 2018.
References
-
[1] Andrianto, Heri. 2008. Pemrograman Mikrokontroler AVR ATmega16. Menggunakan Bahasa C. Bandung: Penerbit Informatika.
-
[2] Budi Santoso, (2007) Automatic Weather Station. Jakarta:Workshop peralatan.
-
[3] Feri, 2011, Pengenalan Arduino, www.tobuku.com/docs/Arduino-Pengenalan.pdf diakses tgl 24 Februari 2018
-
[4] Santosa, C.E., dan Ari Sugeng Budiyanta, 2013, Rancang Bangun Sensor Suhu Tanah dan Kelembaban Udara.Jakarta: Peneliti Bidang Instrumentasi dan Wahana Dirgantara, LAPAN.
-
[5] Isnianto, H.N., Esty Puspitaningrum. 2012.Rancang Bangun Sistem Telemetri Dan Monitoring Stasiun Cuaca Secara Nirkabel Berbasis Mikrokontroler.Seminar Nasional Informatika, UGM, ISSN: 19792328
-
[6] Iswanto,2011, Belajar Mikrokontroler AT89s51 dengan Bahasa C, ANDI Yogyakarta
-
[7] Muhammad Salim Machfud. 2016.RancangBangun Automatic Weather Station (AWS) Menggunakan Raspberry Pi.ALHAZEN Journal of Physics. ISSN: 2407-9073
-
[8] Roneel V. Sharan. 2014.Development of a Remote Automatic Weather Station with a PCbased Data Logger.Suva:International Journal of Hybrid Information Technology
-
[9] Setyasaputra,Nurmajid.2011, Desaindan Implementasi stasiun CuacaO tomatis Berbasis Mikrokontrole dengan RF Module di Kampus IT Telkom. Bandung: Karya Ilmiah Universitas Telkom.
-
[10] Willy Sucipto, I. G. A. K. Diafari Djuni Hartawan, Widyadi Setiawan, 2017, Rancang Bangun Perangkat Pemantau Cuaca Otomatis Berbasis Mikrokontroler Pada Jaringan WLAN IEEE 802.11b, Vol 4 No 2 Jurnal Ilmiah Spektrum, E-ISSN: 2302-3163
-
[11] Republik Indonesia. 2009.Undang-Undang tentang Meteorologi, Klimatologi, dan Geofisika. Jakarta: Sekretariat Negara.
Discussion and feedback