Analysis of the Increase of Transformer Power Losses due to the Operation of Unbalanced Nonlinier Loads
on
Journal of Electrical, Electronics and Informatics, p-ISSN: 2549–8304 e-ISSN: 2622–0393
38
Analysis of the Increase of Transformer Power Losses due to the Operation of Unbalanced Nonlinier Loads
I Wayan Rinas1, I Made Suartika2, and Anak Agung Maharta Pemayun3
-
1,2,3 Electrical Engeneering Departement, Faculty of Engeneering
Udayana University (UNUD)
Jimbaran, Badung, Bali, Indonesia
Abstract - Non-linear loads are the source of harmonic current for electric utilities. The high level of harmonics greatly affects the increase of losses of electrical power (losses). The quality of electric power is determined by the parameters of power losses that occur in the transformer due to harmonic distortion. In this research will be analyzed THD from result of measurement and simulation in accordance with IEEE 519-2014 standard, power loss analysis on transformer before and after. Harmonics, the impact is increased due to unbalanced linear currents.
Index Terms — Trafo, Losses, nollinier load, unbalanced, harmonic
-
I. Introduction1
The power system is designed to work at a frequency of 50 Hz. Non-linear loads can result in the formation of waves at high frequencies which are multiples of their fundamental frequencies and are known as harmonics. [1] [5] [6] [7]. This can disrupt the electrical system in its fundamental frequency, so that the current waveform or voltage which ideally is pure sinusoidal will become defective due to harmonic distortion that occurs.
The operation of power electronics equipment at Udayana University Faculty of Engineering can cause distortion in its electric current waveform. The transformer is designed to supply electrical power with minimum losses at its fundamental frequency. The high level of harmonics is very influential on the transformer, so that there will be an increase in losses [2]
IEEE 519 Standards 2014 is the standard used as a limitation for analyzing THD (Total Harmonic Distortion). From the results of the short-circuit ratio, according to IEEE 519 Standards 2014 standard, the maximum allowable threshold of the transformer feeder in the Udayana University Faculty of Engineering is 8.0%, while the maximum THD limit is 5.0%. The measurement data on the transformer feeder at the Udayana University Faculty of Engineering shows the current THD content is still over the standard of more than 8%. While the THD content of the voltage has met the standard, the value is less than 5%.
The current THD content of the transformer feeder at the Udayana University Faculty of Engineering is currently incompatible with the IEEE 519 standard 2014,
causing higher power losses. In this research, the analysis of electrical power losses caused by the emergence of harmonic current in 200 kVA power transformer.
-
II. LITERATURE REVIEW
-
2.1. Harmonics On Electric Power System
-
Harmonics is a phenomenon arising from the operation of non-linear electric load, which is the source of the formation of high frequency waves (multiples of fundamental frequencies, eg 100Hz, 150Hz, 200Hz, 300Hz, and so on). The harmonic voltage or current measured by the magnitude of each harmonic component of its component is expressed in the prosen. To obtain a parameter used to assess the harmonics is used THD [5]. THD is expressed by the following equation, [5]:
THD =

Mh2
M1
(1)
Where Mh is the rms value of the harmonic component h in the sum of M.
-
2.2. Linear and non-linear load
-
a. Linear load
Linear load is a load whose current component is proportional to its voltage. There is a linear relationship between the current and the voltage so that the current waveform will be the same as the voltage waveform, as shown in Figure 1. Linear loads absorb sinusoidal currents when supplied by sinusoidal voltages. Examples of linear loads include electric motors, heating, incandescent, and others [6].
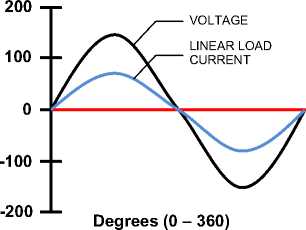
Fig. 1. Current and voltage waves on linear load [6]
-
b. Non-linear load
The load whose current component is not proportional to the voltage component, so the current waveform is not the same as the voltage waveform. There is no linear relationship between current and voltage. Non-linear loads absorb non sinusoidal currents as well as harmonic currents, although they are supplied by sinusoidal voltages, as shown in Figure 2. Examples of non-linear loads include rectifiers (power supply, UPS, computer, motor speed setting, release lamps), ferromagnetic devices, DC motors, and fire arc furnaces, and others [6].
200
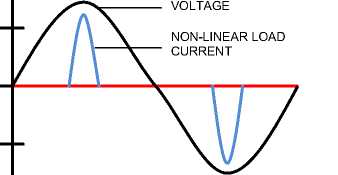
Degrees (0 – 360)
-200
Fig. 2. Current and voltage waves on non-linear load [6]
-
2.3. Standard THD voltage & THD currents
-
a. THD voltage
Table 1 of the IEEE standard 519-2014, suggests the following values as the recommended maximum limit for voltage correction.
TABLE 1 MAXIMUM VOLTAGE LIMIT CONFORMS TO IEEE STANDARD 519-2014 [4]
|
BusVoltage at PCC |
Individual Voltage Distortion (%) |
Total harmonic distortion THD (%) |
|
V ≤ 1,0 kV |
5,0 |
8,0 |
|
1 kV < V < 69 kV |
3,0 |
5,0 |
|
69 kV < V ≤ 161 kV |
1,5 |
2,5 |
|
161 kV < V |
1,0 |
1,5 |
-
b. THD current
Table 2 of the IEEE standard 519-2014, suggests the following values as the recommended maximum limit for current distortion.
TABLE 2 MAXIMUM VOLTAGE LIMITS CONFORM TO IEEE STANDARD 519-2014 [4]
|
ISC/IL |
3≤h≤ 11 |
11 ≤h ≤1 7 |
17≤h ≤23 |
23≤h ≤35 |
35≤ h≤50 |
TH D |
|
< 20 |
4,0 |
2,0 |
1,5 |
0,6 |
0,3 |
5,0 |
|
20 - 50 |
7,0 |
3,5 |
2,5 |
1,0 |
0,5 |
8,0 |
|
50 - 100 |
10,0 |
4,5 |
4,0 |
1,5 |
0,7 |
12, |
|
100 - 1000 |
12,0 |
5,5 |
5,0 |
2,0 |
1,0 |
15 |
|
>1000 |
15,0 |
7,0 |
6,0 |
2,5 |
1,4 |
20,0 |
-
2.4. Losses Calculation On Transformer Effects
Harmonics
Load loss (PLL) transformer in per unit, can be searched with the following formula;
Pll = ∑ Ih2 + (∑ Ih2xh2).PEc-R(P.u) (2)
Where PEC-R is eddy current loss factor, h is the harmonic number and Ih is the harmonic current. Ih2 × h2) PEC-R is an eddy current loss factor under basic conditions in p.u.Σ Ih2 is an I2R loss component in p.u, whereas (Σ The eddy current loss factor is shown in Table 3 [5].
TABLE 3
VALUES OF PEC-R [5]
|
Type |
MVA |
Voltage |
%PEC-R |
|
Dry |
≤ 1 |
3 - 8 | |
|
≥ 1.5 |
5 kV HV |
12 - 20 | |
|
≤ 1.5 |
15 kV HV |
9 - 15 | |
|
Oil - filled |
≤ 2.5 |
480 V LV |
1 |
|
2.5 - 5 |
481 V LV |
1 - 5 | |
|
> 5 |
482 V LV |
9 -15 |
-
III. METHODOLOGY
The analysis in this research is done in several stages like figure 3.
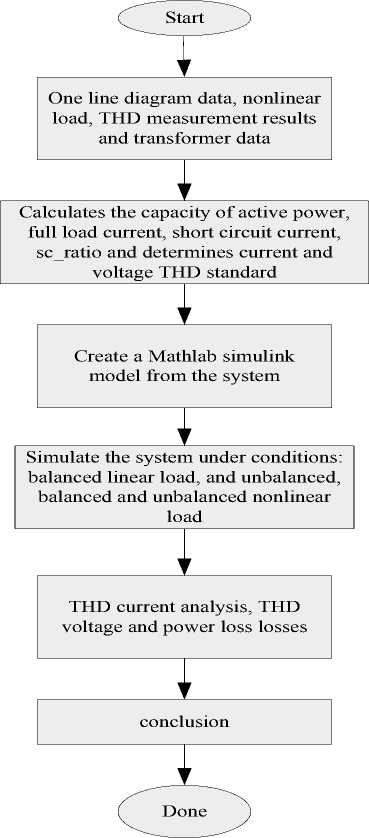
Fig. 3 Step analysis
THDi simulation by using FFT obtained result as shown in figure5. The source of three phases is equivalent to the transformer secondary to the feeder. Vtrafo = 400/231 V; Z = 4%; f = 50%; X / R = 3,638; Rs = 0.0085 Ω and Ls = 9,84e-5 H. Nonlinear load of 35442 Watt / phase. RL = 1.36 Ohm and LLoad = 0.0241 Henry.
The result of voltage harmonic simulation and voltage harmonic spectrum is shown in figure 4.
While the result of THDi simulation by using FFT obtained result as shown in figure 5.
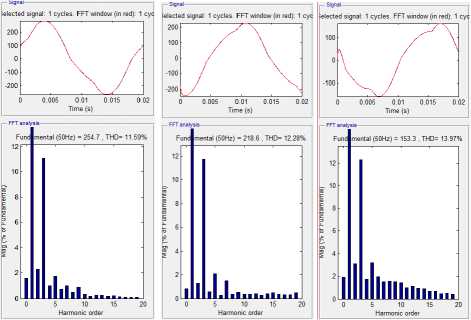
Fig. 5 Wave and THD current spectrum:
-
(a) THDi Phase R, (b) THDi Phase S, (c) THDi Phase T transformer.
The average THDv is 1.75%, while the average THDi is 12.61% as table 4. The voltage and current values of the simulation results for the harmonic order of the odd multiple of phases R, S, and T can be seen in table 5.
-
IV. RESULTS AND DISCUSSION
-
4.1. THDi&V simulation
The simulation on the transformer feeder at Udayana University Faculty of Engineering requires parameters
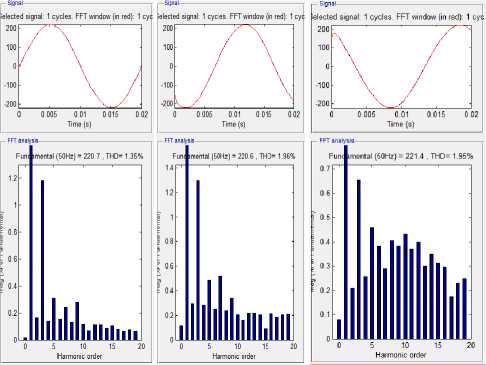
Fig. 4 Wave and spectrum THD voltage:
-
(a) THDVPhasa R, (b) THDV Phase S, (c) THDV Phasa
R = 1.36 Ohm and L = 0.0241 Henry
The result of voltage harmonic simulation and voltage harmonic spectrum is shown in figure 4. While the result of
TABLE 4
AVERAGE THD SIMULATION RESULTS
|
Phase |
THDv (%) |
THDi (%) |
|
R |
1,35 |
11,59 |
|
S |
1,96 |
12,28 |
|
T |
1,95 |
13,97 |
|
Average |
1,75 |
12,61 |
TABLE 5
FLOW VALUES IN EACH ORDER OF ODD HARMONICS PHASA R.
|
Order of Harmonics |
Phase R |
Phase S |
Phase T | |||
|
Current (%) |
Current (A) |
Current (%) |
Current (A) |
Current (%) |
Current (A) | |
|
1 |
100,0 |
157,6 |
100,0 |
206,7 |
100,0 |
189,0 |
|
3 |
8,0 |
12,6 |
4,6 |
9,4 |
6,3 |
11,8 |
|
5 |
4,1 |
6,6 |
6,6 |
13,6 |
3,8 |
7,3 |
|
7 |
5,0 |
7,8 |
2,6 |
5,4 |
4,6 |
8,7 |
|
9 |
2,9 |
4,5 |
1,7 |
3,4 |
2,3 |
4,2 |
|
11 |
1,3 |
2,0 |
1,0 |
2,1 |
1,3 |
2,4 |
|
13 |
1,0 |
1,5 |
0,7 |
1,4 |
0,9 |
1,6 |
|
15 |
0,8 |
1,2 |
0,5 |
1,0 |
0,7 |
1,4 |
|
17 |
0,4 |
0,6 |
0,4 |
0,8 |
0,6 |
1,1 |
|
19 |
0,5 |
0,7 |
0,3 |
0,7 |
0,6 |
1,1 |
-
4.2. Losses Transformer Analysis
Factors that can cause the loss of transformer is THDi on the transformer. The analysis is done in two ways: i. Analysis of losses without harmonic influence.
-
ii. Analysis of losses due to the influence of harmonics.
The purpose of the analysis is to find out how much increase in losses due to the influence of transformer harmonics.
-
I. Trafo Losses Analysis Without Effect of Harmonics.
There are two losses that need to be known to calculate total transformer losses:
-
i. No-load losses
-
ii. Load Losses
Based on SPLN 50: 1997 on distribution transformer specifications, for distribution transformers with a power capacity of 200 kVA has iron losses of 480 Watt and copper losses of 2500 Watt. Once the value is known and then the total loss value can be calculated as follows:
Total Losses = Pi + Pcu
=480+2500 = 2980 W = 2,98 kW
-
II. Losses Trafo Analysis Due Effect Harmonics.
Losses of a transformer can technically be referred to as loadloss. In units per unit (p.u), loadloss can be calculated using the equation:
pll = ∑ Ih 2 +∑ Ih 2 × h 2 )× pec- r (P.u) where :
P = Eddy CurrentLossFactor(%)
EC - R
h = Harmonics (%)
Ih = Current Harmonics (A).
P value is known at 1%. Based on the measurement EC-R
results, it is known that:
S = 200 kVA
Cosϕ = 0,8
So the value can be calculated by the equation below: S× cosϕ
PBase 1φ = 3
200 × 0,8 =3
= 92,376 kW
Furthermore, the calculation of losses can be done due to the influence of harmonics for each phase .
-
a. Phasa R Losses
To calculate the losses of the transformer in phase R need to know the harmonic current of each odd order in units per unit with the following calculation:
IhI (p.u )- Ih1 -1576 -1,000 (p.u)
I1 157,6
Ih 3 (p. u )= Ih3 = 126. = 0,08 (p. u)
I1 157,6
Ih5 (p.u )= Ih- = 6h6T = 0,042 (p.u )
I1 157,6
In the same way, the harmonic currents in phase R in pu can be determined, the order of harmonics is shown in table 6.
TABLE 6
ANALYSIS OF PHASE HARMONIC FLOW R
|
Order of Harmonics |
Ih (%) |
Ih (A) |
Ih (p.u) |
2 Ih (p.u) |
22 Ih × h (p.u) |
|
1 |
100,0 |
157,6 |
1,000 |
1,0000000 |
1,0000000 |
|
3 |
8,0 |
12,6 |
0,080 |
0,0063919 |
0,0575269 |
|
5 |
4,1 |
6,6 |
0,041 |
0,0017538 |
0,0438445 |
|
7 |
5,0 |
7,8 |
0,050 |
0,0024495 |
0,1200253 |
|
9 |
2,9 |
4,5 |
0,029 |
0,0008153 |
0,0660386 |
|
11 |
1,3 |
2,0 |
0,013 |
0,0001610 |
0,0194865 |
|
13 |
1,0 |
1,5 |
0,010 |
0,0000906 |
0,0153094 |
|
15 |
0,8 |
1,2 |
0,008 |
0,0000580 |
0,0130447 |
|
17 |
0,4 |
0,6 |
0,004 |
0,0000145 |
0,0041888 |
|
19 |
0,5 |
0,7 |
0,005 |
0,0000197 |
0,0071218 |
|
Total |
1,0117543 |
1,3465864 | |||
From the calculation of harmonic order of 1 to 19, it can be calculated loadloss in phase R:
Pll PhaseR = 1.0117543 +1,3465864 ×0,01 = 1,0252201 p.u
From the calculation of known copper loss has increased by 0.0117543 p.u. The R-phase losses in kW are:
Pcu (kW) = Pcu (P.u) × Pbs 1 φ
Pcu (kW) = 0.01 17543 p.u × 92,376 kW
Pcu (kW) = 1,086 kW
Eddy-Current Loss has increased by 0,003465864 p.u.
Eddy-Current Loss in kW are:
Pe (kW) = Pe (p.u) × Pbase 1 φ
Pe (kW) = 0,003465864 p.u × 92,376 kW
Pe (kW) = 0,32 kW
Hysterisis Loss can be calculated by:
∞
Ph = Kh ×∑ih ×h
h=1
Ph1 = 0,26 ×157,6 ×1 = 40,976 W
Ph 3 = 0,26 ×12,6 × 3 = 9,828 W
In the same way, the total hysteresis losses in Table 7.
TABLE 7
HYSTERESIS LOSSES PHASA R.
|
Order of Harmonics |
Ih (A) |
Ph (Watt) |
|
1 |
157,6 |
40.976 |
|
3 |
12,6 |
9.828 |
|
5 |
6,6 |
8.580 |
|
7 |
7,8 |
14.196 |
|
9 |
4,5 |
10.530 |
|
11 |
2 |
5.720 |
|
13 |
1,5 |
5.070 |
|
15 |
1,2 |
4.680 |
|
17 |
0,6 |
2.652 |
|
19 |
0,7 |
3.458 |
|
Total |
105,69 | |
The total addition of losses in phase R due to the influence of harmonic distortion are:
LossesPhasa r = Pu + Pi
LossesPhasa r = Pcu + (P, + Ph ) LossesPhasa r = 1,086 + (0,32 + 0,106) LossesPhasa R = 1,512 kW
-
b. Phasa S Losses
The calculation of the transformer losses in phase S is the same as that done in phase R. In the same way the harmonic current obtained in phase S in units p.u, from the order of harmonics 1-19 in table 8.
TABLE 9
THE HYSTERESIS LOSSES PHASE S.
|
Order of Harmonics |
Ih (A) |
Ph (Watt) |
|
1 |
206,7 |
53,7420 |
|
3 |
9,4 |
7,3320 |
|
5 |
13,6 |
17,6800 |
|
7 |
5,4 |
9,8280 |
|
9 |
3,4 |
7,9560 |
|
11 |
2,1 |
6,0060 |
|
13 |
1,4 |
4,7320 |
|
15 |
1 |
3,9000 |
|
17 |
0,8 |
3,5360 |
|
19 |
0,7 |
3,4580 |
|
Total |
118,17 | |
TABLE 8
ANALYSIS OF PHASE HARMONIC FLOW
|
Order of Harmonics |
Ih (%) |
Ih (A) |
Ih (p.u) |
2 Ih (p.u) |
22 Ih ×h (p.u) |
|
1 |
100,0 |
157,6 |
1,000000 |
1,0000000 |
1,0000000 |
|
3 |
8,0 |
12,6 |
0,045477 |
0,0020681 |
0,0186130 |
|
5 |
4,1 |
6,6 |
0,065796 |
0,0043291 |
0,1082273 |
|
7 |
5,0 |
7,8 |
0,026125 |
0,0006825 |
0,0334428 |
|
9 |
2,9 |
4,5 |
0,016449 |
0,0002706 |
0,0219160 |
|
11 |
1,3 |
2 |
0,010160 |
0,0001032 |
0,0124894 |
|
13 |
1,0 |
1,5 |
0,006773 |
0,0000459 |
0,0077529 |
|
15 |
0,8 |
1,2 |
0,004838 |
0,0000234 |
0,0052663 |
|
17 |
0,4 |
0,6 |
0,003870 |
0,0000150 |
0,0043291 |
|
19 |
0,5 |
0,7 |
0,003387 |
0,0000115 |
0,0041402 |
|
Total |
1,0075492 |
1,2161770 | |||
Loadloss (PLL) in phase S obtained from the calculation of harmonic order 1-19.
PLL_PhasaS = 1.0075492 + 1,2161770 × 0,01 = 1,0197110 p.u
From the calculation of PLLs it is known that the copper loss has increased by 0.0075492 p.u.
Pcu (kW) = Pcu (p.u) × Pbase 1 φ
Pcu (kW) = 0.0075492 p.u × 92,376 kW
Pcu (kW) = 0,697 kW
.
While Eddy-Current Loss has increased by 0,002161770 p.u
Pe (kW) = Pe (p.u) × Pbase 1 φ
Pe (kW) = 0,002161770 p.u ×92,376 kW
Pe (kW) = 0,2 kW
.
To calculate the hysterisis loss S phase can be calculated by:
Ph1 = 0,26 × 206,7 × 1 = 53,742 W
Ph 3 = 0,26 × 9,4 × 3 = 7,332 W
In the same way, m, hysteresis loss until the harmonic order of 19 can be seen as table 9.
Total addition of losses in phase S due to the influence of harmonics can be calculated:
Losses Phasa S = 0,697 + (0,2 + 0,118)
LossesPhasa S = 1,015 kW
.
-
c. Phasa T Losses
The calculation of the transformer losses in phase T is the same as that done in phase R & S. In the same way the harmonic current obtained in phase T in units p.u, from the order of harmonics 1-19 in table 10.
TABLE 10
THE HYSTERESIS LOSSES PHASE S.
|
Order of Harmonics |
Ih (%) |
Ih (A) |
Ih (p.u) |
2 Ih (p.u) |
T 1 7 2 Ih ×h (p.u) |
|
1 |
100 |
189 |
1,000000 |
1,0000000 |
1,0000000 |
|
3 |
6,3 |
11,8 |
0,062434 |
0,0038980 |
0,0350819 |
|
5 |
3,8 |
7,3 |
0,038624 |
0,0014918 |
0,0372960 |
|
7 |
4,6 |
8,7 |
0,046032 |
0,0021189 |
0,1038272 |
|
9 |
2,3 |
4,2 |
0,022222 |
0,0004938 |
0,0400000 |
|
11 |
1,3 |
2,4 |
0,012698 |
0,0001612 |
0,0195112 |
|
13 |
0,9 |
1,6 |
0,008466 |
0,0000717 |
0,0121116 |
|
15 |
0,7 |
1,4 |
0,007407 |
0,0000549 |
0,0123457 |
|
17 |
0,6 |
1,1 |
0,005820 |
0,0000339 |
0,0097895 |
|
19 |
0,6 |
1,1 |
0,005820 |
0,0000339 |
0,0122284 |
|
Total |
1.0083581 |
1.2821914 | |||
Loadloss (PLL) in phase T obtained from the calculation of harmonic order 1-19.
PLL PhasaT = 1.0083581 + 1,2821914 × 0,01 = 1,02118 p.u _
From the calculation of PLLs it is known that the copper loss has increased by 0,0083581 p.u.
Pcu (kW) = 0.0083581 p.u × 92,376 kW
Pcu (kW) = 0,772 kW
While Eddy-Current Loss has increased by 0,002821914 p.u
Pe (kW) = 0,002821914 p.u×92,376 kW
Pe (kW) = 0,261 kW
To calculate the hysterisis loss T phase can be calculated by:
Ph1 = 0,26 × 2 = 189 × 1 = 49,14 W
Ph 3 = 0,26 ×11,8 × 3 = 9,204 W
In the same way, m, hysteresis loss until the harmonic order of 19 can be seen as table 11.
TABLE 11
THE HYSTERESIS LOSSES PHASE S.
|
Order of Harmonics |
Ih (A) |
Ph (Watt) |
|
1 |
189 |
49,1400 |
|
3 |
11,8 |
9,2040 |
|
5 |
7,3 |
9,4900 |
|
7 |
8,7 |
15,8340 |
|
9 |
4,2 |
9,8280 |
|
11 |
2,4 |
6,8640 |
|
13 |
1,6 |
5,4080 |
|
15 |
1,4 |
5,4600 |
|
17 |
1,1 |
4,8620 |
|
19 |
1,1 |
5,4340 |
|
Total |
121,524 | |
Total addition of losses in phase S due to the influence of harmonics can be calculated:
LossesPhasa T = 0,772 + (0,261 + 0,122)
LossesPhasa T = 1,154 kW
The total losses of the transformer due to the influence of harmonics can be calculated from the losses of each phasa as in table 12.
TABLE 12 ADDITION OF LOSSES TRANSFORMATOR DUE EFFECT OF HARMONICS
|
Phasa |
Pcu(kW) |
Pe(kW) |
Ph(kW) |
Losses (kW) |
|
Phasa R |
1,086 |
0,32 |
0,106 |
1,512 |
|
Phasa S |
0,692 |
0,2 |
0,118 |
1,015 |
|
Phasa T |
0,772 |
0,261 |
0,122 |
1,154 |
|
Total Losses Trafo |
3,681 | |||
From the results of the analysis of losses that have been done, it can be concluded that the operation of nonlinear unbalanced load at Faculty of Engineering Unud Bukit Jimbaran will be able to increase the Losses of the transformer operated.
References
-
[1] Arrilaga, J; Bradley, D.A; Bodger, P.S. 1985. Power System Harmonics. London: British Library.
-
[2] Dugan, R.C; McGranaghan, M.F; Santoso; Beaty, H.W. 2003. Electrical Power System Quality - Second Edition. USA: McGraw-Hill.
-
[3] Dugan, R.C; Rizy. 2001. Harmonic Considerations for Electrical Distribution Feeders. National Technical Information Service, Report No. ORNL / Sub / 81-95011/4 (Cooper Power Systems as Bulletin 87011, "Electrical Power System Harmonics, Design Guide).
-
[4] Alit Anga; Rinas; Antonius IBW, 2016. "Analysis Effect of Non-Linear Load Operations Against harmonic distortion on Blue Point Bay Villa & Spa ". Bukit-Jimbaran Badung: Majors Electrical Engineering Udayana University.
-
[5] Mielczarski, W. 1997. Quality of Electricity Supply and Management of Network Losses. Melbourne: Puma Press Publishing and Printing.
-
[6] IEEE Recommended Practices and Requirements for Harmonic Control in Electric Power Systems. IEEE Standard 519-2014.
-
[7] Anga; Rinas, Suartika ,. 2014. "Simulations and Solutions to Improve The Quality Of Electricity In Hotel Best Western Premiere .. Bukit - Jimbaran Badung: Department of Electrical Engineering Udayana University
Table 12 shows that the transformer has increased losses due to harmonic effect of 3,681 kW, so that the overall transformer losses are:
Total Lossestraf0 = Losses^ harmonisa + Lossesatibat hamonisa = 2,98 + 3,681 = 6,661 kW
IV. CONCLUSION
From the results of simulations and analysis conducted it can be concluded losses transformer without the influence of non-linear load unbalanced by 2.98 kW.
The result of Losses analysis by using unbalanced nonlinear load for each phases is: Phasa R losses 1,512 Kw, Phasa S losses 1,015 Kw, Phasa T losses 1,154 Kw. Operation of unbalanced nonlinear loads can increase the transformer losses by 3,681 Kw
Discussion and feedback