Correlation of Prostate Volume and Intravesical Prostatic Protrusion with Detrusor Wall Thickness using Transabdominal Ultrasonography in Benign Prostate Enlargement: A Preliminary Study
on
Directoryof

OPEN ACCESS
_∕ JOURNALS
P-ISSN: 2548-5962 ORIGINAL ARTICLE
E-ISSN: 2548-981X
https://ojs.unud.ac.id/index.php/jbn
Correlation of Prostate Volume and Intravesical Prostatic Protrusion with
Detrusor Wall Thickness using Transabdominal Ultrasonography in Benign
Prostate Enlargement: A Preliminary Study
Andre Tjie Wijaya1*, Nyoman Srie Laksminingsih2, I Made Dwijaputra2, I Gde Raka Widiana3, Gede Wirya Kusuma Duarsa4, Made Widhi Asih2, Firman Parulian Sitanggang2
-
1 Radiology Residency Program, Faculty of Medicine Universitas Udayana - Sanglah Hospital, Bali, Indonesia.
-
2 Radiology Department, Faculty of Medicine Universitas Udayana - Sanglah Hospital, Bali, Indonesia.
-
3 Kidney and Hypertension Division, Internal Medicine Department, Faculty of Medicine Universitas Udayana, Bali, Indonesia.
-
4 Urology Division, Surgery Department, Faculty of Medicine Universitas Udayana - Sanglah Hospital, Bali, Indonesia.
*Corresponding author: andre.tjie.wijaya@gmail.com.
ABSTRACT
Aim: Assessed the correlation between prostate volume and intravesical prostatic protrusion with detrusor wall thickness through transabdominal sonographic examination of benign prostate enlargement (BPE). Methods: The study is a paired-group analytical observational cross-sectional study during April – July 2020. Measurements were made of prostate volume, intravesical prostatic protrusion, and detrusor wall thickness using transabdominal sonography. An analysis was carried out to determine the correlation with bivariate analysis and the calculation of the research power. Results: Thirty-four BPE patients with a mean age of 62.41 years were included in the study. The mean value of prostate volume obtained was 44.24 cc; 8.66 mm for intravesical prostatic protrusion; and detrusor wall thickness is 1.49 mm. The correlation value between prostate volume and detrusor wall thickness was 0.12 (p=0.46), while the intravesical prostatic protrusion and detrusor wall thickness were 0.37 (p=0.03). The research power for correlating prostate volume with detrusor wall thickness and intravesical prostatic protrusion with detrusor wall thickness was 10-20% and 50-60%, respectively. Conclusion: There is a very weak correlation between prostate volume and detrusor wall thickness and a weak correlation between the intravesical prostatic protrusion and detrusor wall thickness. Other variables may influence the thickness of the detrusor wall.
Keywords: benign prostate enlargement, detrusor wall thickness, intravesical prostatic protrusion, prostate volume.
DOI: https://doi.org/10.24843/JBN.2022.v06.i02.p03
INTRODUCTION
Longer human life expectancy results in an increase in degenerative diseases, one of which is benign prostate enlargement (BPE). The prevalence of BPE is estimated to increase in the next few decades. According to Biro Pusat Statistik, in Indonesia, the population older than 65 will increase up to 10.6% in 2035 (doubling up compared to 2010) (BPS 2013).1 Meanwhile, 50% of men have prostate hyperplasia pathologically.2-4 In untreated,
BPE could result in complications such as urine retention to kidney failure. BPE also affects the quality of life of the patients.4
Chronic bladder obstruction will result in structural changes such as thickening of the detrusor wall.5-8 Assessment of bladder outlet obstruction (BOO) in sonography should include static (prostate volume (PV), intravesical prostatic protrusion (IPP)), and dynamic (detrusor wall thickness (DWT)) components.9 However, the common practice
50 | JBN (Jurnal Bedah Nasional)
of sonographic reporting of BPE generally only includes PV. The study aimed to assess the correlation between prostate volume and intravesical prostatic protrusion with detrusor wall thickness through transabdominal sonographic examination of BPE.
METHODS
The study is an analytical observational with a cross-sectional study design. The study has received institutional ethical clearance.
The study sample is male patients who met the inclusion criteria, BPE patients, and age equal to or older than 50 years old. Patients with a score of International Prostate Symptom Score (IPSS) equal to or more than eight and a prostate volume of more than 20 ml were categorized as BPE. Exclusion criteria including Patients with a history of bladder surgery, bladder stone, prostatic cancer, pelvic trauma, or diabetes mellitus.
The study measured PV, IPP, and DWT. All measurements were done using transabdominal ultrasonography (Logiq P7; GE Healthcare, United States). Before the measurements, the bladder should be distended (at least 200 ml in volume). PV was measured using an automated sonography tool using craniocaudal, transverse, and anteroposterior distance (Figure 1).
IPP is the vertical distance from the edge of protruded prostate to the bladder wall (Figure 2). IPP measurements categorized into grade 1 (< 5 mm), grade 2 (5-10 mm), and grade 3 (> 10 mm). DWT is the distance between the inner and outer detrusor muscle (hypoechoic band between hyperechoic lines). Measurement of DWT was done on three different spots with an interval of 1.0 cm, and the mean value was recorded (Figure 3). PV and IPP measurements were done using a curvilinear transducer; meanwhile linear transducer was used to measure DWT.
Statistical analysis was done using Statistical Package for the Social Science (SPSS) 20.0. A p-value of < 0.025 was used as a threshold for significance where relevant.
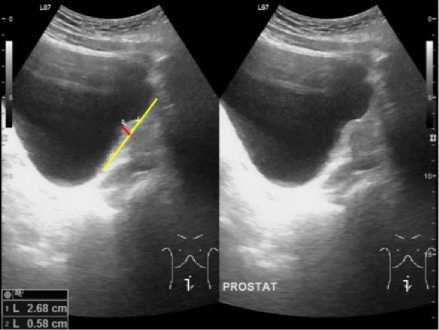
Figure 2. Intravesical prostatic protrusion (red line) measurement with transabdominal ultrasonography on a longitudinal plane. The yellow line shows the base of the bladder.
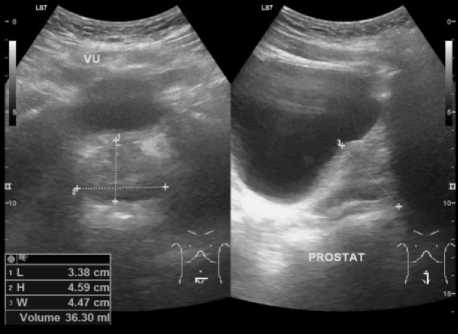
Figure 1. Prostate volume calculation with transabdominal ultrasonography on transverse and longitudinal plane.
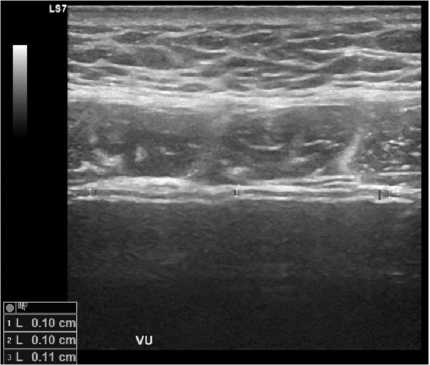
Figure 3. The red line shows detrusor wall thickness on a transverse plane of transabdominal ultrasonography. VU: vesica urinaria.
RESULTS
A total of 34 samples were included in the study. Demographic characteristics and measurement results are summarized in Table 1. Correlation between PV and IPP with DWT was analyzed using the Spearman test. The p-value for PV and DWT was 0.46. For IPP and DWT, the p-value was 0.03. Besides p-value, the study also assessed r-value and research power. The results are shown in Table 2. Figure 4 and Figure 5 represent scatterplot graphs for PV and IPP with DWT.
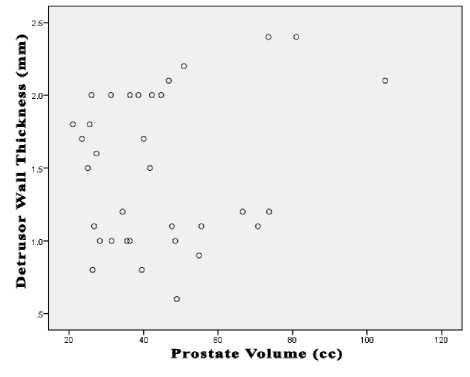
Figure 4. Scatterplot graph of PV and DWT.
Table 1. Characteristics of The Study Subjects
|
Variable |
Total (n = 34) | |
|
Age (year)a |
62.41 ± 8.34 | |
|
IPSS scorea |
16.74 ± 6.29 | |
|
IPSS score categoryb | ||
|
Moderate |
21 (61.8%) | |
|
Severe |
13 (38.2%) | |
|
Prostate volume (cc)a |
44.24 ± 19.24 | |
|
Intravesical prostate |
protrusion |
8.66 ± 7.00 |
|
(mm)a | ||
|
Intravesical prostate |
protrusion | |
|
gradeb | ||
|
Grade 1 |
9 (26.5%) | |
|
Grade 2 |
17 (50.0%) | |
|
Grade 3 |
8 (23.5%) | |
|
Detrusor wall thickness (mm)a |
1.49 ± 0.51 | |
aMean ± standard of deviation; bfrequency (%)
Table 2. p-value, r-value, and research power of PV
and IPP with DWT
|
Correlation |
p-value |
rvalue |
Zβ |
Power (1- β) |
|
Prostate volume with detrusor wall thickness |
0.46 |
0.12 |
-1.32 |
10-20% |
|
Intravesical prostatic protrusion with detrusor wall thickness |
0.03 |
0.37 |
0.18 |
50-60% |
.0 10.0 20.0 30.0 40.0
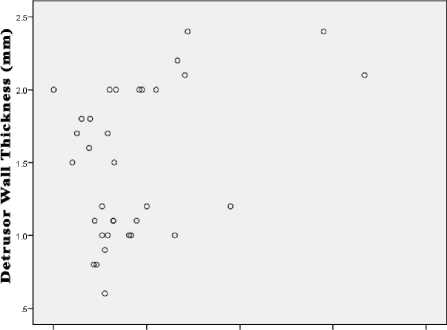
Intravesical Prostatic Protrusion (mm)
Figure 5. Scatterplot graph of IPP and DWT.
DISCUSSION
The research subjects are 34 patients with BPE. The mean value of their age was 62.41 years old. This finding follows the literature that mentioned that most men in their fifth and sixth decade have BPE.10-12
The mean value of PV and IPP was 44.24 ml and 8.66 mm, respectively. Half (50%) of IPP were categorized as IPP grade 2, 26.5% as grade 1, and the rest (23.5%) were grade 3. The mean value for DWT was 1.49 mm.
Bivariate analysis of PV with DWT and IPP with DWT revealed p-value 0.46 and 0.03, respectively. Those two p-values are more than the study threshold (p-value < 0.025), meaning there is no statistical correlation between those variables. The dots
are distributed randomly on the scatterplot graph of PV and DWT, forming no straight line. The same thing was observed in the scatterplot graph of IPP and DWT. The graphs showed no correlation or near-zero correlation.
The r-value of PV and DWT was 0.12, which is a very weak correlation between these two variables. Meanwhile, the r-value of IPP and DWT was slightly larger (0.37). There is a weak correlation between IPP and DWT. The results showed that DWT was probably affected by other variables outside the variable of the study. This result contradicts the literature, stating that BOO is a contributing factor in the thickening of detrusor walls.8,13-15
Research power for PV and DWT was 1020%; meanwhile, power for IPP and DWT was 50-60%. The value of the powers shows type II error (false-negative) is probable of 8090% for PV with DWT and 40-50% for IPP with DWT.
The authors tried to analyze the causeeffect between PV and IPP with DWT based on Bradford Hill criteria. The r-value of the study is similar to other studies: 0.107-0.549 for PV with DWT5,16 and 0.427 for IPP with DWT.16 There is a significant difference statistically (coherence). The study shows no significant correlation; however, other studies showed correlations significantly.5,16 Based on the scatterplot graphs, the biological dose criteria were not fulfilled. The literature has explained biologically plausible and temporal relationships between BOO and DWT.8,13-15 These differences between the study and previous studies show a lack of consistency. However, it should be proved in further researches.
The study has limitations, especially in the size of the samples. The small size of the samples affects the research power. Unfortunately, the study was conducted during the beginning phase of the COVID-19
pandemic, where large-scale social restrictions significantly reduced patients’ hospital visits.
CONCLUSION
The preliminary study shows there is no correlation between PV with DWT and IPP with DWT. Further researches are needed to study the correlation, evaluate, and standardized sonography report in BPE cases.
DISCLOSURE
There was no commercial financial support for this study. No financial disclosures or conflict of interest on behalf of the authors.
REFERENCES
-
1. Badan Perencanaan Pembangunan Nasional. Proyeksi penduduk Indonesia 2010-2035. Jakarta: Badan Pusat Statistik; 2013.
-
2. Vuichoud C, Loughlin KR. Benign prostatic hyperplasia: epidemiology,
economics and evaluation. Can J Urol. 2015;22(Suppl 1):1-6.
-
3. Zhang W, Zhang X, Li H, et al. Prevalence of lower urinary tract symptoms suggestive of benign prostatic hyperplasia (LUTS/BPH) in China: results from the China Health and Retirement Longitudinal Study. BMJ Open. 2019;9:e022792.
-
4. Lee SWH, Chan EMC, Lai YK. The global burden of lower urinary tract symptoms suggestive of benign prostatic hyperplasia: a systemic review and meta-analysis. Sci Rep. 2017;7:7984.
-
5. Güzel Ö, Aslan Y, Balcı M, et al. Can bladder wall thickness measurement use for detecting bladder outlet obstruction? Urology. 2015;86:439-44.
-
6. Oelke M, Höfner K, Jonas U, et al. Diagnostic accuracy of noninvasive tests to evaluate bladder outlet obstruction in men: detrusor wall thickness,
uroflowmetry, postvoid residual urine, and prostate volume. Eur Urol. 2007;52:827-34.
-
7. Bright E, Oelke M, Tubaro A, et al. Ultrasound estimated bladder weight and measurement of bladder wall thicknessuseful noninvasive methods for assessing the lower urinary tract? J Urol. 2010;184:1847-54.
-
8. Oelke M, Höfner K, Wiese B, et al. Increase in detrusor wall thickness indicates bladder outlet obstruction (BOO) in men. World J Urol. 2002;19:443-52.
-
9. Oka AAG, Haryanto G, Duarsa GWK. Akurasi pemeriksaan intravesical prostatitic protrusion (IPP) dengan transabdominal ultrasonography (TAUS) untuk menilai bladder outlet obstruction (BOO) pada penderita pembesaran prostat jinak (PPJ). Medicina. 2007;38:26-30.
-
10. Gandhi J, Weissbart SJ, Kim AN, et al. Clinical considerations for intravesical prostatic protrusion in the evaluation and management of bladder outlet obstruction secondary to benign prostatic hyperplasia. Curr Urol. 2018;12:6-12.
-
11. Rosadi BA, Mahadewa TGB, Duarsa GWK. Multiplex polymerase chain reaction in detecting etiological causes of bacterial prostatitis associated benign
prostatic hyperplasia. Bali Med J. 2016;4:44-7.
-
12. Duarsa GWK, Lesmana R, Mahadewa TGB. High serum prostate specific antigen as a risk factor for moderate-severe prostate inflammation in patient with benign prostatic hyperplasia. Bali Med J. 2016;4:148-51.
-
13. Oelke M, Hofner K, Jonas U, et al. Ultrasound measurement of detrusor wall thickness in healty adults. Neurourol Urodyn. 2006;25:308-17.
-
14. Tokgoz O, Tokgoz H, Unal I, et al. Diagnostic values of detrusor wall thickness, postvoid residual urine, and prostate volume to evaluate lower urinary tract symptoms in men. Diagn Interv Radiol. 2012;18:277-81.
-
15. Banakhar MA, Al-Shaiji TF, Hassouna MM. Pathophysiology of overactive bladder. Int Urogynecol J. 2012;23:975-82.
-
16. Franco G, De Nunzio C, Leonardo C, et al. Ultrasound assessment of intravesical prostatic protrusion and detrusor wall thickness-new standards for noninvqasice bladder outlet obstruction diagnosis? J Urol. 2010;183:2270-4.
54
Discussion and feedback