Factors Influencing Tourists Revisit to Bali as Mice Destination
on
E-Journal of Tourism Vol.1. No.1. (2014): 1-11
Factors Influencing Tourists Revisit to Bali as Mice Destination
Ni Made Eka Mahadewi, I Komang Gede Bendesa and Made Antara
School of Postgraduate Study
Doctorate Degree in Tourism Udayana University
Coressponding author: eka.mahadewi@gmail.com
ARTICLE INFO ABSTRACT
|
Received 20 November 2013 Accepted 28 February 2014 Available online 10 March 2014 |
Plan to revisit of MICE tourists has been highlighted as an important research topic in competitive market of tourism destinations especially in MICE Destination. Despite the considerable number of research on MICE tourists, it remains unclear why MICE tourists undertake to plan their repeated visits and what kind of indicators influenced. This research aims to identify factors influencing MICE tourists to revisit to Bali, Indonesia. By using SEM (Structural Equation Model), one of the results of this study indicated that MICE Destination’s attribute, Promotion, Satisfaction and Image were the important factor to affect Revisit of MICE tourists to come again or revisit to Bali as MICE Destination. Concerning with MICE tourists perception on revisit; tourist visit to Bali for MICE destination can be enhanced by promotion through image of Bali. |
Keywords: revisit, MICE destination, Bali tourism, Structural Equation Modeling (SEM)
Introduction
Background
MICE is an acronym of the Meeting, Incentive, Conference and Exhibition. Monge and Brandimarte (2011) states that MICE is an acronym for Meetings, Incentives,
Conferences, and Exhibitions; sometimes, the 'E' is associated with Events and the 'C' with Conventions. In Indonesia MICE activity is defined as tourism businesses holding meetings, incentive travel, conferences and exhibitions. MICE tourism is an industry that is growing significantly throughout the year. MICE industry involves various other tourism sectors such as accommodation, food and beverage industries, catering, convention services, convention facilities provider, transportation, tourism, retail and entertainment. MICE industry capable as economic contributors to the destination image is both regionally and nationally.
Bali is one of the leading tourist destinations in the world. Bali is still the icon of Indonesian tourism up to the present. Bali is again crowned as the best tourist destination (Island Destination of the Year) in the event China Travel & Meeting Industry Awards 2013. This award is regarded as one of the forms of recognition by the international community to Bali which has successfully managed tourism industry and MICE (meetings, incentives, conference and exhibition) in excellent world-class. MICE needs to be always developed, because (1) MICE business market is a market that is not easily affected by fluctuations than leisure tourism; (2) MICE Tourists are generally classified into 'quality tourists' who tend to stay longer and spend more money than regular travelers, (3) MICE travelers spending is 7 times more than ordinary travelers; (4) Related to the effects of globalization, the competition of MICE business has shifted from competition amongst firms becomes competition amongst destinations (Govers and Go, 2003).
In relation to Bali as a MICE destination, within a period of 6 years from 2008-2013, it was recorded that MICE activities were only 3,85 % in 2008 with a ratio of the number of tourists both foreign and domestic, and the number of tourists visiting Bali attending MICE activities was about 2,20 % tourists in the year 2009, about 3,34 % tourists in 2010, about 1,73 % in 2011, about 4,20% in 2012 and 3,12% in 2013. Referring to Bali as one of the leading tourist destinations in the world, Bali is still a national tourism icon until now. With various unique cultural attractions plus the nature which is still beautiful and the service provided, Bali is able to attract tourists to visit. The activities of MICE in Bali, within the last ten years have increased in term of the number of participants. The MICE activities in Bali are dominated by events Meetings and Conference. For Incentive and Exhibition activity has not increased in term of activities. The Objective of the research is to identify factors influencing MICE tourists to revisit to Bali, Indonesia.
Literature Review
Tourism scholars have concentrated on repeat visitation as an antecedent of destination loyalty. Some empirical studies have acknowledged that many tourist destinations rely seriously on repeat visitors or revisit (Woodside and Lysonski, 1989; Getz, 1991; Oppermann and Chon, 1997; Gunn and Var, 2002; Correia, Oom do Valle and Moço, 2007; Yol Lee and Rhee, 2007; Kim et al., 2011; Lam et al., 2011; Monge and Brandimarte, 2011; Som and Badarneh, 2011). Travel motivation between theory and practice showed that managers could drive more travelers to know the internal psychological needs when designing services/products. While Crompton (1979) states that motivation is a critical factor trip and the driving force behind the tourist behavior. Regarding the relation of decision making process of MICE tourists, here are the theory concept in MICE destination, satisfaction, promotion, image, revisit, planning and policy for MICE.
-
a. Attributes MICE Destinations
Attributes in the visual meaning of word is the synonym of nature, signs, identification,
uniqueness, emblem and explanatory. While destination pursuant to the Tourism Law No. 9/2010, Article 1 stated as a tourism destination area, hereinafter is referred to as Tourism Destinations is a geographic region that is within one or more administrative regions in which there is a tourist attraction, public facilities, tourism facilities, accessibility, and interrelated society and complementary to the realization of tourism. MICE is an acronym of Meeting, Incentive, Conference, and Exhibition. In tourism, a place can be said as a MICE destination if it has a determinant indicator of MICE Destinations. Getz (1991), in his book "Festivals, Special Events and Tourism", provides an overview of event Tourism seen from the supply point of view. There are 7 (seven) elements existing within a MICE tourism destination; the elements are: 1) infrastructure, 2) accommodation, 3) transportation, 4) attractions, 5) catering, 6) retailers, 7) recreational or entertainment facilities. These elements distinguish MICE destination from tourist destinations as expressed by Cooper. According to Cooper et al. (2000), a tourism destination consists of attraction factors, accessibility, amenities (facilities), ancillary services; or often called as 4 A.
-
b. Promotions
According to Gunn and Var (2002), promotion in tourism planning activities includes in the dominant category if compared with physical development. Promotion is an important component and has strong linkages between components in destination planning. Tourism promotion is a major policy which covers the activities of national, provincial, regional, local development, business and tourism. There are four components of tourism promotion activities, namely: advertising, publicity, public relations and incentives. While Schmoll (1977) mentions three types of tourism promotion called as advertising, sales support, public relations. Weaver and Lawton (2006) proposed six factors of destination promotion, among others, Presentation, Personal Selling, Sales Promotion, Publicity, Merchandising, Advertising. In this research, the theory of Gunn and Var (2002) consisting of Advertising, Publicity, Public Relations, Incentives is dominantly applied.
-
c. Satisfaction
Tourist satisfaction is part of consumer behavior. According to Schiffman and Kanuk (2004) satisfaction is a part of the field of consumer behavior. Satisfaction factor is influenced by the presence of a factor of visited destinations, activities at tourist destinations, modes of transport, food, accommodation, attractions, shopping and tourist locations. Satisfaction will lead to a desire to perform future travelling (Woodside and Lysonski, 1989).
Satisfaction is a person's feeling of pleasure or disappointment emerging after comparing the performance (results) of products thought with the expected performance (or outcome). If the performance is below expectations, the customer is not satisfied. If the performance meets his/her expectations, the customer is satisfied. If performance exceeds expectations, the customer is very satisfied and happy (Kotler, 2006).
Tourist satisfaction can be measured by how many travelers’ expectations are met. If tourists get they expect, it is said that they have reached their satisfaction. One way to measure tourist satisfaction is through customer satisfaction survey. Customer satisfaction surveys can be done by phone or mail. Through a survey, a destination can develop its products. The survey is conducted to obtain feedback directly from customers and at the same time to provide positive inputs for a destination.
-
d. Image
The synonyms of image is pictures, figure, portrait that many people have about personal, company, organization, or products. Schiffman & Kanuk (2008) stated the image as part of behavior of an individual (self-image). Image in various tourism researches have been carried out by Opperman & Chan (1997) in which the image is one of the main factors determining the convention participation in the decision making process. Lertputtarak (2011) and Som and Badarneh (2011), are the researchers revealing the existence of image in tourist destinations, either for leisure or business.
-
e. Decision Making of Revisit
The decision making to visit back or revisit is part of consumer behavior. Decision making was revealed by Schiffman and Kanuk (2004), where decision-making was considered as a system consisting of input, process and output. The decision-making model by Suryani (2013), emphasized that Consumer and Environmental affect decisionmaking. Five-stage model of decision-making by Kotler (2006) consists of 1) introduction to the problem, 2) information search, 3) Alternative Evaluation, 4) The decision to buy, 5) post-purchase behavior. And the sequence of decision-making is based on its sequence comprising of Total Collection, Awareness Collection, Consideration Collection, Options Collection, and Decision. Kotler and Keller (2012) divided the decision making based on 4 factors, namely: culture, social, personal and psychology.
Revisit is a return visit. A return visit is determined by the decision-making factors. There are 5 key aspects of decision making, namely: 1) Decision Making Based on Intuition; 2) Rational Decision Making; 3) Fact-Based Decision Making; 4) Decision Making Based on experience; 5) Decision Making Based on the Authority.
-
f. MICE Policy
What is meant by MICE policy in this research is the implementation of government policies which support MICE activities in Bali. MICE policies involving government, provide effect to MICE tourist visit to come to Bali. The government policies which may support the growth of MICE in Bali are the opening of airport and sea port that can bring MICE travelers; support in the form of organizing visa on board; facilitation of visas for certain countries to attend MICE activities; security and comfort support for MICE participants; ease of maintenance of luggage for the exhibition. Various effects of MICE Policy to revisit is revealed by Hall (2000). Research and studies they do indicate that the policy of the government, associations and community involvement affect the tourist traffic to the destination.
-
g. MICE Planning
MICE Planning as referred to in this research is the planning of tourists to revisit and attend MICE activities in Bali. Tourists who have visited Bali are given the opportunity to provide feedback and input; whether they wish to come back to Bali in the next MICE visit. The results of the study and research in terms of planning concepts related to MICE conducted by Oppermann and Chon (1997) which revealed that past experiences may affect the revisit. Gunn and Var (2002) showed tourist travelling planning affects the visit to a destination. Woodside and Lysonski (1989) gave a positive and significant impact on the relationship between the decision to visit a destination.
Overall, this study include marketing research of theories, concepts and strategies. Studied the image 3 tourist attractions in Europe, namely Italy, France and Morocco as a tourist destination. In these studies revealed that the image plays an important role in bringing about the destinations for tourist visits. Woodside and Lysonski (1989) mentions that the image influence a person's decision to determine the decisions and choices. To compare the three destinations, the researchers used 17 factors that poured into the questionnaires addressed to students who are studying in Italy, France and Morocco. Rating destinations with 17 factors assessed include: luxury (luxury); modern; infrastructure; night life/entertainment; the beauty of the city; reputation of the city; sports activities occasion; favorable weather; local residents were able to speak English; the history; price/good value; a place to relax; friendly society; exotic atmosphere; economical; gastronomic; adventure tourism. The use of the image affect a person's decision to determine the decisions and choices are used as a reference to determine the influence of factors in the study. All of the concepts used shown on Tabel 1 and Figure 1.
The model is adopted from Parasuraman, Zeithaml and Berry (1985); Mill and Morrison (1985); Getz (1991); Oppermann and Chon (1997); Buhalis (2000); Cooper et al. (2000); Kotler (2000); Gunn and Var (2002); Schiffman and Kanuk (2004); Leiper (2004); Swarbrooke and Susan (2007); Wagen (2007);
Goldblatt (2008); Hall (2008).
-
a. Model of Tourism System Approach
MICE tourism businesses in tourism is part of artificial attraction (manmade attraction). The venue of holding MICE as the selected destination is part of the research. Figure Conceptual Framework is a research model with tourism approach.
-
Table 1. Theoretical Model
Construct
-
1. Exogenous Construct:
-
a) Attribute MICE Destination
Dimension
-
a. Bali as MICE Destination (XI. I)
-
b. Meeting Facilities (XI .2)
-
c. Hotel with MICE facilities (XI .3)
-
d. Accessibilities (XI.4)
-
e. Event with its entertainment (XI. 5)
-
f. Infrastructure (XI.6)
-
g. Airp oιt Facilitjr (XI .7)
-
a. Publication (X2.1)
-
b. Incentive (X2.2)
-
c. FriendRelatives 'X2.3)
-
d. Word ofMouth (X2.4)
-
e. Advertising
-
a. Competitive Price (X3.1)
-
b. Ground Handling (X3.2)
-
c. Security Standard (X3.3)
-
d. Food & Beverage Standard (X3.4)
-
e. Information services (X3.5)
b) Promotion
c) Satisfaction
d) MICEPlannins Plan to revisit Bali for MICE X4)
e) MICEPolicy PolicyforMlCEBusiness(XS)
2. Endosenous Construct
⅛⅛Is⅛s⅞
a.
Baliis safe(Yl.l)
b.
Baliisclean(YLT)
C.
Easy public transport (Yl3)
d.
Professional staffs (Y1.4)
⅛λA^^j⅞it
a.
Frequenfvcometo Baliformamr times (Y2.1)
b.
Decide to cho ose Bali with your friend relatives (Y2.2)
c.
Opp ortuniħr rκisit Bali in the future (Y13) '
d.
Will revisit Bali with your family ⅛nd⅛⅛y⅛^
-
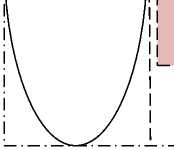
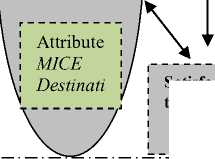
The conceptual framework of the research model is an abstraction and synthesis of theories and research problems. This research refers to the concepts and theories which are aimed to determine the effect of MICE destination attributes, promotion and satisfaction to image and revisit of MICE travelers to Bali. This model is expected to be able to answer the problems revealed previously. Below is illustrated an overview of the research to be conducted with the approach of writing research, conceptual framework and research model (Figure 1).
Research Area
Policy for MICE
Planning for MICE
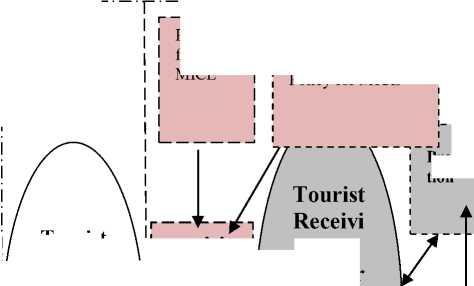
revisit
ng Countr ies
Promo tion
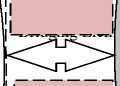
image I
Tourist
Genera ting Countr ies
Satisfac tion
1
Figure 1. Conceptual Framework – Research Model
The model is adapted from Parasuraman, Zeithaml and Berry (1985); Mill and Morrison (1985); Getz (1991); Oppermann and Chon (1997); Buhalis (2000); Cooper et al. (2000); Kotler (2000); Gunn and Var (2002); Schiffman and Kanuk (2004); Leiper (2004); Swarbrooke and Susan (2007); Wagen (2007); Goldblatt (2008); Hall (2008).
Hypotheses
To compare the influence of MICE destination attribute, satisfaction, promotion, MICE policy, MICE planning to image and revisit; the following hypothesis were examined:
H1: There is a positive influence of
attributes MICE destinations to image
H2: There is a positive influence of the
promotion to the image
H3: There is a positive influence of the
image to satisfaction
H4: There is a positive influence of the
MICE destination attribute to revisit decision making
H5: There is a positive influence of
promotion to revisit decision-making
H6: There is a positive influence of the
satisfaction to revisit decision making
H7: There is a positive influence of the
plan to visit Bali MICE destination to revisit decision making
H8: There is a positive influence of the
MICE business policy to revisit decision making
H9: There is a positive influence of image
to revisit decision making
H10: There is a total effect MICE
destination attributes, promotion and satisfaction to revisit decision making through the image.
Methodology
A self administered survey
questionnaire was developed to identify factors influencing MICE tourits’ revisit to Bali. The research was conducted in three (3) largest venues in Bali. In this study, respondents used are MICE participants. The questionnaires were distributed at two meeting venues, namely at the Bali International Convention Center (BICC) and Grand Hyatt Hotel Nusa Dua. 189 questionnaires were collected.
Results and Discussion
The biggest number of respondents came from Asian countries about 84 persons (44.4 %); the countries in American territories about 39 persons (20.6 %); Australian countries about 57 persons (30.2 %); European countries about 9 persons (4.8 %). For the age of respondents who were pleased to participate in this research ranged 41- 50 year about 50.8 %. For the age of older than 50 years occupied the second position with the number of 86 persons or about 45.5 %, and the age category of 30-40 years was about 7 persons or 3.7 %. The description of respondents is illustrated in Table 2.
Table 2. Respondent Description
|
No. |
Classification |
Criteria |
Total |
% |
|
1. |
Group |
a. Asia |
84 |
44 |
|
Country |
b. Australia |
57 |
,4 | |
|
c. America |
39 |
30 | ||
|
d.Europe |
9 |
,2 | ||
|
20 | ||||
|
,6 | ||||
|
4, | ||||
|
8 | ||||
|
2 |
Age |
a. 30-40 years |
7 |
3, |
|
b. 41-50 years |
96 |
7 | ||
|
c. > 50 years |
86 |
50 | ||
|
,8 | ||||
|
45 | ||||
|
,5 | ||||
|
3. |
Job |
a. Government |
48 |
25 |
|
b. Business |
89 |
,4 | ||
|
c. Professional |
48 |
47 | ||
|
,1 | ||||
|
25 | ||||
|
,4 | ||||
|
4. |
Length of |
a. 1-3 days |
7 |
3, |
|
Stay |
b. 4-6 days |
112 |
7 | |
|
c. 7-9 days |
70 |
59 | ||
|
,3 | ||||
|
37 | ||||
|
,0 | ||||
|
5. |
Expenditure |
a. < USD |
7 |
3, |
|
1000 |
125 |
7 | ||
|
b. USD 1000- |
57 |
66 | ||
|
3000 |
,1 | |||
|
c. > USD |
30 | |||
|
3000 |
,2 | |||
|
Source: Processed Data (2014) | ||||
The variables observed in this research include 5 latent variable (unobservable variable), namely MICE Destination (X1), promotion (X2), convention tourist satisfaction (X3), image (Y1) and decision making to visit back/revisit (Y2), and 2 (two observable variable), namely, the plan to visit Bali for MICE purpose (X4), and MICE business policy (X5). After all validity and reliability tests were conducted in each latent variable, some prerequisite to be complied in structural modeling are the assumption of normal multivariate, the assumption of no multikolinearitas or singularity and outlier. Having tested the validity and reliability of all latent variables of which results are valid and reliable, the data are not normal multivariate, no multicollinearity and outlier occur below 5 percents, then the latent variables can be continued in the analysis in the form of a path diagram presented as follows. We look for the
effects of MICE Destination (X1), promotion (X2), convention tourist satisfaction (X3), Bali as MICE Destination (X4), and MICE Business Policy (X5) to the decision-making to revisit (Y2) through image (Y1)(Figure 2).
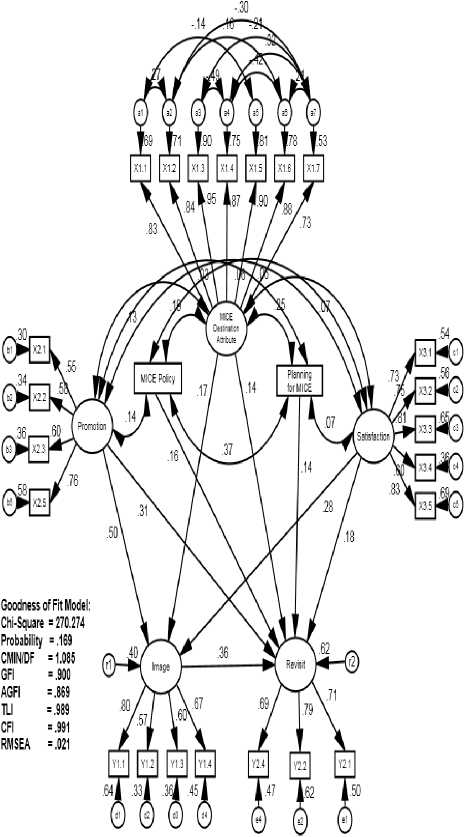
Figure 2. Attribute of MICE Destination (X1), Promotion (X2), MICE Tourist Satisfaction (X3), Planning for MICE Destination (X4), and MICE Business Policy (X5) to decision-making to revisit (Y2) through image (Y1)The test results of the above complete model by the application of AMOS program can be completely seen in the following Table 3:
Table 3. The Result of Test for Decision Making Model to Revisit (Y2) through Image (Y1)
|
Criteria |
Cut-Off Value |
Result of Calculation |
Remarks |
|
Chi – Square |
Expected to be small |
269,690 |
χ2 with df = 424 is 473,009 Good |
|
Significance Probability |
≥ 0,05 |
0,124 |
Good |
|
RMSEA |
≤ 0,08 |
0,024 |
Good |
|
GFI |
≥ 0,90 |
0,900 |
Good |
|
AGFI |
≥ 0,90 |
0,866 |
Quite Good |
|
CMIN/DF |
≤ 2,00 |
1,105 |
Good |
|
TLI |
≥ 0,90 |
0,987 |
Good |
|
CFI |
≥ 0,90 |
0,989 |
Good |
The Table 3 shows that 8 (eight) criteria used to assess the worth/not of a model reveals the remarks of Good and Quite Good. It can be said that the model is acceptable, meaning that there is compliance between the model and data.
Of the compliance model, each path coefficient can be interpreted. The coefficients of this path are hypothesized in this research, which can be presented in the following structural equation:
Y1 = 0,151 X1 + 0,505 X2 + 0,282 X3
Y2 = 0,147 X1 + 0,312 X2 + 0,180X3 + 0,142 X4 + 0,165 X5 + 0,366 Y1
Where,
X1 = Attribute of MICE Destination
X2 = Promotion
X3 = MICE Tourist Satisfaction
X4 = Planning for MICE Destination
X5 = MICE Business Policy
-
Y1 = Image
-
Y2 = Decision-Making to Revisit
Path coefisient test in Figure 2 and the equation above are presented in detail in the following Table 4:
Tabel 4. The Result of Test on Model Compliance pf Decision-Making to Revisit (Y2)
|
Variable |
Coefi sient |
C.R. |
Prob. |
Remarks |
|
MICE Destination (X1)÷ image (Y1) |
0.151 |
2.073 |
0.038 |
Significant |
|
Promotion (X2) ÷ image (Y1) |
0.505 |
4.802 |
0.000 |
Significant |
|
Convention tourist satisfaction (X3)÷ image (Y1) |
0.282 |
3.491 |
0.000 |
Significant |
|
MICE Destination (X1)÷ DecisionMaking to Revisit (Y2) |
0.147 |
2.181 |
0.029 |
Significant |
|
Promotion (X2)÷ Decision-Making to Revisit (Y2) |
0.312 |
2.949 |
0.003 |
Significant |
|
Convention Tourist Satisfaction (X3)÷ Decision Making to Revisit (Y2) |
0.180 |
2.362 |
0.018 |
Significant |
|
Plan to Visit Bali for MICE (X4)÷ Decision-Making to revisit (Y2) |
0.142 |
2.051 |
0.040 |
Significant |
|
MICE Business Policy (X5)÷ Decision-Making to revisit (Y2) |
0.165 |
2.377 |
0.017 |
Significant |
|
image (Y1)÷ decision-making to revisit (Y2) |
0.366 |
3.348 |
0.000 |
Significant |
Source: Processed Data (2014)
Based on The Tabel 4, the interpretation to each path coeficient are as follows:
-
1) Attributes of MICE Destinations (X1) has a positive effect and significant on the image (Y1). It can be seen from the path coefficient with positive sign in the value of 0.151 with CR of 2,073 and significance probability (p) of 0.038 which is smaller than significant level (α) which has been set at 0.05. Thus MICE Destinations (X1) directly affect the image (Y1) of 0.151.
-
2) Promotion (X2) has a positive effect and significant on the image (Y1). It can be seen from the path coefficient with positive sign in the value of 0.505 with CR of 4.802 and significance probability (p) of 0.000 which is smaller than significant level (α) which has been set at 0.05. Thus promotion (X2) directly affects the image (Y1) of 0.505.
-
3) MICE tourist satisfaction (X3) has a positive effect and significant on the image (Y1). It can be seen from the path coefficient with positive sign in the value of 0.282 with CR of 3,491 and significance probability (p) of 0.000 which is smaller than significant level (α) which has been set at 0.05. Thus the convention tourist satisfaction (X3) directly affects the image (Y1) of 0.282.
-
4) Attributes of MICE Destinations (X1) has a positive effect and significant on decision making to return/revisit (Y2). It can be seen from the path coefficient with positive sign in the value of 0.147 with CR of 2,181 and significance probability (p) of 0.029 which is smaller than significant level (α) which has been set at 0.05. Thus MICE Destinations (X1) directly affects the decision-making to visit back/revisit (Y2) of 0.147.
-
5) Promotion (X2) has a positive effect and significant on decision making to return/revisit (Y2). It can be seen from the path coefficient with positive sign in the value of 0.312 with a value of CR of 2.949 and significance probability (p) of 0.003 which is smaller than significant level (α) which has been set at 0.05. Thus
promotion (X2) directly affects the
decision-making to visit back/ revisit (Y2) of 0312.
-
6) MICE tourist satisfaction (X3) has a positive effect and significant on decision making to return/revisit (Y2). It can be seen from the path coefficient with positive sign in the value of 0.180 with a value of CR of 2,362 and significance probability (p) of 0.018 which is smaller than significant level (α) which has been set at 0.05. Thus the convention tourist satisfaction (X3) directly affects the decision-making to revisit (Y2) of 0.180.
-
7) MICE Planning or plan to visit Bali for MICE destination (X4) has a positive effect and significant on decision making to return/revisit (Y2). It can be seen from the path coefficient with positive sign in the value of 0.142 with a value of CR of 2,051 and significance probability (p) of 0.040 which is smaller than significant level (α) which has been set at 0.05. Thus, plan to visit Bali for MICE destination (X4)
directly affects the decision making to return/revisit (Y2) of 0.142.
-
8) MICE business policy (X5) has a positive effect and significant on decision making to return/revisit (Y2). It can be seen from the path coefficient with positive sign in the value of 0.165 with a value of CR of 2,377 and significance probability (p) of 0.017 which is smaller than significant level (α) which has been set at 0.05. Thus, MICE business policy (X5) directly affects the decision making to revisit (Y2) of 0.165.
-
9) Image (Y1) has a positive effect and significant on decision making to return/revisit (Y2). It can be seen from the path coefficient with positive sign in the value of 0.366 with a value of CR of 3,348 and significance probability (p) of 0.000 which is smaller than significant level (α) which has been set at 0.05. Thus, image (Y1) directly affects the decision-making to return/revisit (Y2) of 0.366.
Direct relationship occurs between latent exogenous variables (Attributes of MICE Destinations (X1), Promotion (X2), MICE Tourist Satisfaction (X3) and Plan to Visit Bali for MICE Destination (X4), MICE Business Policy (X5), with latent endogenous intervening variables (Image (Y1)) and latent endogenous variables (decision making to revisit (Y2). Table 5 presents the direct result of direct relationship occurs amongst the variables latent exogenous and endogenous variables:
Table 5. Direct Effect of Research Variables
|
Direct Effect |
Variabel Intervening |
Variabel Endogen | |
|
Image (Y1) |
DecisionMaking to return/revisit (Y2) | ||
|
Attribute of MICE Destination (X1) |
0,151 |
0,147 | |
|
Promotion (X2) |
0,505 |
0,312 | |
|
Exogenous Variabels |
MICE Tourist Satisfaction (X3) |
0,282 |
0,180 |
|
Plan to Visit Bali for MICE (X4) |
0,000 |
0,142 | |
|
MICE Business Policy (X5) |
0,000 |
0,165 | |
|
Intervening |
Image (Y1) |
0,000 |
0,366 |
|
Source: Processed Data (2014) | |||
From the above table, it can be described that the direct effects of latent exogenous variables to latent endogenous variabels is high. X2 provides the highest direct effect to Y1, then Y1 to Y2 and X2 to Y1. Indirect relationship occurs between latent exogenous variables (Attributes of MICE Destinations (X1), Promotion (X2), MICE Tourist Satisfaction (X3) and Plan to Visit Bali for MICE Destination (X4), MICE Business Policy (X5), with latent endogenous intervening variables (Image (Y1)) and latent endogenous variables (decision making to return/revisit (Y2)).
The following Table 6 presents the indirect result of indirect relationship occurs amongst the variables – latent exogenous and endogenous variables:
Table 6. Indirect Effect of Research Variables
|
Variabel Interveni ng |
Variabel Endogen | ||
|
Indirect Effect |
Image (Y1) |
DecisionMaking to return/rev isit (Y2) | |
|
Attribute of MICE Destination (X1) |
0,000 |
0,055 | |
|
Promotion (X2) |
0,000 |
0,185 | |
|
Exogenous Variables |
MICE Tourist Satisfaction (X3) |
0,000 |
0,103 |
|
Plan to Visit Bali for MICE (X4) |
0,000 |
0,000 | |
|
MICE Business Policy (X5) |
0,000 |
0,000 | |
|
Intervening |
Image (Y1) |
0,000 |
0,000 |
|
Source: Processed Data (2014) | |||
From the above table 6, it can be described that the indirect effects of latent exogenous variables to latent endogenous variabels is high. Y1 provides the highest indirect effect on X2 to Y2, then on X3 to Y2.
Total effect constitutes the sum of direct and indirect effect between latent exogenous variables (Attributes of MICE Destinations (X1), Promotion (X2), MICE Tourist Satisfaction (X3) and Plan to Visit Bali for
MICE Destination (X4), MICE Business Policy (X5), with latent endogenous intervening variables (Image (Y1)) and latent endogenous variables (decision making to return/revisit (Y2)).
The following Table 7 presents total result on the direct and indirect result of relationship occurring amongst the variables – latent exogenous and endogenous variables:
Table 7.
Total Effect of Research Variable
|
Variabe l Interven ing |
Variabel Endogen | ||
|
Direct Effect |
Image (Y1) |
Decision -Making to return/re visit (Y2) | |
|
Attribute of MICE Destination (X1) |
0,151 |
0,203 | |
|
Promotion (X2) |
0,505 |
0,496 | |
|
MICE | |||
|
Exogenous Variables |
Tourist Satisfaction (X3) |
0,282 |
0,283 |
|
Plan to Visit Bali for MICE (X4) |
0,000 |
0,142 | |
|
MICE Business Policy (X5) |
0,000 |
0,165 | |
|
Intervening |
Image (Y1) |
0,000 |
0,366 |
Sumber : Processed Data (2014)
From the above table, it can be described that the total effects of latent exogenous variables to latent endogenous variabels is high. X2 provides the highest total effect to Y1, then X2 to Y2 and Y1 to Y2.
Conclusion and Recommendation
Conclusion
Overall, tourists are interested in Bali for leisure purposes. This is shown by the data of tourist arrivals to Bali which are dominated by leisure travelers. MICE tourists coming to Bali
are continuously afforded to be able to revisit. Bali has prepared services, facilities and infrastructure. Various other attempts have been made to increase tourist visits Bali for MICE, namely by continuing to do promotion, service and good image.
The result of research shows that promotion contributes the biggest effect to revisit, both directly as well as indirectly through image. It means that tourist visit to Bali for MICE destination can be enhanced through promotion. Through promotion it is expected that the number of leisure and MICE tourists will be more balanced.
Recommendation
Tourism stakeholder in Indonesia, especially in Bali should improve the promotion through online advertising, and conduct sales promotion to friends and relatives, in cooperation with the tourism industry at home and abroad. Overseas tourism industry in question are the meeting planner, meeting organizer, tour operators, wholesalers and foreign governments target the MICE market. In terms of MICE business, the MICE coordinator or government should improve their relation to Professional Exhibition/Event Organizer (PEO), Professional Convention Organizer (PCO), Sport association (KONI) to create creative sport events, and the hotel industry in becoming MICE tourists.
References
Buhalis, D. (2000) ‘Marketing the competitive destination of the future’, Tourism management. Elsevier, 21(1), pp. 97– 116.
Cooper, C., Fletcher, J., Fyall, A., Gilbert, D. and Wanhill, S. (2000) Turismo: princípios e prática. Bookman.
Correia, A., Oom do Valle, P. and Moço, C. (2007) ‘Why people travel to exotic places’, International Journal of Culture, Tourism and Hospitality Research. Emerald Group Publishing Limited, 1(1), pp. 45–61.
Crompton, J. L. (1979) ‘An assessment of the image of Mexico as a vacation destination and the influence of geographical location upon that image’, Journal of travel research. Sage Publications Sage CA: Thousand Oaks, CA, 17(4), pp. 18–23.
Getz, D. (1991) Festivals, special events, and tourism. Van Nostrand Reinhold.
Goldblatt, J. (2008) Special Events, The Roots And Wings Of Celebration. New York: John Wiley & Sons, Inc.
Govers, R. and Go, F. M. (2003) ‘Deconstructing destination image in the information age’, Information Technology & Tourism. Cognizant Communication Corporation, 6(1), pp. 13–29.
Gunn, C. A. and Var, T. (2002) Tourism planning: Basics, concepts, cases.
Psychology Press.
Hall, C. (2000) Tourism Planning Processes and Relationships. Harlow: Prentice Hall.
Hall, M. C. (2008) Tourism Planning, Policies, Proceeses and Relationshi. Second Edition. England: Prentice Hall.
Kim, J., Hong, S., Min, J. and Lee, H. (2011) ‘Antecedents of application service continuance: A synthesis of
satisfaction and trust’, Expert Systems with Applications. Elsevier, 38(8), pp. 9530–9542.
Kotler, P. (2000) ‘Marketing Management: Millennium Edition’. Pearson Education North Asia Limited.
Kotler, P. (2006) Marketing management services. Jakarta: Four Salemba.
Kotler, P. and Keller, K. L. (2012) Marketing Management. New Jersey: Pearson Education International.
Lam, W. F., Lau, W. T., Ng, M. H. and Shua, H. Y. (2011) ‘The impacts of organizational change towards employees ‘performance in banking industry.’ UTAR.
Leiper, N. (2004) Tourism management. Pearson Education Australia Frenchs Forest.
Lertputtarak, S. (2011) ‘The relationship between destination image, food image, and revisiting Pattaya, Thailand’, Browser Download This Paper.
Mill, R. C. and Morrison, A. M. (1985) ‘The tourism system: An introductory. Engelwood Cliffs’. NJ: Prentice Hall.
Monge, F. and Brandimarte, P. (2011) ‘Mice tourism in piedmont: economic
perspective and quantitative analysis of customer satisfaction’, Tourismos: an international multidisciplinary journal of tourism, 6(1), pp. 213–220.
Oppermann, M. and Chon, K.-S. (1997)
‘Convention participation decisionmaking process’, Annals of tourism Research. Elsevier, 24(1), pp. 178– 191.
Parasuraman, A., Zeithaml, V. A. and Berry, L. L. (1985) ‘A conceptual model of service quality and its implications for future research’, the Journal of Marketing. JSTOR, pp. 41–50.
Schiffman, L. G. and Kanuk, L. L. (2004) ‘Consumer behaviour 8 th ed’, NY: Prentice-Hall Inc.
Som, A. P. M. and Badarneh, M. B. (2011) ‘Tourist satisfaction and repeat
visitation; toward a new
comprehensive model’, International Journal of Human and Social Sciences, 6(1), pp. 38–45.
Suryani, T. (2013) ‘Perilaku Konsumen di Era Internet: Implikasinya pada Strategi Pemasaran’. Graha Ilmu.
Swarbrooke, J. and Susan, H. (2007) Consumer Behavior in Tourism (Second Edition). Oxford: Elsevier Ltd.
Wagen, V. Der (2007) Human Resource Management for Events: Managing the event workforce. Butterworth -Heinemann, Elsevier Ltd.
Woodside, A. G. and Lysonski, S. (1989) ‘A general model of traveler destination choice’, Journal of travel Research. Sage Publications Sage CA: Thousand Oaks, CA, 27(4), pp. 8–14.
Yol Lee, S. and Rhee, S.-K. (2007) ‘The change in corporate environmental strategies: a longitudinal empirical study’, Management Decision. Emerald Group Publishing Limited, 45(2), pp. 196–216.
http://ojs.unud.ac.id/index.php/eot
11
e-ISSN: 2407-392X. p-ISSN: 2541-0857
Discussion and feedback