The Analysis of Determinant Factors of Customer Preferences on Café as a Culinary Tourism Destination in Malang
on
E-Journal of Tourism Vol.9. No.1. (2022): 1-7
The Analysis of Determinant Factors of Customer Preferences on Café as a Culinary Tourism Destination in Malang
Nonny Aji Sunaryo*, Mazarina Devi, Laili Hidayati, Zorayda Nabila Denata, Firlia Wahyu Puspitasari
Universitas Negeri Malang, Indonesia
*Corresponding Author: nonny.sunaryo.ft@um.ac.id
DOI: https://doi.org/10.24922/eot.v9i1.84037
Article Info
Submitted:
December 2nd 2021
Accepted:
March 1st 2022
Published:
March 31th 2022
Abstract
Malang City continues to be optimistic about being one of the cities that makes culinary tourism one of the mainstay trademarks. In culinary tourism, cafes are one of the destinations that tourists usually go to. Currently, the presence of cafes in Malang is growing very rapidly. This study aims to analyze the determinant factors that influence customer preference in choosing a café as a culinary tourism destination, especially in Malang. This research method is quantitative research, in which the survey was conducted through the distribution of questionnaires. The sample of this research was 120 respondents who were selected purposively. The collected data were analyzed using exploratory factor analysis (EFA) techniques. Based on EFA, and it was found that 5 factors determinant (Marketing mix, Psychology, Personal, Attraction Social and Cultural, Personality) of customer preferences on café as a culinary tourism destination in Malang. The statictical results indicated that the factor determinants of customer preferences are related to the selection of cafes as a culinary tourism destination in Malang. The results of this study can be used by tourism stakeholders in Malang City to understand customer preference so that they can develop cafes as destinations of culinary tourism.
Keywords: determinant factor; customer preferences; café; culinary tourism.
INTRODUCTION
Background
Tourism is one of the priority sectors of national development in Indonesia, this is because tourism is considered a leading sector that can move other sectors. The food and beverage service provider business is one of the sectors affected by tourism. Food and beverages for tourists was basic demand and expenditure (Wijayanti et al., 2021). According to (Abdillah and
Wira Diana, 2018) the development of food and beverages bussines in tourism destination has been predicted to be continued, because people nowadays consider that eating and drinking not just basicly needs for them but also became a recreational event that bring happines to them or even can a bring a pride. Enjoying food and drinks becomes a motivation for several tourists, furthermore, that kind of activity is known as culinary tourism (Soeroso and Turgarini, 2020).
Culinary tourism currently become a strong attraction for some tourist. One of the cities that is never deserted from tourists is Malang City, this is because its geographical location in the highlands makes Malang City. In the city of Malang, there are many choices of tourist destinations that are available and offered, one of which is culinary tourism (Setioko, 2019). Along with the rise of the global phenomenon of culinary tourism and considering its potential, Malang City continues to be optimistic about being one of the cities that makes culinary tourism a reliable trademark (Prayogo and Suryawan, 2018). Based on Malang City BPS data, the number of restaurants was recorded at 1,444 (BPS Malang Kota, 2018). The restaurant is located in 5 sub-districts (Kedung Kandang, Breadfruit, Klojen, Blimbing, Lowokwaru) in Malang City. Based on BPS data, the location of most restaurants is in Klojen District, which is a total of 686 places (BPS Malang Kota, 2019).
Café is a form of a restaurant that can be a destination for culinary tourism connoisseurs. According (Rahmawati et al., 2020) cafe operation, affects the economy of the providers. The continuous and increasing demand from tourists allows for improvement and improvement of the provider's economic conditions. Furthermore, providers capture this opportunity, they believe cafe businesses have a big opportunity to generate profits. That could be also one of the reasons rapid growth of cafes presence in Malang City. Contrary, The significant increase in the number of cafes makes the owners obliged to think of strategies so that their business can live and not die due to competition (Tugu, 2019), to make this happen, business owners should know and understand consumer desires and provide products that consumers are interested in.
After understanding consumer desires, the owner can design and implement strategies that can increase consumer http://ojs.unud.ac.id/index.php/eot 2
interest and choose the cafe (Qistiya, Tur-garini and Sudono, 2017). In order to understand consumer wants and solve the gaps, this study was conducted to produce data about the determinants factor of tourist or customer preferences for cafes as culinary tourism destinations. According to (M.Anang Firmansyah, 2019) to find out which products consumers are interested in for the goods or services they consume are to conduct customer research using survey methods. The other reason to conduct this study is that based on a desk study, not many studies have examined café as a culinary tourist attraction. The results of this study can be used by relevant stakeholders as reference material to conduct further research about building, promoting, and preserving culinary tourism, especially in Malang.
RESEARCH METHODS
This research is quantitative research, the data collection tool used is a Likert scale of 1-4, which is a score of 4 indicating strong agreement with the statement. Each statement on the questionnaire represents variables. There are 24 variables in this study. The data obtained, then tabulated and then tested using exploratory factor analysis (EFA), to find factors that can explain the correlation between the independent variables studied. A collection of correlated variables is referred to as a factor, then new hypotheses can be generated from the formed factors (Shrestha, 2021b). In order to conducted factor analysis, a ratio of sample (respondent) versus measured variables is 5:1, furthermore the total of sample size cannot be less than 100 (Fabrigar and Wegener, 2012). Therefore the number of respondents in this study as many as 120 respondents, the sampling technique was purposive, the respondents in this study were the customers of cafés in Malang city. This research location is in Café around Malang City. Data collection is carried out from e-ISSN 2407-392X. p-ISSN 2541-0857
June to November 2021. The object of this study is what is determinant factors of customer preferences on café as a culinary tourism destination.
RESULT AND DISCUSSION
Instrument Validity and Reliability
This study uses a questionnaire as a primary data collection tool, before being distributed validity and reliability testing is carried out through a pilot study of 30 respondents, namely customer cafes in the city of Malang. Validity and reliability testing is important so that the primary data collected is valid so that it can answer research problems, in the context of quantitative research, the right conclusion is always based on the right quantitative research instrument (Budiastuti and Bandur, 2018). Based on validity test r-count of 24 variabel were higher than r-table (<0.361), than can be avowed that each item in this study questionnaire is valid. Futhermore, based on the results of reliability test cor-barch alpa value was 0.916 is higher than 0.70, it means that the instrument can provide consistent score results on each measurement. Thus, the measurement tool (item/question items) still provides consistent measurement results at different times (Bolarinwa, 2015). The value of the reliability test was more than 0.90 which means that this questionnaire was excellent (Budiastuti and Bandur, 2018).
Factor Analysis
Based on the exploratory analysis factor technique, the first step is asses data suitability using KMO and Bartlett's Test. In Table 1, the results of the KMO test can be seen.
Tabel 1. KMO and Bartlett's Test Results
KMO and Bartlett's Test
|
Kaiser-Meyer-Olkin Measure of Sampling Adequacy. |
.861 |
|
Bartlett's Test of Approx. Chi Sphericity Square |
1387.167 |
|
df |
276 |
|
Sig. |
.000 |
The value of KMO is 0.861, which means the sample size in this study is adequate because it is known that the KMO value is >0.50, it is considered feasible to be tested for factor analysis (Shrestha, 2021a). Furthermore, the Bartletts test value is 0.000 <0.050, which means the variable and sample in this study can be tested using factor analysis. The value of MSA results Anti-Image Matrices on the factor analysis are as follows, tangible product (0.758), intangible product (0.833), price (0.827), facility (0.839), attractions (0.874), location (0.890), activity (0.879), culture (0.916), recommendation (0.886), social class (0.874), age (0.826), profession (0.858), economic (0.842), lifestyle (0.838), self-concept (0.887), motivation (0.834), perception (0.858), learning (0.820), believe (0.838), promotion (0.904), image (0.888), environment (0.882), role (0.908), assurance (0.918). Based on the results of the MSA value for each variable is >0.50, then all the research variables can be analyzed further.
The second step of factor analysis is factor extraction using principal components analysis (PCA). Based on the analysis the communalities and total variance explained value was obtained. The communalities extraction value as follows, tangible product (0.590), intangible product (0.690), price (0.528), facility (0.598), attractions (0.568), location (0.473), activity (0.574), culture (0.571), recommendation (0.698), social class (0.675), age (0.603), profession (0.683), economic (0.715), lifestyle (0.772), self-concept (0.733), motivation (0.646), perception (0.625), learning (0.673), believe (0.775), promotion (0.503), image (0.626), environment (0.620), role (0.567), assurance (0.494).
Tabel 2. Total Varience Explained
|
Total Variance Explained | ||||||||
|
Component |
Initial Eigenvalues |
Extraction Sums of Squared Loadings |
Rotation Sums of Squared Loadings | |||||
|
Total |
% Of Variance |
Cumulative % |
Total |
% Of Variance |
Cumulative % |
Total |
% Of Variance | |
|
1 |
8.248 |
34.366 |
34.366 |
8,248 |
34,366 |
34,366 |
3,460 |
14.416 |
|
2 |
2,674 |
11.144 |
45,509 |
2,674 |
11.144 |
45,509 |
3,419 |
14,245 |
|
3 |
1,658 |
6.909 |
52,419 |
1,658 |
6.909 |
52,419 |
3,111 |
12,960 |
|
4 |
1,331 |
5,545 |
57,964 |
1,331 |
5,545 |
57,964 |
3.013 |
12,553 |
|
5 |
1.087 |
4,528 |
62,491 |
1,087 |
4,528 |
62,491 |
1.996 |
8,317 |
|
6 |
0,906 |
4.148 |
66.640 | |||||
|
7 |
0,925 |
3.853 |
70,493 | |||||
|
S |
0.831 |
3,463 |
73,956 | |||||
|
9 |
0,694 |
2.890 |
76,846 | |||||
|
10 |
0,624 |
2.599 |
79,445 | |||||
|
11 |
0,578 |
2,407 |
81.852 | |||||
|
12 |
0,560 |
2,334 |
84,187 | |||||
|
13 |
0.493 |
2,053 |
86,240 | |||||
|
14 |
0,454 |
1,892 |
88.132 | |||||
|
15 |
0,407 |
1.696 |
89.829 | |||||
|
13 |
0,396 |
1,651 |
91,479 | |||||
|
17 |
0,349 |
1,453 |
92,933 | |||||
|
18 |
0.338 |
1.406 |
94.339 | |||||
|
19 |
0.305 |
1,269 |
95,609 | |||||
|
20 |
0.267 |
1,111 |
96.720 | |||||
|
21 |
0,254 |
1.058 |
97,778 | |||||
|
22 |
0,210 |
0.877 |
98,654 | |||||
|
23 |
0,179 |
0,746 |
99.400 | |||||
|
24 |
0,144 |
0.600 |
100.000 | |||||
Extraction Method: Principal ConiponentAnaIysis.
The extraction value is representing varians of the variable (Hogarty et al., 2005), as the example the communalities extraction value of tangible product is 0.590, that means 59.0% varians of variable quantity tangible product can be explained from the formed factors. This interpretation applies to all variables of this study, with a note that the greater the com-munality value of a variable, the closer it is to the formed factor.
Total variance explained can be seen at Table 2, the value of eigenvalues represents each factor variance explained through that specific component which is http://ojs.unud.ac.id/index.php/eot 4
linear. Prior to extraction, twenty-four linear components within the data set are identified. Following extraction and rotation, the data set contains five distinct linear components with eigenvalue >1, mean the five factors are extracted.
As can be seen in Table 2, it can be seen the magnitude of the variance contribution given by each factor to all the original variables. Factor 1 contributes to the variance of 14.4% and is the largest variance contribution that affects consumer preferences for cafes as culinary tourism destinations in Malang City, several other
factors contribute to the variance, namely factor 2 of 14.2%, factor 3 of 12.9%, factor 4 of 12.5%, factor 5 of 8.3%. So that the total contribution of the variance of the five factors is 62.4%. It is recommended that these factors are maintained at least 50% of the total variance. The result indicates that five factors can account for 62.4% of the common variance shared by twenty-four variables.
In addition to determining the number of factors formed based on table 2, the eigenvalue can also be determined based on the scree test, the results can be seen in Figure 1.
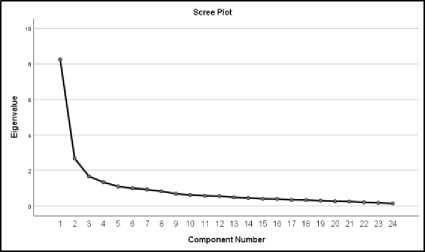
Figure 1. Scree Plot
As can be seen at Figure 1 the y-axis, eigenvalues are plotted towards to the twenty-four component numbers in their order of extraction on the x-axis. The largest factors with the highest eigenvalues are extracted first, followed by smaller factors. The scree plot is used to calculate the number of retained factors. The scree plot demonstrates that five factors have an eigenvalue greater than one, accounting for the majority of the total variability in the data (Shrestha, 2021a). The remaining factors contribute a negligible amount of variability and are therefore regarded as less significant. The final step to obtained
factor construct is performing factor rotation, the summary of the factor analysis results can be seen in Table 3.
Based on the results of the rotation of factors as presented in table 3, five factors were formed including factor 1 which was named the Marketing Mix factor, factor 2 Psychology, factor 3 Personal, factor 4 Social and Cultural, and factor 5 Personality. These five factors were determinants of customer preferences on cafe preferences as culinary tourism destinations in Malang City. Regarding the statistical analysis results presented in table 3, it can be seen the first factor is known as the Marketing Mix. The X2 variable or intangible factor (0.807) has the highest weight on the first factor, meaning that the X2 variable has the greatest influence among other variables in the first factor.
The second factor named Psychology, the X19 variable or Believe (0.806) has the highest weight on the second factor, meaning that the X19 variable has the greatest influence among other variables in the second factor. The third factor named Personal, the X13 variable or Economic (0.786) has the highest weight on the third factor, meaning that the X13 variable has the greatest influence among other variables in the third factor. The fourth factor named Social and Cultural, the X9 variable or Recommendation (0.794) has the highest weight on the fourth factor, meaning that the X13 variable has the greatest influence among other variables in the fourth factor. The fifth factor named Personality is the X14 variable or Lifestyle (0.770) has the highest weight on the fifth factor, meaning that the X14 variable has the greatest influence among other variables in the fifth factor.
Table 3. Summary of EFA Results
|
Factor |
Factor Name |
Eigenvalues |
Code |
Factor Variable |
Factor Loading |
|
X2 |
Intangible Product |
0.807 | |||
|
X1 |
Tangible Product |
0.728 | |||
|
X4 |
Facility |
0.612 | |||
|
X3 |
Price |
0.584 | |||
|
1 |
Marketing Mix |
8.248 |
X22 |
Environment |
0.569 |
|
X5 |
Attractions |
0.546 | |||
|
X23 |
Role |
0.530 | |||
|
X6 |
Location |
0.425 | |||
|
X24 |
Assurance |
0.399 | |||
|
X19 |
Believe |
0.806 | |||
|
2 |
Psychology |
2.674 |
X18 |
Learning |
0.766 |
|
X17 |
Perception |
0.697 | |||
|
X16 |
Motivation |
0.588 | |||
|
X13 |
Economic |
0.786 | |||
|
3 |
Personal |
1.658 |
X10 |
Social Class |
0.713 |
|
X11 |
Age |
0.683 | |||
|
X12 |
Profession |
0.663 | |||
|
X9 |
Recommendation |
0.794 | |||
|
X7 |
Activity |
0.702 | |||
|
4 |
Social and Cultural |
1.331 |
X21 |
Image |
0.598 |
|
X8 |
Culture |
0.533 | |||
|
X20 |
Promotion |
0.501 | |||
|
5 |
Personality |
1.087 |
X14 |
Lifestyle |
0.770 |
|
X15 |
Self concept |
0.718 |
CONCLUSION
Based on the study results, it can be concluded five factors were extracted that influence customer preferences on café as a culinary tourism destination in Malang. The five dominant determinant factors of customer preferences were the Marketing Mix (14.4%), Psychological (14.2%), Personal (12.9%), Cultural and Social (12.5%), and Personality (8.3%), in the total amount of 62.4%, where the rest amount may be affected by other unidentified factors. The results of this study hopefully can be a reference help stakeholders to make build a policy and make decisions. There are some suggestions for further research are to perform a more detailed analysis of the construct factor, and variables of the construct factor such as Intangible Product, http://ojs.unud.ac.id/index.php/eot 6
Believe, Economic, Recommendation, Lifestyle of customer preferences on café as a culinary tourism destination, especially in Malang.
ACKNOWLEDGEMENT
This study supported by PNBP FT research grant of Universitas Negeri Malang year of 2021.
REFERENCES
Abdillah, F. and Wira Diana, I. B. P. (2018) ‘Balanced Scorecard Implementation in Restaurant Management’, EJournal of Tourism, 5(1), p. 30. doi: 10.24922/eot.v5i1.38458.
Bolarinwa, O. A. (2015) ‘Principles and methods of validity and reliability
testing of questionnaires used in social and health science researches’, Nigerian Postgraduate Medical Journal. Medknow Publications and Media Pvt. Ltd., 22(4), p. 195. doi: 10.4103/1117-1936.173959.
BPS Malang Kota (2018) ‘Badan pusat statistik kota malang’.
BPS Malang Kota (2019) Badan Pusat Statistik. Available at:
https://malangkota.bps.go.id/dynamic table/2020/01/10/97/jumlah-restoran-menurut-kecamatan-di-kota-malang-2015-2019.html (Accessed: 23 March 2022).
Budiastuti, D. and Bandur, A. (2018) Validitas dan Reliabilitas Penelitian dengan Analisis Dengan Nvivo, Spss dan Amos. 1st edn. Jakarta: Mitra Wacana Media.
Fabrigar, L. R. and Wegener, D. T. (2012) Exploratory Factor Analysis. New York: Oxford University Press.
Hogarty, K. Y. et al. (2005) ‘The Quality of Factor Solutions in Exploratory Factor Analysis: The Influence of Sample Size, Communality, and
Overdetermination’.doi: 10.1177/0013164404267287.
Prayogo, D. and Suryawan, I. B. (2018) ‘Dampak Fenomena Wisata Kuliner Terhadap Kunjungan Wisatawan di Kota Malang, Jawa Timur’, Jurnal Destinasi Pariwisata. Universitas Udayana, 5(2), p. 335. doi: 10.24843/jdepar.2017.v05.i02.p24.
Qistiya, O., Turgarini, D. and Sudono, A. (2017) ‘Strategi Pengembangan Bisnis dalam Upaya Meingkatkan Penjualan di Café District 29’, Jurnal Manajemen Resort dan Leisure, (2). Available at:
https://ejournal.upi.edu/index.php/jur el/article/view/8466/5324.
Rahmawati, M. et al. (2020) ‘Community Participation to Develop Rural
http://ojs.unud.ac.id/index.php/eot 7
Tourism in Cafe Sawah Pujon Kidul Village’, 404(Icossei 2019), pp. 314– 318. doi:
10.2991/assehr.k.200214.057.
Setioko, M. D. (2019) ‘Analisis Strategi Pengembangan Wisata Kota Di Kota Malang’, Jurnal Pariwisata Pesona, 4(1), pp. 81–88. doi:
10.26905/jpp.v4i1.2524.
Shrestha, N. (2021a) ‘Factor Analysis as a Tool for Survey Analysis’, American Journal of Applied Mathematics and Statistics, 9(1), pp. 4–11. doi:
10.12691/ajams-9-1-2.
Shrestha, N. (2021b) ‘Factor Analysis of Students ’ Exposure to Social Media for Food and Beverage’, 8(February). doi: https://doi.org/10.52403/ijrr.2021021 9.
Soeroso, A. and Turgarini, D. (2020) ‘Culinary Versus Gastronomy’, EJournal of Tourism, 7(2), p. 193. doi: 10.24922/eot.v7i2.60537.
Tugu, M. (2019) Kafe di Malang yang Tumbuh dan Tumbang -
kumparan.com. Available at:
https://kumparan.com/tugumalang/kaf e-di-malang-yang-tumbuh-dan-tumbang-1551768038570428054 (Accessed: 14 March 2021).
Wijayanti, A. et al. (2021) ‘Shopping Tourism Development Through Top Five Products in Yogyakarta City, Indonesia’, E-Journal of Tourism, 8(1), p. 14. doi:
10.24922/eot.v8i1.67018.
e-ISSN 2407-392X. p-ISSN 2541-0857
Discussion and feedback