The Use of Online Travel Agent (OTA) By Non-Star Hotels in Sanur Bali
on
E-Journal of Tourism Vol.6. No.2. (2019): 342-358
The Use of Online Travel Agent (OTA) By Non-Star Hotels in Sanur Bali
I Gusti Agung Mirah Sanjiwani, Agung Suryawan Wiranatha and I Gusti Ayu Oka Suryawardani
Udayana University
Corresponding author : suryawardani@unud.ac.id
ARTICLE INFO ABSTRACT
Received
30 August 2019
Accepted
18 September 2019 Available online
30 September 2019
Non-star hotels as a tourism business are nowadays using online travel agents (OTA) to market their rooms. The research on using OTA is interesting to be conducted, considering that research involving hotel management in accepting technology using the Technology Acceptance Model (TAM) is has not widely found. This study aims to analyze the influence of non-star hotel management's acceptance in using OTA by TAM, namely Perceived Usefulness, Perceived Ease of Use, Attitude Toward Using, and Behavioral Intention to Use. The study involved 59 non-star hotel managements in Sanur as the respondents. The questionnaire included 17 indicators on TAM and interviews were conducted to support the statistical analysis. Structural Equation Modeling (SEM) analysis was carried out by using the SmartPLS 3 program. The results shows that: 1) Perceived Usefulness is significantly influenced on Attitude Toward Using, 2) Perceived Ease of Use is significantly influenced on Attitude Toward Using, 3) Perceived Usefulness is significantly influenced on Perceived Usefulness, 4) Attitude Toward Using is significantly influenced on Behavioral Intention to Use, and 5) Perceived Usefulness is not significantly influenced on Behavioral Intention to Use in hotel management of non-star hotels in Sanur Bali in using OTA. Overall, the non-star hotel management accepts OTA well to be used in their hotels.
Keywords: Technology Acceptance Model, Online Travel Agent, Nonstar Hotels Management, Bali.
INTRODUCTION
Background
Online Travel Agent (OTA) as a form of digital marketing communication is most widely used to market hotel products. The benefits of using OTA
include increasing hotel occupancy, increasing revenue, fixing prices according to the season, as a medium for promotion and sales that are efficient and wide-reaching, and tourists have the opportunity to become repeater guests (Khomah, 2016). The disadvantages of
using OTA include reducing net sales, overbooking, negative comments from tourists (Astuti, 2015), and commission payments are quite high, which ranges from 10% to 25% according to the type and location of each property made by tourists. The hotel manager chose to keep using OTA even though the commission paid was quite high. The use of OTA is becoming a popular thing used by managers of non-star hotels in Sanur. This is indicated by as many as 59 units from 80 hotel units in Sanur using OTA. The most popular OTAs used by budget hotels in Sanur are Booking.com, Agoda, and Traveloka. Booking.com is one of the most widely used OTA by budget hotels in Sanur.
Research related to the use of technology offered by OTA using hotel managers' perceptions is still very limited (Varol and Tarcan, 2009; Ko and Yu, 2015; Iacianci, 2015; Masa'deh et al, 2018). The use of OTA in several journals uses motivational theory (Astuti, 2015), digital marketing framework (Nirmala, 2017; Jannah, 2017) and recognizes the advantages and disadvantages of using OTA (Khomah, 2016; Tooke-Marchant, 2016; Tirtayasa and Paturusi, 2016 ). However, it is still difficult to find research involving hotel managers using technology acceptance models in OTA. Models that have been used to see the use http://ojs.unud.ac.id/index.php/eot
of technology in the field of tourism, such as evaluating the Indonesian Ministry of Tourism website by using the theory of Information, Communication, Transaction, Relationship, and Technical-Merit (ICTRT) (Mecha et al, 2019) and do the gap analysis of smart travel implementation in airport by using the theory of UTAUT II (Unified Theory of Acceptance and Use of Technology II) (Laluyan et al, 2018). TAM (Technology Acceptance Model) can be used to assess a person's perception of technology acceptance (Davis, 1985). TAM includes four important variables that influence each other, namely Perceived Usefulness, Perceived Ease of Use, Attitude Toward Using, and Behavioral Intention to Use (Davis, 1989). Research using this model is found in measuring tourist behavior and satisfaction (Latona, 2016; Kim and Qu, 2014; Yerby, 2012).
This research is important to look at the use of OTA by non-star hotel managers in Sanur in hotel operations. This study also aims to see (i) perceived usefulness influences attitude Toward using, (ii) perceived ease of use affects attitude Toward using, (iii) perceived ease of use influences perceived usefulness, (iv) attitude Toward using influences on behavioral intention to use, and (v) perceived usefulness influences behavioral intention to use.
LITERATURE REVIEW
Previous research studies have shown that there is a significant influence between perceived usefulness, perceived ease of use, attitude Toward using, and behavioral intention to use in the TAM model (Varol and Tarcan, 2009; Kim and Qu, 2014; Yerby, 2012). However, research conducted by Latona (2016) results that perceived usefulness and perceived ease of use produce insignificant effects on behavioral intention to use. Shroff (2011) describes several indicators used in the attitude Towards using variables and behavioral intention to use. The indicators of attitude Toward using are trust, enjoyment, comfort and interest in ideas. Indicators of behavioral intention to use include selfmotivation and long-term use. Harriyanti et al (2018) add indicators to motivate other users and save on bookmarks on behavioral intention to use.
Technology Acceptance Model (TAM)
TAM was developed as a theory for understanding acceptance in using information systems (Davis, 1989). TAM is also a model that implements Theory Planned Behavior (Ajzen and Fishbein, 1980). Variables in TAM include four important variables that influence each other, namely perceived usefulness, http://ojs.unud.ac.id/index.php/eot
perceived ease of use, attitude Toward using, and behavioral intention to use (Davis, 1985; Davis, 1989).
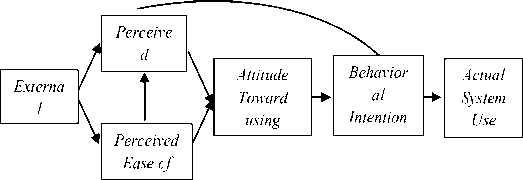
Figure 1. The Original Technology Acceptance Model (TAM), (Davis et al., 1989)
Perceived usefulness includes four indicators, namely productivity,
effectiveness, importance for task division, and performance. Perceived ease of use contains five indicators, namely the complexity of use, ease of achieving goals, easy to understand, flexible, and providing guidance. Attitude Toward using consists of four indicators, namely trust, enjoyment, comfort, and interest in ideas. Behavioral intention to use consists of four indicators, namely self-motivation, desire to motivate other users, long-term use, and saving on bookmarks.
Room Marketing Communication
Marketing is defined as the activities of producers to move goods or services to consumers, as well as after sales service activities after products are 344 e-ISSN: 2407-392X. p-ISSN: 2541-0857
sold to provide guarantees and satisfaction to consumers (Yoeti, 2013). Effective marketing communication requires a combination of several different methods (Middleton et al, 2009). Some forms of promotion mix include personal selling, sales promotion, public relations, direct marketing, online marketing (emarketing), and advertising (Hasan, 2013).
Online Travel Agent (OTA)
Online marketing is a form of marketing that uses information and communication technology. OTA entered into the category of affiliate marketing and strategic partnership marketing, namely by collaborating with other organizations and websites to promote products and services (Ryan and Jones, 2009). OTA is divided into three types, namely online booking, review, and online aggregator. Online booking functions for booking accommodation services. Reviews function as providers of reviews or experiences of tourists who have used the services offered in the media. An online aggregator functions as an online booking and review, which makes it easier for tourists to find accommodation options, compare prices and can book directly.
Budget Hotel Industry
The hotel is a tourism business which is engaged in providing services to guests who aim to gain profit (Budi, 2013). Hotels can be divided according to hotel class or called star hotels, which consists of five-star hotels, four-star hotels, three-star hotels, two-star hotels, and jasmine or non-star hotels (Soenarno, 2006). Jasmine hotels are small scale hotels usually managed by hotel owners and are provided with supporting facilities in each room (Sutisna, 2008).
RESEARCH METHODS
The study was conducted in three traditional villages in Sanur, namely Sanur Village, Sanur Kauh Village, and Sanur Kaja Village starting from February to May 2019. The study used a quantitative approach supported by qualitative data. The research respondents were managers of budget hotels in Sanur, as many as 59 people. The questionnaire included 17 indicators written in the form of statements. Interviews were conducted on respondents of the study. Table 1 contains the indicators used in this study.
Table 1. Research Variables and
Indicators
|
Variable |
Indicator |
Code |
Number of Indicators | |
|
Perceived |
1. |
Productivities |
PUS1 | |
|
usefulness |
2. |
Effectiveness |
PUS2 | |
|
(PUS) |
3. |
Importance of |
PUS3 |
4 |
|
task sharing |
PUS4 | |||
|
4. |
Performance | |||
|
Perceived |
1. |
Complicated |
PEU1 | |
|
ease of use |
2. |
Ease of |
PEU2 | |
|
(PEU) |
achieving |
PEU3 | ||
|
goals |
PEU4 | |||
|
3. |
Easy to understand |
PEU5 |
5 | |
|
4. |
Flexible | |||
|
5. |
Providing instructions | |||
|
Attitude |
1. |
Trust |
ATU1 | |
|
Toward |
2. |
Enjoyment |
ATU2 | |
|
Using |
3. |
Comfort |
ATU3 |
4 |
|
(ATU) |
4. |
Interest in ideas |
ATU4 | |
|
Behavioral |
1. |
Self |
BIU1 | |
|
intention |
motivation |
BIU2 | ||
|
to use |
2. |
Motivating |
BIU3 | |
|
(BIU) |
3. |
other users Long-term use |
BIU4 |
4 |
|
4. |
Saving on bookmark | |||
|
Number of Indicators |
17 | |||
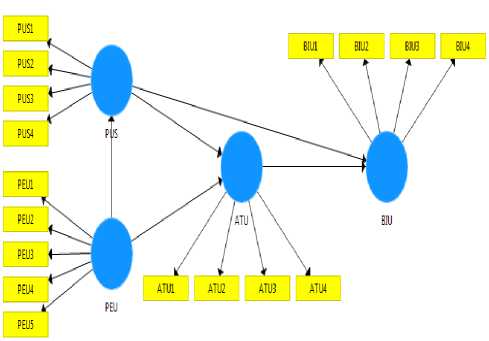
Figure 2. Structural Equation Model of
the Use of OTA by Melati Hotels in Sanur
The data were analyzed using SEM analysis based on Partial Least Square (SEM-PLS) using the SmartPLS Version 3 program. Respondent characteristics were calculated using descriptive statistical analysis.
RESULTS AND DISCUSSION
The TAM model is applied in this study, where exogenous variables include perceived usefulness and perceived ease of use, while endogenous variables include attitude Toward using and behavioral intention to use. Figure 2 shows the structural equation model in this study.
Online Travel Agent at Non-Star Hotels in Sanur
The popularity of using online travel agents (OTA) in Sanur can be seen from the fact that many jasmine hotels use OTA to introduce and market hotel products. The convenience provided by OTA is also felt by tourists, where they can book a room without having to wait long or without coming directly to the hotel to ask for room availability. The OTA’s names used by budget hotels in
Sanur can be seen in Figure 3.
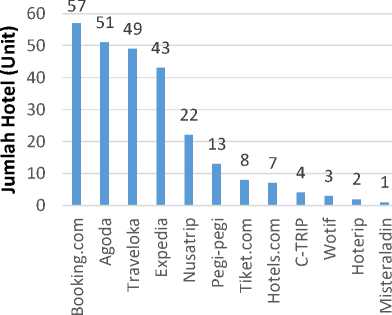
Figure 3. OTA at Non-Star Hotels in Sanur for May 2019
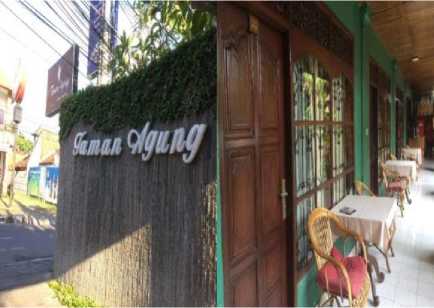
Figure 4. Taman Agung Hotel and Bali Senia Hotel (I Gusti Agung Mirah Sanjiwani)
Non-star hotels in Sanur that use OTA are 59 units from 80 hotel units in total. The most used OTAs by this budget hotel are Booking.com (96.61%), Agoda (86.44%), Traveloka (83.05%), Expedia (72.88%) and Nusatrip (37.29% ). Booking.com's popularity as an OTA with the highest percentage of usage is due to a wider range of tourists in various countries, sites that can be accessed in 43 languages and representative offices throughout the world, including in Bali, which can facilitate communication between hotel managers and parties of OTA.
Characteristics of Respondents
Characteristics of research respondents include gender, age, last education, and position. Respondents were dominated by women (50.85%) and followed by men (49.15%). Respondents with an age range of 26-35 years were 42.37% were more in number that than those with other age ranges, the age range of other respondents ranging from 36-45 years (20.34%), less than 25 years (18.64% ), 46-55 years (11.86%), and 5665 years (6.78%). The most recent education held by respondents was at the Diploma IV / undergraduate level (40.68%), followed by the education level of High Schools / Vocational Schools (35.59%), Diploma III and postgraduates (respectively 8.47%) and Diploma I (6.78%). Front Office Department staff became the positions that used the most
OTA system in hotel operations, amounting to 38.98%, followed by the Sales and Marketing Department Managers (23.73%), Sales and Marketing Staff (16.95%), and Front Office Department Managers (3.39%). Other positions (16.95%) who also use the OTA system more often are the owner, owner representative, operational manager, assistant manager, and front office department supervisor.
Test Validity and Reliability
The questionnaire was tested first on 30 respondents outside the study site with the consideration that the respondents had the same characteristics as those at the study site and understood the use of OTA. The test results produced two indicators that were invalidly discriminatory, namely the save indicator on bookmarks (BIU4) and ease of achieving the goal (PEU2) which had a cross loading value that did not meet the criteria, so that both indicators were removed from the model. The reliability test used the criterion that the indicator has good reliability if the value is> 0.60 (Chin, 1998 in Suryawardani, 2018). Indicators tested produce values> 0.60 which means reliable. Test on 30 respondents produced 15 valid and reliable indicators.
The suggested convergent validity test is having a value> 0.70 considering the indicators on the model are reflective (Ghozali, 2014). Tests on 59 respondents at the study site produced two indicators that were not convergently valid, namely the trust indicator (ATU1) and the complexity of use (PEU1) with values of 0.606 and 0.567, respectively. Table 2 presents the results of the second stage of the test after omitting the two indicators.
Table 2.Outer Loading Value and Average
Variance Extracted (AVE)
Indicator (Second Stage Test)
|
Indicator |
AVE |
Variable | |||
|
PUS |
PEU |
BIU |
ATU | ||
|
PUS1 |
0.828 | ||||
|
PUS2 |
0.699 |
0.829 | |||
|
PUS3 |
0.872 | ||||
|
PUS4 |
0.815 | ||||
|
PEU3 |
0.830 | ||||
|
PEU4 |
0.722 |
0.875 | |||
|
PEU5 |
0.844 | ||||
|
BIU1 |
0.915 | ||||
|
BIU2 |
0.731 |
0.835 | |||
|
BIU3 |
0.864 | ||||
|
ATU2 |
0.841 | ||||
|
ATU3 |
0.760 |
0.835 | |||
|
ATU4 |
0.888 | ||||
The outer loading value in Table 2 shows that the value of each indicator> 0.70 which means that 13 indicators are convergently valid. Validity test can also
be seen on the AVE value with the provisions of value> 0.50 (Ghozali, 2014). AVE value on each variable meets the criteria, where the greatest AVE value is owned by Attitude Toward Using, which is 0.760. The average value of AVE is 0.728, which means that all constructs have a "good" category.
Table 3. Cross Loading Value (Second
|
Stage Test) | ||||
|
Indicator |
Variable | |||
|
ATU |
BIU |
PEU |
PUS | |
|
ATU2 |
0.841 |
0.644 |
0.545 |
0.674 |
|
ATU3 |
0.835 |
0.606 |
0.546 |
0.643 |
|
ATU4 |
0.888 |
0.718 |
0.706 |
0.851 |
|
BIU1 |
0.759 |
0.915 |
0.622 |
0.757 |
|
BIU2 |
0.602 |
0.835 |
0.451 |
0.604 |
|
BIU3 |
0.641 |
0.864 |
0.514 |
0.581 |
|
PEU3 |
0.581 |
0.585 |
0.830 |
0.654 |
|
PEU4 |
0.637 |
0.557 |
0.875 |
0.613 |
|
PEU5 |
0.584 |
0.414 |
0.844 |
0.565 |
|
PUS1 |
0.765 |
0,634 |
0.514 |
0.828 |
|
PUS2 |
0.642 |
0.613 |
0.610 |
0.829 |
|
PUS3 |
0.760 |
0.659 |
0.678 |
0.872 |
|
PUS4 |
0.684 |
0.598 |
0.599 |
0.815 |
Discriminant validity can be assessed by looking at the value of loading each indicator, where the value is expected to have a higher value when compared to indicators for other latent variables. Table 3 shows that the indicator value on each latent variable has a better value than the other variables. The indicators in Table 3 have met the criteria
so that the indicators have been discriminatory valid. Valid indicators are also tested for reliability. The reliability test results show a value> 0.60, where Perceived Usefulness (PUS) has a value of 0.903, Perceived Ease of Use (PEU) has a value of 0.886, Attitude Toward Using (ATU) has a value of 0.891, and Behavioral Intention to Use has a value of 0.905. The value of each variable is > 0.60 so that the indicator has good reliability.
SEM Analysis of Online Travel Agent (OTA) usage by Non-Star Hotels in Sanur
Evaluation of the Measurement Model (Outer Model)
Evaluation of the measurement model is done to see the relationship between variables and their constituent indicators. The significance value of the indicator and its variables can be seen by performing the bootstrapping procedure. The outer model results on the Perceived Usefulness and Perceived Ease of Use variables can be seen in Table 4 and Table 5.
Table 4. Outer Model Results in Perceived
Usefulness Variables
|
Code |
Indicator |
Outer Loading |
T Statistics |
P Values |
|
PUS1 |
Productivity |
0.828 |
11.091 |
0.000 |
|
PUS2 |
Effectiveness |
0.829 |
10.038 |
0.000 |
|
PUS3 |
Importance |
0.872 |
17.284 |
0.000 |
|
of task | ||||
|
sharing | ||||
|
PUS4 |
Performance |
0.815 |
9.546 |
0.000 |
Table 5. Outer Model Results from the
Perceived Ease of Use Variable
|
Code |
Indicator |
Outer Loading |
T Statistics |
P Values |
|
PEU1 |
Complicated |
0.567 |
3.334 |
0.001 |
|
PEU3 |
Easy to understand |
0.835 |
16.065 |
0.000 |
|
PEU4 |
Flexible |
0.851 |
17.819 |
0.000 |
|
PEU5 |
Providing instructions |
0.819 |
19.947 |
0.000 |
The highest outer loading value on each variable can be interpreted as the indicator that best represents its constituent variables. The indicator
significantly, which has a significance level below 5%.
Table 6. Outer Model Results from the Variable Attitude Toward Using
|
Code |
Indicator |
Outer Loading |
T Statistics |
P Values |
|
ATU1 |
Trust |
0,606 |
5.839 |
0.000 |
|
ATU2 |
Enjoying |
0,835 |
13.092 |
0.000 |
|
ATU3 |
Comfort |
0,797 |
9.836 |
0.000 |
|
ATU4 |
Interest |
0,874 |
27.851 |
0.000 |
|
in the | ||||
|
idea |
Table 7. Outer Model Results from the
Variable Behavioral Intention to
Use
|
Code |
Indicator |
Outer Loading |
T Statistics |
P Values |
|
BIU1 |
Selfmotivation |
0.915 |
44.022 |
0.000 |
|
BIU2 |
Desire of motivating other users |
0.835 |
11.538 |
0.000 |
|
BIU3 |
Long-term use |
0.864 |
18.018 |
0.000 |
|
"importance for the task division" can |
|
represent the variable Perceived |
|
Usefulness (PUS) because it has the |
|
greatest value (0.872). The indicator |
|
"flexible" can represent the variable |
|
Perceived Ease of Use with a value of |
0.851. All indicators on the variable
Perceived Usefulness and Perceived Ease of Use can reflect the latent variable
The indicators that make up the Attitude Toward Using and Behavioral Intention to Use variables in Table 6 and Table 7 can reflect the latent variables significantly, which are at a significance level of less than 5%. The indicator "interest in ideas" can represent the Attitude Toward Using variable with the
highest value compared to other indicators, which is equal to 0.874. The indicator "self motivation" can represent the Behavioral Intention to Use variable by having a loading value of 0.915.
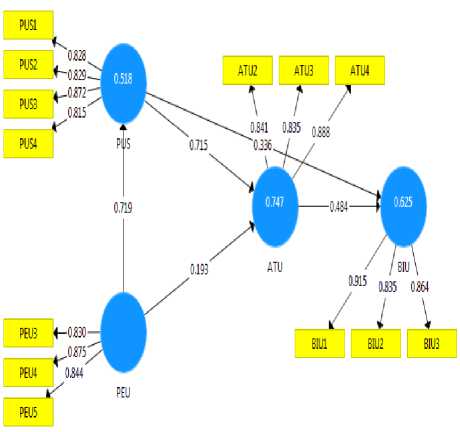
Figure 5. Structural Model Results in the
Outer Model
Table 8. Value of Direct Effect
|
Hypot hesis |
Exog enous Varia ble |
Endogeno us Variable |
Origi nal Samp le |
T Stati stics |
P Valu es | |
|
H1 |
PUS |
^ |
AT U |
0.715 |
7.71 0 |
0.00 0 |
|
H2 |
PEU |
^ |
AT U |
0.193 |
1.96 5 |
0.05 0 |
|
H3 |
PEU |
^ |
PUS |
0.719 |
10.5 52 |
0.00 0 |
|
H4 |
ATU |
^ |
BIU |
0.484 |
3.14 5 |
0.00 2 |
|
H5 |
PUS |
^ |
BIU |
0.336 |
1.93 5 |
0.05 4 |
The hypothesis to be tested can be seen in the effect of each exogenous variable. All influences show positive values. Four hypotheses show a significant effect, which has a p-value <0.05. The insignificant effect on the fifth hypothesis is caused by a significance level that exceeds 5%.
Evaluation of Structural Model (Inner Model)
The relationship between latent variables structurally is done by evaluating the inner model. Evaluation of this model is done by looking at the direct effect and indirect effect on each variable. The significance test was carried out using a significance level of 5%.
|
Table 9. Value of Indirect Effects | |||||||
|
Exoge nous Varia bles |
Mediation Variables |
Endogen ous Variable s |
Sam ple Mea n |
T Stati stics |
P Valu es | ||
|
PUS |
^ |
^ |
BI |
0.35 |
2.63 |
0.00 | |
|
ATU |
U |
2 |
0 |
9 | |||
|
PEU |
^ |
^ |
BI |
0.23 |
1.84 |
0.06 | |
|
PUS |
U |
3 |
8 |
5 | |||
|
PEU |
^ |
^ |
AT |
0.50 |
5.66 |
0.00 | |
|
PUS |
^ AT U |
U |
6 |
9 |
0 | ||
|
PEU |
^ |
^ |
BI |
0.25 |
2.45 |
0.01 | |
|
PUS |
U |
2 |
9 |
4 | |||
|
PEU |
^ |
^ |
BI |
0.09 |
1.66 |
0.09 | |
|
ATU |
U |
4 |
0 |
8 | |||
The value of indirect effects produces three significant effects and two non-significant influences. Perceived Usefulness has a significant influence on
Behavioral Intention to Use if mediated by Attitude Toward Using, while the direct effect indicates the influence of the two variables is not significant.
Structural equation models can also be evaluated by looking at the R2 value, where the range of values exceeds 0.67 indicating the "strong" model, the range of values 0.67-0.33 indicates the "moderate" model and 0.33-0.19 indicates that the model "Weak", "moderate" and "weak" (Ghozali, 2014). Perceived Usefulness (PUS) and Behavioral Intention to Use (BIU) values are 0.518 and 0.625, respectively, which are in the "moderate" category. Attitude Toward Using (ATU) has a value of 0.747 which means the "strong" model. The average value of R2 is 0.630.
Model Feasibility
The structural equation model
using 13 indicators is then calculated to see the feasibility of the model designed through the Goodness-of-Fit value. The model is said to be good if the GoF value>
0.50 (Tenenhaus et al, 2015). The feasibility of the model with GoF can be calculated using the following formula:
The average value of communality is obtained from the average value of AVE. The average root AVE multiplied by the average R2 yields a value of 0.607. This value indicates that the GoF value> 0.50, which means the model is categorized as good and can be used to test hypotheses.
DISCUSSION
Perceived Usefulness influences Attitude Toward Using OTA on Melati Hotel Managers in Sanur
Perceived Usefulness significantly influences Attitude Toward Using, this hypothesis is supported by previous studies (Varol and Tarcan, 2009; Kim and Qu, 2014; Yerbi, 2012). The manager of a non-star hotel in Sanur feels that OTA is beneficial, so that the manager shows a positive attitude to use OTA. Managers of non-star hotels in Sanur believe that using OTA can increase their productivity, effectiveness and performance in hotel operations. Result of an interview with Laraswati, Sales and Marketing A Department Staff at Puri Sading Hotel was as follow:.
GOF =
√̅c̅o̅̅m̅̅m̅̅̅u̅n̅̅a̅l̅ı̅t̅y̅ x ̅R̅̅
Source: Tenenhaus, et al (2005: 173)
"OTA provides benefits to find out which market is the current trend, such as providing newsletters and following campaigns. OTA is also useful for marketing hotel products directly to guests without having to spend a lot of money, unlike conventional forms of marketing in general and OTA really helps increase room sales "
Based on data on room sales for the period of 2016-2018 and the results of interviews with hotel managers, 74.58% or 44 hotels had more rooms sold from bookings made through OTA, while 25.42% or 15 hotels were sourced from direct booking. The decision to adjust the price and availability of the right room with consideration of market trends and seasons will be able to assist managers in increasing room production. The perceived increase in work productivity can lead to a high sense of trust in OTA considering that room marketing through OTA is more significant when compared to other room booking sources.
Perceived Ease of Use influences Attitude Toward Using OTA on Melati Hotel Managers in Sanur
Perceived Ease of Use significantly influences Attitude Toward Using, this hypothesis is supported by http://ojs.unud.ac.id/index.php/eot
previous studies (Varol and Tarcan, 2009; Kim and Qu, 2014; Yerbi, 2012). The use of OTA for managers of non-stasr hotels in Sanur generally provides convenience, both in terms of access and ease of study, so managers choose to use OTA. Interview with Gusti Ayu Putu Sarini, Operations Manager at Taman Agung Hotel, was as follow:
"OTA provides ease of payment for tourists wanting to stay at a hotel, for example, last minute booking, they can book and pay directly at the hotel. They can come directly to see the rooms and if they are not pleased because they want a beachside hotel, they can immediately leave because the hotel does not charge a cancellation fee for last minute booking. However, there are also tourists who book a room one night, after they come and see the room is good, they can for one week stay here. The price is a benchmark for guests, if given a published rate sometimes guests ask why OTA prices can be cheaper, so hotels are difficult to compete in price. We try to provide good service so that guests feel satisfied and can provide positive reviews on the OTA website.
Attitude can also be influenced by beliefs (Latona, 2016), where beliefs cover two important things, namely 353 e-ISSN: 2407-392X. p-ISSN: 2541-0857
perceived ease of use and perceive usefulness. The perceived ease makes the hotel manager to be positive and willing to accept OTA to be used to market rooms.
Perceived Ease of Use affects the Perceived Usefulness of OTA Use in Managers of Melati Hotels in Sanur
Perceived Ease of Use has a significant effect on Perceived Usefulness, this hypothesis is supported by previous research (Varol and Tarcan, 2009; Kim and Qu, 2014; Yerbi, 2012). The manager of a non-star hotel in Sanur feels that OTA is very easy to use, so that positive benefits can be felt in using OTA. Result of an interview with I Wayan Suliana, Manager of the Front Office Department at Puri Mango Hotel was as follow:
"If a guest complains, the complaint is immediately followed up. Negative guest reviews will also be reported during the briefing, so that other things that need to be improved so that later we will get a good impression and also many tourists stay here”.
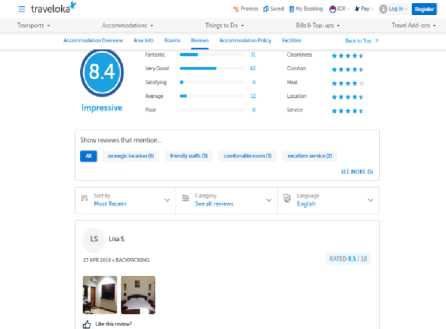
Figure 6. Traveler Reviews on the Sanur Indah Hotel on Traveloka
Reviews on an internet site are also believed to influence the desire to book a hotel and can be used to improve services on these accommodations
(Bhaskara, 2018). The form of room marketing using OTA will provide an opportunity for nom-star hotel managers in Sanur to be able to improve the operational performance of the hotel, namely through the guest review feature that can be accessed on the extranet. The availability of tourist review features that are easily accessible can help improve the operational performance of budget hotels, so that the hotel can provide the best service to tourists.
Attitude Toward Using influences
Behavioral Intention to Use OTA in
Melati Hotel Managers in Sanur
Attitude Toward Using
significantly influences Behavioral
Intention to Use, this hypothesis is
supported by previous studies (Varol and Tarcan, 2009; Kim and Qu, 2014; Yerbi, 2012). The manager of a jasmine hotel in Sanur positively accepted the use of OTA, so that the intention to use OTA became even higher. Hotel managers who had the opportunity to be interviewed by 52 people stated that OTA facilitates the manager in marketing hotel rooms. The positive attitude shown by non-star hotel managers in the use of OTA has an impact on increasing the intention to use the system. OTA acceptance which has a positive impact on increasing sales of hotel rooms makes the manager choose to use the system in marketing and accepting room bookings.
Perceived Usefulness influences Behavioral Intention to Use OTA in Melati Hotel Managers in Sanur
Perceived Usefulness does not significantly influence Behavioral Intention to Use, this hypothesis is supported by previous studies (Latona, 2016). Managers of jasmine hotels in Sanur feel a positive benefit in the use of OTA, but there is no significant effect for managers to increase the intensity of the use of OTA in hotel operations. Interview with I Nyoman Artha Yasa, Staff Front Office Department at Hotel Jati, was as follow:
"If you only rely on OTA, staff income is low because a high commission must be paid by 15%, even though tax and service are included in the price but still the income received is small."
Some hotel managers feel that OTA is very helpful to increase room sales, but the high competition with other hotels makes managers compete to provide promotions or low prices, so that it has an impact on reducing the net sales received from room sales.
CONCLUSIONS AND SUGGESTIONS
The perception of managers of non-star hotels in Sanur generally shows that managers agree to use OTA in operational activities. Some things that can be concluded related to manager's perception are (i) Perceived Usefulness significantly influences Attitude Toward Using, (ii) Perceived Ease of Use significantly influences Attitude Toward Using, (iii) Perceived Ease of Use significantly influences Perceived Usefulness , (iv) Attitude Toward Using significantly influences Behavioral Intention to Use, and (v) Perceived Usefulness does not significantly influence Behavioral Intention to Use.
Interest in using OTA in the long run can be balanced by designing the right room marketing strategy to avoid losses or get a small profit. Specifications for the use of OTA and other types of hotels can be recommendations for further research to see the acceptance of a particular OTA in the manager of certain types of hotels, such as perceptions of hotel managers in using OTA Booking.com. In addition, the basic model in TAM used in this study is still relatively weak, so it is recommended to add the Perceived Behavioral Control variable since TAM is an implementation of the Theory Planned Behavior to be applied in further research in looking at the development of OTA.
REFERENCES
Ajzen, I. and M. Fishbein. 1980. Understanding Altitudes and Predicting Social Behavior. New Jersey: Prentice-Hall
Astuti, L.S. 2015. Perception of Villa Managers in North Kuta District Against Online Use of Travel Agents as a Media for Promotion and Sales.
Bhaskara, G. I. 2018. AirBnB in Bali: Identification of Foreign Traveler Online Reviews through the Netnography Method. Journal of Tourism Master (JUMPA). Vol. 5 (1) p 27-56
Budi, A.P. 2013. Hospitality Marketing Management. Yogyakarta: Andi
Publisher
Davis, F.D. 1985. "A Technology Acceptance Model for Empirically Testing New End-User Information Systems: Theory and Results".
(Dissertation) Massachusetts:
Massachusetts Institute of
Technology
Davis, F.D. 1989. Perceived Usefulness, Perceived Ease of Use, and User Acceptance of Information
Technology. MIS Quarterly. Vol. 13 (3) p. 319-340
Davis, F.D., R.P. Bagozzi and P.R. Warshaw 1989. User Acceptance of Computer Technology: A
Comparison of Two. Management Science. Aug Vol. 35 (8) p. 9821003
Ghozali, I. 2014. Structural Equation Modeling: Alternative Methods with Partial Least Square (PLS). Semarang: Diponegoro University Publisher Agency.
Hariyanti, N.K.D., I.P. Sutawinaya, I.G.K. Gede and I.K. Suwintana. 2018. Analysis of Acceptance of Bali State Polytechnic Planning and Budget System Using Technology
Acceptance Model (TAM). Final Report of the Bali State Polytechnic Leading Research (Unpublished)
Hasan, Ali. 2013. Marketing and Selected Cases. Yogyakarta: Caps Publisher
Iacianci, C.M. 2015. "Hotel Manager’s Attitudes Toward Social Media". (Thesis Dissertation). Ohio: Kent State University College
Jannah, M. 2017. Perception of Hotel Managers in Pekanbaru City on the Function of OTA (Online Travel Agent) as a Marketing Tool. Online Journal of Social and Political Science Students in Riau University. Vol. 4 (2) p. 1-11
Khomah, I. 2016. The Massively Use of Online Travel Agents (OTA) in Increasing Marketing Revenue. Journal of Management and Business at the National Education University. Vol. 13 (1) p. 52-63
Kim, M. and H. Qu. 2014. Travelers' behavioral intention Toward hotel self-service kiosks usage.
International Journal of
Contemporary Hospitality
Management. Vol. 26 (2) p. 225-245
Ko, C.H. and C.C. Yu 2015. Exploring Employees' Perception of Biometric Technology Adoption in Hotels. The International Journal of
Organizational Innovation. Vol. 8 (2) p. 187-199
Laluyan, R.R., I.P.G. Sukaatmadja, and G.I. Bhaskara 2018. Gap Analysis in the Implementation of Smart Travel at I Gusti Ngurah Rai International Airport, Bali. [cited 2019 Aug 14] Available from: URL:
www.researchgate.net/publication/ 323337047
Latona, C.T. 2016. "Consumers' Acceptance of Restaurant
Reservation Systems" (Thesis). Michigan: Michigan State
University
Masa'deh, R., Mahmoud, R. M., Almomani, E., Rashaideh, S., Algunmuen, A., & Smadi, N.
(2018). The Use of Information Systems in Aqaba Hotels: An Integration of TAM with Task Technology Fit and Self-Efficacy. Journal of Tourism, Hospitality and Sports. Vol. 34 p 1-15
Mecha, I.P.S, U.S. Wiranatha, and I.N. Sudiarta. 2019. Evaluation of the Wonderful Indonesia Tourism Website Based on the ICTRT Model (Information, Communication,
Transaction, Relationship, and Technical-Merit). Journal of Tourism Masters (JUMPA), Udayana University. Vol. 5 (2) p. 241–258
Nirmala, B.P.W. 2017. Perception of 1-5 Star Hotel Managers on the Functions and Features of Online Marketing Media in Kuta District, Bali Province. Journal of Tourism Masters (JUMPA), Udayana University. Vol. 3 (2) p. 356 - 371
Ryan, D. and C. Jones. 2009. Understanding Digital Marketing: Marketing Strategies for Engaging the Digital Generation. Kogan Page: London and Philadelphia
Shroff, R.H., C.C. Deneen and E.M.W. Ng 2011. Analysis of the technology acceptance model in examining students' behavioral intention to use an portfolio system. Australasian Journal of Educational Technology. Vol. 27 (4) p. 600-618
Soenarno, A. 2006. Front Office Management. Yogyakarta: Andi
Publisher
Suryawardani, I.G.A.O. 2018. Evaluation of Marketing Strategy of Sanur Village Festival Based on Visitors Behavior. International Journal of Applied Business and Economic Research. Vol. 16 (2) p. 261-276
Sutisna, N.M. 2008. Hotel
Accommodations. Jakarta: Kesaint Blanc
Tenenhaus, M., V. Vinzi, Y. Chatelin, C. Lauro. 2005. PLS Path Modeling. Computational Statistics and Data Analysis. Vol. 48 p 159-205
Tirtayasa, P.P.I and S.A. Patient. 2016. Use of Hotel Websites and Online Travel Agencies as Media of Promotion and Sales for Melati Hotels in Ubud. Journal of Tourism Masters (JUMPA), Udayana University. Vol. 3 (1) p. 60-71
Tooke-Marchant, R. 2015. Online travel agents (OTAs) and their dominance of search engine results: Can independent hotels compete ?. Journal of Direct Data Digit Mark Practice. Vol. 16 (3) p 154-156
Traveloka.com. 2019. Room Rate Hotel Sanur Indah. [cited 2019 Jun 18]. Available from: URL:
https://www.traveloka.com/en-id/hotel/indonesia/hotel-sanur-indah-3000010000 944? Spec = 1906-2019.21-06-2019.2.1.HOTEL.3000010000944. Hotel% 20Sanur% 20 Beautiful
Varol, E.S.V. and E. Tarcan. 2009. An empirical study on the user acceptance of hotel information systems. Turizam: međunarodni
znanstveno-stručni časopis. Vol. 57 (2) p. 115-133
Yerby, D. 2012. "Examining the Relationship between Online Travel Agency Information and Traveler Destination Transaction Decisions". (Dissertation) Arizona: Northcentral University
Yoeti, O. 2013. Tourism Marketing. Bandung: Publisher Space
http://ojs.unud.ac.id/index.php/eot
358
e-ISSN: 2407-392X. p-ISSN: 2541-0857
Discussion and feedback