The Influence of Tourists’ Motivation on Intention to Revisit at The Traditional Village of Prai Ijing, Waikabubak, West Sumba, East Nusa Tenggara
on
E-Journal of Tourism Vol.6. No.2. (2019): 303-321
The Influence of Tourists’ Motivation on Intention to Revisit at The Traditional Village of Prai Ijing, Waikabubak, West Sumba, East Nusa Tenggara
Fransiska Fila Hidayana1, I Gusti Ayu Oka Suryawardani2
2 and Agung Suryawan Wiranatha
1Master Program in Tourism Udayana University
-
2 Centre of Excellence in Tourism Udayana University Corresponding author : suryawardani@unud.ac.id
ARTICLE INFO
ABSTRACT
Received
2 August 2019
Accepted
18 September 2019 Available online
30 September 2019
Push and pull factor as motivation for travelling are the components that influence tourist perception about tourist attraction related to the level of tourist satisfaction. Motivation also able to encourage tourist to revisit. Prai Ijing Traditional Village is one of the tourist attractions and cultural sites which is located in Waikabubak, West Sumba, NTT. It has unique culture, strategic location, therefore visited by many visitors. The purpose of this study is to determine the effect between motivation, tourist satisfaction and intention to revisit the village. The research method, the population of this research are domestic and foreign tourists visiting the Prai Ijing Traditional Village. The samples of this research is 100 visitors as the respondent, by using accidental sampling. The data were analyzed by Structural Equation Modeling (SEM) using SmartPLS software version 3.0 and qualitative descriptive analysis to describe the characteristics of respondents, interpretate the results of SEM analysis, and reveal the result of research hypothesis test. The results showed that push and pull factors had significant effect on tourist satisfaction. Tourist satisfaction had significant effect on the intention to revisit. The push and pull factors did not had significant effect on the intention to revisit. Pull factors had significant effect than push factors on tourist satisfaction. Therefore, the pull factors need to be maintained and improved in order to be able to provide optimal satisfaction. The management and local communities are expected to increase the diversity of attraction and tourist activities, provide unique and innovative cultural tourism products, and maintain local wisdom and cultural assets as the main attention for tourists to visit the Prai Ijing Traditional Village
Keywords: tourist motivation, satisfaction, revisit intention, SEM
INTRODUCTION
Background
Tourism in many countries is developing rapidly from time to time. Nowadays people travel not only to gain experience; that is, not only to travel to spare time. Traveling is now a vital need that must be met. The motivation for traveling in this case is the push factor and the pull factor which is one of the components that can shape the tourist opinion about tourist attraction which leads to the assessment of tourists regarding the level of satisfaction after traveling, and it shapes the behavior of tourists to revisit.
The Traditional Village of Prai Ijing is located in the Prai Ijing Hamlet of Tebara Village, Kota Waikabubak SubDistrict, West Sumba Regency, East Nusa Tenggara.Traditional Village of Prai Ijing is one of the potential tourist destinations with megalithic tombs and traditional houses and has a unique culture, strategic location, and is visited by many tourists. This traditional village is one of the cultural sites in West Sumba Regency, and has been designated by the Tebara Village Government as a tourist attraction based on the Authority for Indigenous Rights and Village-Scale Local Authority (Tebara Village Regulation No.2 of 2018) and has been professionally managed by
the village-owned enterprises of Iyya Tekki in the Village of Tebara.
The increasing number of tourist visits each year does not guarantee the number of visits will always be consistent in the future without the innovation of tourism products, competitive advantage and quality services. In addition, the existence of similar traditional or traditional villages in West Sumba can be a challenge for destination managers in reaching the market to be able to maintain the number of tourist visits. Based on this rationale, it is important to analyze of the influence of tourist motivation on satisfaction and revisit intention to Prai Ijing Traditional Village. Therefore, by knowing the relationship and the influence of motivation, tourist satisfaction and revisit intention, it is is expected to be a material consideration for managers to determine the target market in terms of a more effective promotion strategy, the provision of innovative, targeted and sustainable cultural tourism products in accordance with the local wisdom of the Prai Ijing Traditional Village.
Reseach Objectives
Objectives of the research are:
-
1. To analyze the influence of tourist motivation on satisfaction
-
2. To analyze the influence of tourist satisfaction on intention to revisit to Prai Ijing Traditional Village.
LITERATURE REVIEW
Previous research
The research findings of Wiranatha, et.al (2016) show that intrinsic motivation significantly influences tourists' trust in diving activities, extrinsic motivation significantly affects
satisfaction, and tourist satisfaction in carrying out diving activities positively influences loyalty in conducting the next activities.
Suryawardani, et.al (2017) suggest that intrinsic and extrinsic motivation significantly influence the loyalty of foreign tourists visiting nature-based tourism which is mediated by tourist satisfaction. Khuong, et.al (2014) found push and pull variables to have a significant influence on tourists' satisfaction and revisit intention to Vietnam.
Pratminingsih, et.al. (2014) shows that motivation and destination image influence the assessment of tourists so that it has implications for tourists' revisit intention to Bandung. Abiyasa (2018) in his article shows that external motivation does not significantly influence tourist loyalty.
Kencana, et.al (2017) shows that tourist perceptions about the tourist destinations of Uluwatu Temple and Taman Ayun Temple are significantly influenced by their internal motivation and external motivation, in which the influence of internal motivation is more dominant than the influence of external motivation. The level of tourist satisfaction is significantly influenced by the perceptions of the two tourist destinations and their external motivation.
Tourist Motivation
Mc. Donald and Yuan (1990) classify a person's motivation for tourism activities namely the push and pull factors. The push factor of traveling motivation consists of five categories, i.e:
-
a. Novelty and Knowledge Seeking, curiosity about an experience not previously obtained.
-
b. Rest and Relaxation, the desire to refresh and relax from a boring atmosphere due to routine activities.
-
c. Fulfilling the Dream, the desire to make a trip to realize the dream that had been planned in advance.
-
d. Adventure and Exploration, the desire to travel and seek adventure and explore things that are not yet known.
-
e. Prestige, the desire to travel is only to increase prestige by visiting tourist destinations to improve social status.
The attracting or pull factors of tourists doing tourist activities, consisting of:
-
a. Safety, Cleanliness, and Variety of Attraction relating to the safety, cleanliness and diversity of attractions offered by a tourist attraction.
-
b. Events and Activities, namely factors related to activities where the role of tourists is directly involved when the activity takes place.
-
c. Affordable Price, which is a factor related to the affordability of prices for tourists charged by managers of tourism activities when they participate in these activities.
-
d. Travel Arrangement, which is a factor in which there is travel or hotel involvement in packaging and promoting a tourist activity to tourists.
Tourist Satisfaction
According to Kotler (2002) tourist satisfaction is a person's feelings that arise after comparing expectations with reality experienced. Consumers will feel satisfied http://ojs.unud.ac.id/index.php/eot
if their expectations are in accordance with reality. Meanwhile, if the expectations are not in accordance with reality, consumers will feel dissatisfied.
Intention to Revisit
Sonmez and Graeffe (1998) suggest that travel activities that have been carried out previously at a destination will encourage the intention of tourists to come and carry out tourism activities at the destination. Umar, 2003 (in Purbawisesa, 2014) suggests that the intention to re-visit a destination is considered a form of response in deciding a travel plan for the same tourist destination. The decision to buy the same tourism product is influenced by how much the tourists are satisfied or not with the services given during the trip, thus the behavior of tourists also influences the revisit intention.
RESEARCH METHOD
This research was conducted in the Traditional Village of Prai Ijing, Kota Waikabubak Sub-District, West Sumba Regency, East Nusa Tenggara. The population in this study were tourists visiting the Prai Ijing Traditional Village. Determination of the number of samples using the recommended sample range of Structural Equation Modeling (SEM) 306 e-ISSN: 2407-392X. p-ISSN: 2541-0857
based on variants or Partial Least Square (PLS) ranges from 30 to 100 samples. This study used 100 respondents. Determination of the sample using accidental sampling technique, i.e. tourists who incidentally were found during the study period who met the criteria as respondents. Methods of data collection by distributing questionnaires, interviews, library research and documentation. The indicators used were 18 indicators divided into four variables. Exogenous latent variables consist of push and pull factors. Endogenous latent variables consist of tourist satisfaction variables and revisit intention variables. Table 1 research variables and indicators.
Table 1.Research Variables and Indicators
|
Variables |
Indicators |
Code |
Number of Indicators | |
|
Push |
1. |
Looking for |
PUS1 | |
|
Factors |
something new | |||
|
(PUSH) |
& interesting |
PUS2 | ||
|
2. |
Breaking away from routine |
PUS3 | ||
|
3. |
Visiting a |
PUS4 | ||
|
destination that has never been visited |
PUS5 |
5 | ||
|
4. |
Understanding different | |||
|
cultures | ||||
|
5. |
Raising prestige through documentation | |||
|
Pull |
1. |
Diversity of |
PUL1 | |
|
Factors |
attractions and | |||
|
(PULL) |
tourist activities |
PUL2 | ||
|
2. |
Visit historical |
PUL3 | ||
|
sites |
PUL4 |
4 | ||
|
3. |
Affordable | |||
|
custom clothing for rent | ||||
|
4. |
Attractive tour | |||
|
package variations | |
|
Tourist |
1. Satisfied with SAT1 |
|
Satisfac |
the experience |
|
tion |
of seeing the |
|
(SAT) |
architecture of a SAT2 |
|
traditional 5 | |
|
houses and a SAT3 | |
|
stone tombs | |
|
2. Satisfied with | |
|
the experience SAT4 | |
|
of seeing unique | |
|
customs and SAT5 | |
|
traditions | |
|
3. Satisfied with | |
|
attractions and | |
|
tourist activities | |
|
in the Prai Ijing | |
|
Traditional | |
|
Village | |
|
4. Satisfied with | |
|
the hospitality of | |
|
the local | |
|
community | |
|
5. Satisfied with | |
|
the choice of | |
|
visiting the Prai | |
|
Ijing Traditional | |
|
Village | |
|
1. Traditional | |
|
Revisit |
Village of Prai REV |
|
Intentio |
Ijing has a 1 |
|
n |
unique tourist 4 |
|
(REV) |
attraction REV |
|
2. The desire to 2 | |
|
visit the Prai | |
|
Ijing REV | |
|
ITraditional 3 | |
|
Village | |
|
3. Share REV | |
|
experiences after 4 | |
|
their visits to | |
|
colleagues, | |
|
friends and | |
|
family | |
|
4. Recommend it | |
|
to colleagues, | |
|
friends and | |
|
family | |
|
Number of Indicators 18 | |
Source: Yuan, et al (1990); Kotler (2002);
Gieze, et al (2000); Sonmez (1998) and Umar (2003)
The data analysis used structural equation modeling (SEM) analysis by using Software of SmartPLS version 3.0 and descriptive qualitative analysis to describe the characteristics of respondents, interpret the results of SEM analysis, and test results of research hypotheses.
RESULTS
Characteristics of Respondents
Characteristics of foreign tourists by country of origin are mostly from France (22%), characteristics of domestic tourists based on city of origin are mostly from Jakarta (24%), female respondents (52%) are the most dominant by sex, and by age group , respondents aged 25-39 years old (56%) were the most dominant. Based on their level of education, Bachelor graduate respondents (50%) were the most, based on occupation, most respondents are private employees (38%), based on income, most respondents have an income of more than Rp. 3,500,000 (60%), based on how to obtain information about the Prai Ijing Traditional Village, most respondents obtained information from social media (33%), and based on travel organizing, most tourists used the services of a travel agent to arrange their trips (41%).
Validity and Reliability
Convergent validity test can be measured through two criteria, namely outer loading and Average Variance Extracted (AVE). A reflexive indicator is high if it correlates> 0.70 with the measured variable (Ghozali, 2014). According to Sarwono (2015) outer loading with a value of 0.69 is considered sufficient. AVE value> 0.5 indicates adequate convergent validity (Sarwono, 2015). In the sub-model analysis there are five indicators which have a value <0.69 so that they are eliminated and the measurement analysis is repeated. Table 2 shows the convergent validity test.
Table 2. Convergent Validity Test
|
AVE |
PUL |
PUS |
SAT |
REV | |
|
0,762 |
PUL1 |
0,888 | |||
|
PUL2 |
0,858 | ||||
|
0,579 |
PUS1 |
0.691 | |||
|
PUS2 |
0.759 | ||||
|
PUS3 |
0.826 | ||||
|
0,745 |
REV1 |
0.848 | |||
|
REV3 |
0.889 | ||||
|
REV4 |
0.853 | ||||
|
0,696 |
SAT1 |
0.822 | |||
|
SAT2 |
0.883 | ||||
|
SAT3 |
0.773 | ||||
|
SAT4 |
0.835 | ||||
|
SAT5 |
0.854 |
Discriminant validity according to Fornel and Larcker, 1981 (in Ghozali, 2014) can be seen in the value of cross
loading measurements with constructs. If the correlation of variables with measurement items is greater than the size of other variables, this indicates that the latent variable has good discriminant validity. Table 3 of discriminant validity test shows that all variables have good or valid discriminant validity values.
Table 3. Discriminant Validity Test
|
PUL |
PUS |
SAT |
REV | |
|
PUL1 |
0.888 |
0.539 |
0.396 |
0.432 |
|
PUL2 |
0.858 |
0.463 |
0.327 |
0.412 |
|
PUS2 |
0.362 |
0.691 |
0.275 |
0.216 |
|
PUS3 |
0.515 |
0.759 |
0,253 |
0.369 |
|
PUS4 |
0.435 |
0.826 |
0.336 |
0.418 |
|
REV1 |
0.425 |
0.440 |
0.564 |
0.848 |
|
REV2 |
0.339 |
0.422 |
0.501 |
0.889 |
|
REV4 |
0.478 |
0,409 |
0,560 |
0,853 |
|
SAT1 |
0.329 |
0,399 |
0,822 |
0,508 |
|
SAT2 |
0.324 |
0,361 |
0,883 |
0,570 |
|
SAT3 |
0.305 |
0,281 |
0,773 |
0,463 |
|
SAT4 |
0.362 |
0,270 |
0,835 |
0,486 |
|
SAT5 |
0.410 |
0,272 |
0,854 |
0,586 |
Reliability test can be seen through the composite reliability value. Chin, 1998 (in Ghozali, 2014) suggests that the recommended threshold value is > 0.60. Table 4 shows the composite reliability value> 0.60 and has fulfilled good variable reliability.
Table 4. Composite Reliability
|
Variables |
CR |
|
Push Factors (PUS) |
0.804 |
|
Pull Factors (PUL) |
0.865 |
|
Tourist Satisfaction |
0,919 |
|
Revisit Intention (REV) |
0,898 |
Analysis of Structural Equation Model
Results of Measurement Analysis (Outer Model)
The measurement model (outer model) shows the role of indicators in reflecting the variables formed or showing the relationship between variables with their constituent indicators (Suryawardani, 2018). The highest outer loading value on each variable can be interpreted as the indicator that best represents its constituent variables. The significance of this relationship was obtained through bootstrapping of 500 sub-samples and 5% of significance.
Measurement Model Test Results (outer model) on Tourist Motivation Variable
The output of the measurement model on the variable of push factor is reflected by five indicators and the pull factor variable is reflected by four indicators as described in Table 5 and Table 6.
|
Table 5. Output Model Measurement of Push Factors | |
|
Code |
Indicators Outer Loading Standard T Significancy Deviation Statistics |
|
PUS1 |
Looking for 0.651 0.158 4.133 Significant something new and interesting |
|
PUS2 |
Break away from 0.694 0.088 7.860 Significant routine |
|
PUS3 |
Visiting destinations 0.731 0.086 8.506 Significant that have never been visited |
|
PUS4 |
Understand different 0.793 0.054 14.716 Significant cultures |
|
PUS5 |
Raise prestige 0.479 0.149 3.210 Significant through documentation |
|
Code |
Table 6. Output Model Measurement of Pull Factor Indicators Outer Loading Standard T Statistics Significancy Deviation |
|
PUL1 |
Diversity of attractions and 0.776 0.057 Significant tourist activities 13.586 |
|
PUL2 |
Visit historical 0.841 0.056 Significant sites 15.135 |
|
PUL3 |
Affordable 0.668 0.105 Significant custom clothing 6.366 rental |
|
PUL4 |
An interesting 0.636 0.131 Significant variety of tour 4.844 packages |
As can be seen in the Table 5 and Tale 6, the indicators of understanding different cultures (PUS4) with a value of 0.793, which is the indicator that best represents the push factor variable. Table 6 shows the indicator of visiting historic sites (PUL2) with a value of 0.841, which is the indicator that best represents the pull factor variable. Therefore, the management of tourist destinations together with the local community is expected to always maintain the preservation, uniqueness, and cultural authenticity which are the main assets and attractions for tourists visiting the Prai Ijing Traditional Village.
Results of Measurement Model (Outer Model) on the Tourist Satisfaction Variable
The output of the measurement model on the tourist satisfaction variable is described in Table 7. The indicator of being satisfied with the experience of seeing unique customs and traditions (SAT2) with a value of 0.882 is the most representative indicator of tourist satisfaction. The indicator of being satisfied with attractions and tourist activities in the Prai Ijing Traditional Village (SAT3) must be considered by the manager of the Prai Ijing Traditional Village because it has the smallest outer loading on the tourist satisfaction
variables. The manager of the tourist destination is expected to increase the diversity of attractions and tourist activities as well as offer unique and innovative cultural tourism products to increase the satisfaction of tourists visiting the Prai Ijing Traditional Village.
|
Table 7. Output Measurement Model of Tourist Satisfaction | |||||
|
Code |
Indicators |
Outer Loading |
Standard Deviation |
T Statistics |
Signifi cancy |
|
SAT1 |
Satisfied with the experienc e of seeing the architectu re of a traditional house and a stone tomb. |
0.819 |
0.049 |
16.7 53 |
Signi ficant |
|
SAT2 |
Satisfied with the |
0.882 |
0.029 |
30.3 72 |
Signi ficant |
|
experienc e of | |||||
|
seeing unique customs and traditions | |||||
|
SAT3 |
Satisfied with attractions and tourist activities |
0.773 |
0.052 |
14.8 18 |
Signi ficant |
|
SAT4 |
Satisfied with the |
0.836 |
0.037 |
22.3 61 |
Signi ficant |
|
experienc e of | |||||
|
unique attraction | |||||
SAT5 Satisfied 0.856 0.025 34.8 Signi
with the 93 ficant
choice of visiting the Prai Ijing Traditiona l Village
Results of Measurement Model (Outer Model) on the Revisit Intention Variable
The output of the measurement model on the variable of intention to revisit is reflected by four indicators. Table 8 shows that the indicator of respondents going to the Prai Ijing Traditional Village (REV2) is the indicator that best represents the variable of intention to revisit.
Table 8. Output Model Measurement of Revisit Intention
|
Code |
Indicators |
Outer Loading |
Standard Deviation |
T Statis tics |
Signi i fican cy |
|
REV1 |
Prai Ijing |
0,848 |
0,034 |
24, |
Signi |
|
Traditional Village has unique tourist attractions |
707 |
ficant | |||
|
REV2 |
The desire |
0,865 |
0,044 |
19, |
Signi |
|
to visit Prai Ijing Traditional Village |
825 |
ficant | |||
|
REV3 |
Share |
0,653 |
0,102 |
6,4 |
Signi |
|
experience s after visiting the traditional village to colleagues, |
05 |
ficant |
friends & family
d the 185Signi
traditional ficant
family
Results of Structural Model (Inner
Model)
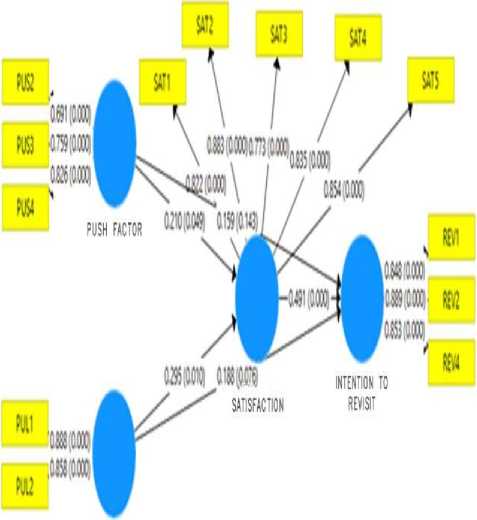
Output of the structural model
(inner Model) figure after bootstrapping
500 times can be seen in Figure 1.
PULl PACLOP
Figure 1. Output Results of Structural Equation Model of the Research
Analysis of the structural model (inner model) shows the correlation between one variable with another
variable. Ghozali (2014) suggests that the structural model is evaluated by looking at R2 for endogenous latent variables and path coefficient estimation.
The R2 is 0.67; 0.33; and 0.19 respectively are said to be good, moderate and weak. In the structural model there are two R2 values, namely the endogenous variable satisfaction (SAT) and the endogenous variable intention to revisit (REV). R2 value of satisfaction variable of 0.243 means that satisfaction variable can be explained by variable of tourists' motivation factor by 24.3% while 75.7% is explained by other variables not examined in this study. R2 value of revisit intention variable of 0.482 means the revisit intention variable can be explained by the tourist satisfaction variable of 48.2%. The estimated value of the relationship between variables in the structural model is shown through direct effect and indirect effect with the criterion of a significance level of 5% .
Direct Effect of Exogenous Variables on Endogenous Variables
The direct effect is the influence of exogenous variables to endogenous variables, which are correlated directly without the mediating variables.
|
Table 9. |
Direct Effect | ||||
|
Hipo-thesis |
Direct Effect |
Original Samp (O) |
Standard of Deviation |
T Statistics (|O/STDEV|) |
P Values |
|
H1 |
PUS--> SAT |
0.210 |
0.107 |
1.969 |
0.049 |
|
H2 |
PUL--> SAT |
0.295 |
0.115 |
2.569 |
0.010 |
|
H3 |
SAT--> REV |
0.491 |
0.103 |
4.786 |
0.000 |
|
H4 |
PUS--> REV |
0.159 |
0.108 |
1.468 |
0.143 |
|
H5 |
PUL--> REV |
0.188 |
0.106 |
1.779 |
0.076 |
Based on direct effect, there are two variables that are at a significance level of> 5%, namely the effect of push factor variables on the intention to revisit variable with p values of 0.143 and the pull factor variable on the intention to revisit with p values of 0.076. This shows that hypotheses four and five, namely the push factor and the pull factor do not significantly effect on the revisit intention of tourists to the Prai Ijing Traditional Village.
Indirect effect of exogenous variables on endogenous variables
Indirect effect is the influence of exogenous variables to endogenous variables which are correlated through
mediating variables.
Table 10. Indirect Effect
|
Indirect Effect |
Original Samp (O) |
STDEV |
T Statistics (|O/STDEV) |
P Values |
|
PUS-> SAT->REV |
0.103 |
0.064 |
1.619 |
0.106 |
|
PUL-> SAT->REV |
0.145 |
0.059 |
2.442 |
0.015 |
Table 10 shows the push factor variables did not significantly influence the variable of revisit intention through mediation of tourist satisfaction with a significance level of > 5%. The pull factor variables significantly influence the revisit intention through mediation of tourist satisfaction, with a significance level of <5%.
Structural Model Feasibility Analysis Results
Before interpreting the results of the structural equation model analysis of this study, several researchers (Chin, 1998; Hair et al, 2012; Henseler et al, 2009 in Suryawardani, 2018) recommend that the feasibility of the model should be examined. Table 11 shows the measures commonly used to assess the feasibility of structural models, analyzed by SEM Smart PLS models.
Table 11. Statistical Values for Assessing Model Feasibility
|
Variables |
Variable Type |
Number of Indicators |
AVE |
R2 |
|
Push Factors (PUS) |
Exogenous |
3 |
0.579 |
NAa |
|
Pull Factors (PUL) |
Exogenous |
2 |
0.762 |
NAa |
|
Tourist Satisfaction (SAT) |
Exogenous/ Endogenous |
5 |
0.696 |
0.243 |
|
Revisit Intention (REV) |
Endogenous |
3 |
0.745 |
0.482 |
|
Average |
- |
- |
0.695b |
0.363a |
|
Explanation: a : Value is not available because latency is an exogenous type b : The weighted average is the number of indicators | ||||
Based on Table 11, it was obtained the value of ̅̅̅̅̅̅ 0.695 and the value of ^^^^^^^^^^^^^^^^^~
0.363. To assess the feasibility of the structural equation model as a whole, the Goodness of Fit (GOF) value of the model by referring to the formula introduced by (Tanenhaus et.al 2005, in Suryawardani 2018) is as follows:
GoF = √̅̅̅̅̅̅̅̅̅̅̅̅̅̅̅̅̅̅̅ X ̅̅̅̅ = √̅̅̅̅̅̅ X ̅̅̅̅
In the equation above, ̅̅̅̅̅̅ is the weighted average value with the weight obtained from the number of indicators for each variable. Using this formula, the GOF value of the model is 0.503, a measure that exceeds the 0.50 value indicates that the model can be accepted and interpreted.
DISCUSSION
Push factors significantly influence tourist satisfaction. The push factor for visiting Prai Ijing Traditional Village is in line with tourists' expectations. The results of the analysis of the Structural Equation Model (SEM), the indicator of understanding different cultures has the highest reflexive value of the push factor variables, outer loading of 0.826.
Based on the characteristics of tourists visiting the Prai Ijing Traditional Village, most of them are from Jakarta and work as private employees. The fatigue of their daily activities made them so bored that they wanted to break away from their routine for a moment, who then planned a vacation to a destination or a tourist attraction they had never visited before. Likewise with foreign tourists, tourists who mostly visiting the Prai Ijing http://ojs.unud.ac.id/index.php/eot
Traditional Village come from France, which in this case is European tourists based on the typology of tourists belonging to the type of allocentric tourists namely tourists who are adventurous and are motivated to discover new things and unique that is not found in their home country. The majority of tourists visiting the Prai Ijing Traditional Village are 25 to 39 years old, who have a high curiosity in understanding and learning the culture of the destinations visited, which of course are unknown and different from their culture of origin.
Push factor has a significant effect on tourist satisfaction, as expressed by a tourist from Jakarta:
“The purpose of my trip to the Prai Ijing Traditional Village is to visit a tourist attraction that I have never visited. I see on Instagram many tourists visit here. In addition, I also want to refresh briefly from the routine of working in Jakarta. I take a week off from work to take a vacation”(an interview, March 2018).
Schiffman and Kanuk (in Nitisusastro, 2013) suggest that consumer behavior is a step taken by someone in order to meet their needs and desires which include, need recognition, pre purchase search, evaluation of alternatives, purchase (trial and repeat purchase), and post purchase evaluation. This shows that the push factor is at the 315 e-ISSN: 2407-392X. p-ISSN: 2541-0857
stage of need recognition, looking for information before buying (pre purchase search), namely finding information about the Prai Ijing Traditional Village, and evaluating several options (evaluations of alternatives) before deciding to visit the Prai Ijing Traditional Village.
This finding is relevant to previous findings by Khuong, et.al (2014) which shows the push factors had a significant influence on the satisfaction of tourists visiting Vietnam. In addition, it is also supported by previous research conducted by Wong, et.al (2017) that the push factor had a significant effect on the satisfaction of retired tourists who took part in the "Malaysia My Second Home" tourism program..
The pull factors have a significant effect on tourist satisfaction. This means that the pull factor in the form of attributes of the Prai Ijing Traditional Village tourist attraction is in accordance with tourist expectations. In the Structural Equation Model (SEM) analysis, the indicator of diversity of attractions and tourist activities has the highest reflexive value on the pull factors, with an outer loading of 0.888.
The pull factors of the Prai Ijing Traditional Village include a variety of attractions and tourist activities, as well as historical relics in the form of megalithic graves and traditional houses. The tourist http://ojs.unud.ac.id/index.php/eot
attractions and activities offered to tourists include taking photos in the photo spots that have been provided, photos wearing traditional West Sumba traditional clothes, seeing megalithic graves, obtaining an explanation from a tour guide about the history and philosophy of traditional house architecture and stone graves, seeing firsthand and practice of the process of making ikat woven cloth typical of West Sumba. Prai Ijing traditional village also offers a number of attractions and optional activities to tourists, including watching traditional dance performances and Pasola attractions. For tourists who want to feel the traditional atmosphere and closer interaction with the villagers, the management also provides tour packages to stay at people's homes.
Solomon (in Priansa, 2013) argues that consumer behavior is a stage that occurs when consumers choose, buy, use products or services, evaluate and spend the products and services they expect to be able to satisfy their needs. This shows that there is a connection or relationship between the process of formation of external motivation (pull factors) to the post-purchase evaluation.
The results of the study are relevant to the research of Kencana, et.al (2017) that the external motivation of foreign tourists influences the level of 316 e-ISSN: 2407-392X. p-ISSN: 2541-0857
tourist satisfaction in Badung Regency. Wiranatha, et al (2017) suggest that extrinsic motivation has a significant effect on the satisfaction of foreign tourists in diving activities in Bali.
Pull factors have a more significant influence on tourist satisfaction than push factors, which means that external motivation in the form of tourist attraction attributes in the Prai Ijing Traditional Village is considered more important than tourist motivation in increasing satisfaction, in other words, perceived satisfaction depends greatly on how well the tourist attractions meet their expectations. Tourist satisfaction has a significant effect on revisit intention. This means that the higher the satisfaction of tourists, the higher the revisit intention to the Prai Ijing Traditional Village. Analysis of Structural Equation Model (SEM) shows that the indicator of tourist satisfaction over the experience of seeing the uniqueness of customs and traditions has the highest reflexive value to the variable of tourist satisfaction, with outer loading of 0.883.
The results of the study support the statement of Umar (in Purbawisesa, 2014), revisit intention is a behavior that appears as a response to an object that indicates the customer's desire to make a repeat visit. The decision process of revisit is formed after the post-visit stage. http://ojs.unud.ac.id/index.php/eot
The level of tourist satisfaction or dissatisfaction that will affect the decision. If tourists feel satisfied because of tourism products and good service quality, they will show the opportunity to make a return visit. And tourists who are satisfied will also tend to say good things about the destinations or tourist attractions that they have visited.
The results of the study support the opinion that tourists' decision to visit a destination is a complex process. Referring to Kotler and Armstrong (in Pariansa, 2013) a person decides to buy a service or a product determined by several stages including problem recognition, information search, alternative evaluation, purchase decision and post-purchase evaluation. The level of tourist satisfaction perceived as having occurred after visiting the Prai Ijing Traditional Village is interpreted as the post-purchase evaluation stage, which is to decide to travel back to the same place.Previous research supporting this research was conducted by Andajani (2017) who suggests that satisfaction is an important factor in encouraging the revisit intention of foreign tourists to Indonesia.
Pratminingsih (2014) shows that satisfaction influences the revisit intention of foreign tourists to Bandung.
Push factors do not significantly influence revisit intention. This means that 317 e-ISSN: 2407-392X. p-ISSN: 2541-0857
the revisit intention to the Prai Ijing Traditional Village is not significantly influenced by push factors within tourists, such as breaking away from routine, visiting destinations that have never been visited, and understanding different cultures. Based on empirical findings, tourists who mostly come from outside the island of Sumba can be one of the factors that cause the push factor to have a significant effect on revisit intention. To be able to take a vacation to Sumba, especially to reach the Prai Ijing Traditional Village, they have to prepare a lot of free time and money. For example, to buy plane tickets from their area of origin to Sumba, accommodation, food and drink, and other travel costs. All of that must be prepared and planned carefully.
This finding is supported by the results of a previous study by Baniya, et.al (2017), regarding the influence of tourist motivation on the revisit intention of tourists to Nepal, suggesting that the push factor does not significantly influence the revisit intention of tourists to Nepal. The push factors indicators used in Baniya's research include relaxation and recreation, adding relationships, expanding social and cross-cultural relationships, fulfilling prestige and getting out of daily routines. The pull factor does not significantly influence revisit intention. This means that http://ojs.unud.ac.id/index.php/eot
the revisit intention to the Prai Ijing Traditional Village is not significantly influenced by the pull factor of the attributes of the Prai Ijing Traditional Village tourist attraction, namely the diversity of attractions and tourist activities and visiting historic sites. The results of the analysis show that the remaining reflexive indicators are not able to represent the pull factor variables, so it is necessary to add a variety of indicators that are in accordance with the conditions of tourist attraction, such as the hospitality of the local people, safety and comfort.
Empirical findings indicate that there are other factors that respondents consider more important in influencing revisit intentions that are not examined in this study, such as service quality, marketing mix, and destination image. This finding is supported by the results of previous research by Abiyasa, et.al (2018) which states that the external motivation variable in the form of Banyuwangi tourist destination attributes does not significantly influence tourist loyalty. Yap, et.al (2017) in his research on Intention to Revisit Penang: A Study of Push and Pull Factors in which the results show that the pull factor in the form of historical, cultural and natural landscape does not significantly influence revisit intention of tourists to Penang.
CONCLUSION
Based on the results and discussion described above, the following conclusions can be drawn: (i) the push factor has a significant effect on tourist satisfaction; (ii) the pull factor significantly influence tourist satisfaction; (iii) tourist satisfaction has a significant effect on revisit intention; (iv) push factors do not significantly influence revisit intention; (v) pull factors do not significantly influence revisit intention.
Managers are expected to explore the diversity of motivation of tourists visiting the Prai Ijing Traditional Village in order to increase the intention of tourists to revisit which can be obtained through interaction between local communities and tourists and also through guest comments given by tourists after visiting the Prai Ijing Traditional Village. Improving service quality, diversity of attractions and tourist activities in the Prai Ijing Traditional Village and offering unique and innovative cultural tourism handicraft products, and always maintaining local wisdom and cultural assets which are the main attraction of Prai Ijing Traditional Village so that tourists are expected to be more satisfied with the visiting experience to the Prai Ijing Traditional Village and in the end are able to increase the desire of tourists to http://ojs.unud.ac.id/index.php/eot
revisit. The limitation of the study is that there are five indicators declared invalid and reliable so that they are excluded from the structural model. This can be a recommendation for future researchers to conduct research by increasing the number of indicators on each variable of push factors, pull factors, tourist satisfaction and revisit intention. In addition, it is recommended to conduct research on broader destinations with varying attractiveness, so the results are expected to provide a deeper analysis of the structural models of tourist motivation in influencing satisfaction and revisit intention. The results of this research model obtained a Godness of Fit (GOF) value of 0.503 which means it is in the middle category, further research can add destination image variables and service quality so that it is expected to obtain strong structural model results.
REFERENCES
Abiyasa, A., & Pangestuti, E. 2018.
Pengaruh Motivasi Eksternal terhadap Loyalitas Wisatawan dengan
Pengalaman Wisatawan sebagai
Variabel Interveting. (Survei pada Wisatawan Nusantara yang
Berkunjung ke Banyuwangi). Jurnal Administrasi Bisnis, 64(1): pp 52-59.
Andajani, E., Rahayu, S., & Widjaja, F. N. 2017. International Motivations and Revisit Intention to Indonesia. International Annual Symposium on Management (pp. 71-71). Department of Management, Faculty of Business & Economics, Universitas Surabaya.
Baniya, R., Ghimire, S., & Phuyal, S. 2017. Push and pull factors and their effects on international tourists’ revisit intention to Nepal. The Gaze: Journal of Tourism and
Hospitality, 8: pp 20-39.
Giese, Jhon L., dan Joseph A. Cote. 2000. Defining Consumer Satisfaction. Academic of Marketing Sciense Review.
Ghozali, I. 2014. Structural Equation Modelling Metode Alternatif dengan Partial Least Square Aplikasi. Cetakan ke empat. Semarang: Universitas Diponegoro.
Kencana, E. N., Jayanegara, K., Darmayanti, T., & Korespondesi, P. 2017. Kausalitas antara Motivasi, Persepsi dan Tingkat Kepuasan Wisatawan Mancanegara (Studi Kasus Pura Taman Ayu dan Pura Uluwatu). Naskah Lengkap Seminar Ilmiah Saintek 2017. Denpasar: Universitas Udayana.
Kotler, Philip. 2002. Marketing Management (Millenium Edition). Jakarta: Pearson Education and
Prehanllindo.
Khuong, M. N., & Ha, H. T. T. 2014. The Influences of Push and Pull Factors on the International Leisure Tourist Return Intention To Ho Chi Minh City, Vietnam—Mediation Analysis of Destination Satisfaction.
International Journal of Trade, Economics and Finance, 5(6): pp
490-496.
Nitisusatro, Mulyadi. 2013. Perilaku Konsumen dalam Perspeftif
Kewirairausahaan. Bandung:
Alfabeta.
Pratminingsih, et.al. 2014. Roles of Motivation and Destination Image in Predicting Tourist Revisit Intention: A Case of Bandung – Indonesia. International Journal of Innovation, Management and Technology. 5(1): pp 19-24.
Priansa, Donni Juni. 2017. Perilaku Konsumen dalam Persaingan Bisnis Kontemporer. Bandung: Alfabeta.
Purnami, A., and I G.A.O Suryawardani. 2018. The effect of the Quality Services on the Visitors’ Satisfaction and Desire to Pay a Revisit to the Bali Pulina Agrotourism. E-Journal Of Tourism. 5(2): pp 62-71.
Purbawisesa, Gusti Adi. 2014. “Citra Destinasi Wisata Daerah Istimewa Yogyakarta: Dalam Persepsi
Wisatawan Nusantara dan Penduduk Lokal”. Yogyakarta: Fakultas
Ekonomi Universitas Sanatha Darma.
Wiranatha, A.S., I G.A.O. Suryawardani. I K. G Bendesa and M. Antara. 2016. Model of Foreign Tourist Loyalty on Marine Tourism to Visit Bali. International Journal of
Multidiciplinary Educational
Research,3(2).
Sarwono, 2015. Membuat Skripsi, Tesis dan Disertasi dengan Partial Least Square SEM (PLS-SEM).
Yogyakarta: CV. Andi Offset.
Sonmez, S. And A.R. Graefe. 1998. Influence of Terrorism Risk on Foreign Tourism Decisions. Annals of Tourism Research, 25(1): pp 112-144.
Suryawardani. I G.A.O., A.S Wiranatha, I K.G. bandesa, M. Antara and Maria Gravari Barbass. 2017. Structural Model of Foreign Tourist’s Loyalty in Nature-based Toursm in Bali. International Journal of Apllied Business and Economic research,
15(9): pp 195-215.
Suryawardani. I G.A.O. 2018. Evaluation of marketing strategy of sanur village festival based on visitor’s bevaviour. International Journal of Applied Business and Economic Research. 16(2): pp 261-275.
Sonmez, S. And A.R. Graefe. 1998. Influence of Terrorism Risk on Foreign Tourism Decisions. Annals of Tourism Research, 25(1): pp 112-144.
Wong, B. K. M., Musa, G., & Taha, A. Z. 2017. Malaysia my second home: The influence of push and pull motivations on satisfaction. Tourism Management. 61: pp 394-410.
Yap, P. H., Teoh, Y. S., & Tan, H. J. 2017. “Intention to Revisit Penang: A Study of Push and Pull Factors” (disertasi). Penang: Tunku Abdul Rahman University.
Yuan, S., & Mcdonald, C. 1990.
Motivational Determinates of International pleasure Time. Journal of Travel, 29(1):pp 42-44.
http://ojs.unud.ac.id/index.php/eot
321
e-ISSN: 2407-392X. p-ISSN: 2541-0857
Discussion and feedback