Relationship between Marketing Mix and Cunsomers’ Loyalty of Hatten Wines Products
on
E-Journal of Tourism Vol.6. No.1. (2019): 139-146
Relationship between Marketing Mix and Cunsomers’ Loyalty of Hatten Wines Products
Ida Ayu Putu Citra Dewi 1 and I Gusti Ayu Oka Suryawardani 2
1Student at Agribusiness Study Program, Faculty of Agriculture, Udayana University - Bali
-
2Centre of Excellence in Tourism Udayana University - Bali
Corresponding author: iaputucitradewi@gmail.com
ARTICLE INFO ABSTRACT
Received 04 March 2019
Accepted
21 March 2019
Available online 31 March 2019
Hatten Wines is one of the alcoholic beverage products produced in Bali and owned by Balinese. Its role is very important as a substitute product for imported alcoholic beverage products. The research objectives are: (i) identifying the marketing mix variables that determine the purchasing decisions and loyalty to Hatten Wines products and their forming indicators, and (ii) investigating the roles of marketing mix on the customers' purchasing decisions and loyalty to Hatten Wines products. The study was conducted in Sanur, Kuta and Nusa Dua by distributing questionnaires to 100 foreign tourists. The data was analyzed based on the factor analysis by using SPSS program. The results of the study indicate that; (i) Marketing Mix variables that determine the purchasing decisions and product loyalty to Hatten Wines consist of products, prices, promotions, places and distribution. Product variables are formed from five indicators, namely brand, taste, packaging, aroma, and product variety. Price variables are formed from three indicators, namely affordability of prices, value for money, and price competitiveness. Promotion variables are formed from four indicators, namely promotion services, media promotion, promotion quality, and promotion quantity. Place and distribution variables are formed from three indicators, namely place of sale, product availability, and ease of access. (ii) Hatten Wines Marketing Mix plays a positive role and is significantly related to the consumers' purchasing decisions and loyalty in consuming Hatten Wines, which is 60.946%. The remaining 39.054% is influenced by other variables not included in the model.
Keywords: marketing mix, consumers’ loyalty, Hatten Wines, Bali.
INTRODUCTION
Background
The development of the tourism industry in Bali is beneficial in increasing income, employment opportunities and exchange rates. But not all the benefits of tourism are enjoyed by the Balinese people, some of these benefits are leak out of Bali's economic system in the form of tourism leakage. The results of the Suryawardani et al. (2016) regarding the calculation of Bali tourism leakage found that the average size of Bali tourism leakage from the sector of tourism was 20% and the highest leakage was in 4-star and 5-star hotel chains (55.3%). The research also found that the source of leakage was the use of imported beverages (64.1%), imported foods (20%) and foreign workers (2.1%). To minimize the leakage, the use of local beverage products is very important as a substitute product. One of the local beverage products that is currently developing is Hatten Wines. Bali as one of the tourist destinations both domestic and foreign, is very dependent on agricultural products, one of which is related to the provision of beverage products, namely wine for tourists. The latest data from the company Hatten Wines shows that since 2008 there has been a decrease in sales volume, one of the causes of which is a change in consumer behavior
which has implications in the development of marketing strategies which are related to the marketing mix, namely product, price, promotion, as well as place and distribution. Consumers have diverse perceptions in relation to purchasing decisions and loyalty to a product. Positive consumer perceptions of aspects of the marketing mix, can guarantee satisfaction in using the product so that it will continue to rebuy, and then trigger loyalty. Therefore, research on the role of the marketing mix on the consumers' purchasing decisions and loyalty to Hatten Wines products is very important in order to form a marketing strategy to increase the role of Hatten Wines products in the tourist market, especially foreign tourists.
Research Objectives
Based on the background already described, the objectives of this study are: 1. Identify marketing mix variables that determine the consumers' purchasing decisions and loyalty to Hatten Wines products and their forming indicators.
-
2. Finding out the importance of the perception of the marketing mix on the consumers' purchasing decisions and loyalty to products of Hatten Wines.
RESEARCH METHOD
Location and Time of Research
The research was conducted in Sanur, Kuta and Nusa Dua. Location selection was determined purposively and conducted in January and February 2017.
Data and Collection Methods
The types of data used in this study were qualitative data (general description of PT Hatten Bali and Hatten Wines products) and quantitative data (the results of the questionnaires). The primary data were obtained from respondents through questionnaires. Secondary data were obtained from books, websites, data from PT Hatten Bali, and the results of previous studies as references. Data collection was done through observation, interviews, questionnaires, and library research. Sampling was based on purposive sampling method. The samples studied were 100 foreign tourists who have consumed Hatten Wines. The distribution of sampling was carried out proportionally in the three research locations, namely 33.33 percent, then the number of samples in each study location were as follows: 33 samples in Nusa Dua, 33 samples in Kuta, and 34 samples in Sanur.
Research Variables and Indicators
Research variables and indicators are explained in Table 1.
Table 1. Research Variables and
Indicators
|
No |
Variables |
Indicators (Perception) |
|
Brand | ||
|
Taste | ||
|
1. |
Product |
Packaging |
|
Aroma | ||
|
Product | ||
|
variations | ||
|
Affordability of prices | ||
|
2. |
Price |
Value for money Price competitiveness |
|
Points of sale | ||
|
3. |
Location |
Product availability |
|
Ease of | ||
|
access | ||
|
Promotional | ||
|
services | ||
|
4. |
Promotion |
Promotion media Quality of promotion Promotion quantity |
|
Repurchasing | ||
|
5. |
Loyalty |
Promoting Recommending |
Measurement with a Likert scale
The indicators measured have five levels of preference answers with details as follows: very not good /strongly disagree (score 1), not good / disagree
(score 2), doubtful (score 3), good / agree (score 4), very good / strongly agree (score 5). Respondents' perceptions of the marketing mix, as well as consumers' purchasing decisions and loyalty to Hatten Wines' products were described quantitatively using class intervals by integrating the average score according to the assessment categories. These categories can be seen in Table 2.
Table 2. Scores Category of Consumer Perceptions on Hatten Wines Products
|
Score |
Interval of Score |
Category |
|
1 |
1 to <1,8 |
Very poor |
|
2 |
1,81 to <2,6 |
not good |
|
3 |
2,61 to <3,4 |
fair |
|
4 |
3,41 to <4,2 |
good |
|
5 |
4,21 < 5 |
very good |
|
Source: |
Usman, in Henrques (2014) | |
Data analysis
Data from questionnaires were processed by factor analysis using the SPSS 19 application, but the normality must be tested by the Kolmogorov-Smirnov test.
RESULTS AND DISCUSSION
Company Overview of Hatten Wines
PT Hatten Bali is one of the wine producers located in Bali. First established
in 1994 by Ida Bagus Rai Budarsa. PT Hatten Bali Plantation is located in Buleleng Regency. The factory and head office are located in Sanur. Hatten Wines consists of several products including Rose, Aga White, Aga Red, Alexandria, Tunjung, Jepun, and Pino de Bali, and other brands namely Two Islands, Dragonfly Moscato, and Dewi Sri. Grape varieties grown in Bali are local Blue Probolinggo, local black grapes of Alphonse-Lavallée, French Table Grapes, and local Belgian white grapes.
Characteristics of Respondents
Characteristics based on citizenship
Most respondents are Australian citizens (20%). Followed by the Netherlands (10%), Norway (10%), France (7%), United States (6%), New Zealand (6%), Canada (5%), Belgium (4%), United Kingdom (4%) ), Italy (4%), Germany (4%), Poland (4%), Austria (3%), Switzerland (3%), Denmark (2%), Finland (2%), Hong Kong, (2%) , Singapore (2%), and Sweden (2%).
Characteristics based on Place to Stay
Most respondents live in starred hotels (57%). Followed by villas (15%), lodging (14%), non-star hotels (11%), and others (3%).
Characteristics by gender
Most of the percentage of respondents are female by 55% while men are 45%.
Characteristics based on age
Most respondents aged between 2655 years old (48%). Followed by respondents aged 17-25 years old (45%), more than 56 years old (7%), and no respondents who were less than 17 years old.
Characteristics based on arrival to Bali
Most of the respondents came to Bali with friends (38%). Followed by respondents who came with the group (29%), family (27%), and individual (6%).
Characteristics by occupation
Most of the respondents are students (35%). Followed by entrepreneurs (15%), professionals / managers / executives (13%), private employees (12%), housewives (10%), government employees (7%), retirees (5%), others (3%), and no respondent is a police or a soldier.
Characteristics based on the period of visit
Most respondents visited Bali more than 5 times (31%). Followed by a second visit (18%), first time (14%), fourth time http://ojs.unud.ac.id/index.php/eot
(14%), fifth time (10%), and third time (13%).
Research Instrument Test Results
Data Normality Test
Normality test using the Kolmogorov-Smirnov test. The results of the study indicate that all indicators have a Sig. > 0.05 means fulfilling the
assumption of normality.
Validity test
The results of the study show that all questions have r count values> r table means valid and can be used in research.
Reliability Test
The results of the study show that all items of the research question have Cronbach's Alpha coefficient values > 0.60 which means reliable and can be used in research.
Consumers' perceptions of Hatten Wines Products
Respondents have good perceptions of product components consisting of five indicators, namely brand, taste, packaging, aroma, and product variation with a score of 4.1 means that respondents like the Hatten Wines product components.
Consumers' perceptions of the price of Hatten Wines products
Respondents have a good perception of the price component which consists of three indicators, namely affordability of price, value for money, and price competitiveness with a score of 3.9 means that respondents like the price components of the Hatten Wines product.
Consumers' perceptions of the promotion of Hatten Wines products
Respondents have a good perception of the promotion component which consists of four indicators, namely promotional services, media promotion, quality promotion, and quantity of promotion with a score of 4.0 means that respondents like the promotion component of the Hatten Wines product.
Consumer perceptions of the location and distribution of Hatten Wines products
Respondents have a good perception of the place and distribution components which consist of three indicators, namely the place of sale, product availability, and ease of access with a score of 3.7 means that respondents like the place component and distribution of the Hatten Wines product.
Consumers' purchasing decisions and consumer loyalty to Hatten Wines products
Purchasing decisions and consumer loyalty are classified as high with a score of 3.9, where each indicator, namely rebuy, promoting, and recommending to others has a score that is in the high category too. This means that respondents have a high tendency to make decisions to buy and are loyal to Hatten Wines products. Most respondents said they would rebuy (59%), followed by promoting (26%), and recommending (15%). Chien-Hsiung (2011) classifies consumer loyalty into three categories, namely rebuy, promote and recommend products. The results showed that the highest stages of consumer loyalty to Hatten Wines products were at the initial stage of rebuying.
The Roles of Marketing Mix Variables in Purchasing Decisions, and Consumers' Loyalty to Hatten Wines Products
Variable determination test
KMO MSA values 0.806> 0.5 and Sig. (p) 0,000 <0,05 and the value of MSA per indicator all has a value > 0.5 which can be concluded that all indicators are feasible to be analyzed further.
The value of eigenvalues as forming variables
Based on the results of the study four variables have been formed (because
loyalty to Hatten Wines products, while the remaining 39,054% are influenced by other variables not included in the model.
it has an initial eigenvalues in total ≥ 1).
The role of each indicator in forming
Variation of eigenvalues for each variable variables
formed, namely variable 1 has initial eigenvalues in total of 4.816, variable 2 of 1.645, variable 3 of 1.472, and variable 4 of 1.209. The results showed that variable
The limiting number so that an indicator can be clearly included in a variable is 0.5 (Santoso, 2015). Based on the rotation results all indicators have a factor loading value of
1 was the biggest determinant of the four
more than 0.5 which indicates that all
marketing mix variables with a percentage
indicators have a strong relationship with the
of variance of 32.110%, followed by variable 2 (10.968%), variable 3 (9.810%), and variable 4 (8.058%). Based on the total variance value it can be seen that the total variance value is 60.946%, which means variables 1, 2, 3 and 4 can explain its role in determining the consumers' purchasing decisions and
variables formed. Variable 1 is called a product variable that is formed from 5 indicators, variable 2 is called a price variable formed from 3 indicators, variable 3 is called a promotion variable formed from 4 indicators, then variable 4 is called a place and distribution variable which is formed from 3 indicators. Based on the previous explanation, a model can be made as shown in Figure 1.
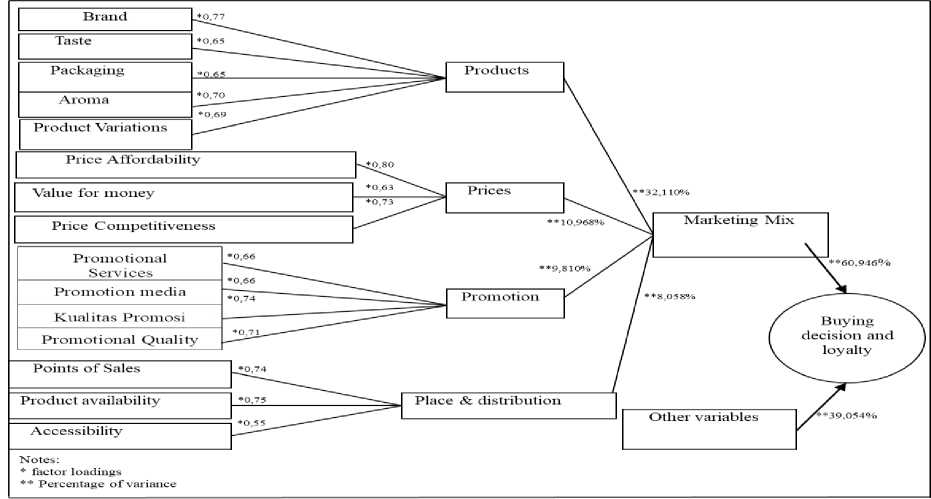
Figure 1. The Roles of Marketing Mix in Consumers' Purchasing Decisions and Loyalty to Products of Hatten Wines
Based on Figure 1, it can be seen that of the four variables formed, the variables that have the greatest role level are products (32,110%), followed by prices (10.968%), promotions (9.810%), and place and distribution (8.058%). The total role of these variables is shown by the total variance value of 60.946%, which means that the marketing mix perception variables that determine the consumers' purchasing decisions and loyalty to Hatten Wines products can be explained by 60.946% by product variables, price variables, promotion variables, and variables of place and distribution. The rest is influenced by other variables that have not been included in the model at 39,054%.
CONCLUSIONS
-
1. The Marketing Mix variables that determine the purchasing decisions and product loyalty of Hatten Wines consist of products, prices, promotions, and places and distribution. Product variables are formed from five indicators, namely brand, taste, packaging, aroma, and product variety. Price variables are formed from three indicators, namely affordability, value for money, and price competitiveness. Promotion variables are formed from four indicators, namely promotion services, media promotion, promotion quality, and promotion quantity. Place and distribution variables are formed from three indicators, namely the
points of sale, product availability, and ease of access.
-
2. Marketing Mix of Hatten Wines contributes positively and significantly related to the consumers' purchase decision and loyalty to consuming Hatten Wines, amounting to 60.946%. The remaining amount of (39.054%) is influenced by other variables not included in the model.
SUGGESTION
PT Hatten Bali should increase the roles of Marketing Mix in marketing its products by adding variety of products in order to increase market segmentation.
REFERENCES
Chien-Hsiung, L. (2011) ‘A study on the relationship between the brand image and customer satisfaction in the catering businesses’, African Journal of Business Management. Academic Journals, 5(18), pp. 7732–7739.
Henrques, F. D. C. (2014) Effect of Education and Training Programs on Employee Performance (Case Study on Instituto Nacional da
administração Publica Timor Leste).
Santoso, S. (2015) ‘Menguasai Statistik Multivariat’, Jakarta: PT Elex Media Komputindo.
Suryawardani, I. G. A. et al. (2016) ‘Implementation of Social Accounting Matrix in Calculating Tourism Leakage of Accomodation in Bali’, International Journal of Applied Business and Economic Research, 14(13), pp. 9377–9405.
http://ojs.unud.ac.id/index.php/eot
146
e-ISSN: 2407-392X. p-ISSN: 2541-0857
Discussion and feedback