Sports Event Satisfaction and Word-of-Mouth Intention
on
E-Journal of Tourism Vol.10. No.2. (2023): 251-274
Sports Event Satisfaction and Word-of-Mouth Intention: Evidence from the 2018 Asian Games International Participants and Spectators
Mohamad Dian Revindo1*, Amalia Adininggar Widyasanti2, Nalindro Nusantoro1, Chairina Hanum Siregar3
-
1 School of Strategic and Global Studies, Universitas Indonesia (SKSG UI)
-
2 Ministry of National Development Planning (BAPPENAS)
-
3 LPEM FEB UI
*Corresponding Author: revindo.md@gmail.com
DOI: https://doi.org/10.24922/eot.v10i2.102208
Article Info
Submitted:
June 5th 2023
Accepted:
September 20th 2023
Published:
September 30th 2023
Abstract
A mega sports event is expected to bring immediate and long-term impact on the host country’s economy. In this study, we explore one of the possible long-term outcomes of the Jakarta-Palembang 2018 Asian Games in the tourism sector by estimating the factors influencing the intention of its international spectators and participants in spreading positive word-of-mouth (WOM) about Indonesia to their respective relatives, friends, and colleagues after the event. Based on the face-to-face survey conducted during the event, there were 1,914 usable responses from international athletes, country officials, committees-sport federations, journalists, and spectators. The results show that the respondents were more likely to spread positive WOM if they were male, had never traveled to Indonesia, had the experience of participating in other international sports events, were relatively older, had long periods of stay in Indonesia during the visit, and participated in the event as a non-athlete. Furthermore, satisfaction with the provisions of facilities, including venues, food and accommodations, telecommunications and internet access, easy match scheduling, safety and security, information services, and transportation arrangements, had positive effects on their intention to spread positive WOM, although only the last two factors were statistically significant. This paper also discusses the policy and academic implications of the findings.
Keywords: asian games; sports tourism; satisfaction; word-of mouth;
Indonesia.
INTRODUCTION
Background
Sports tourism, another sector in the international travel and tourism business that includes travel for either observing or participating in sporting events, shows a significant development. The industry was
valued at USD800 billion globally (Orbis Research, 2018) and predicted to have an annual growth of 36% prior to the pandemic (Technavio Research, 2020). This sector initially involves the activity of observing or participating in sports events or simply touring sports attractions while visiting a tourist destination (Deply, 1998).
However, a more recent definition signifies that sports tourism does not automatically transpire in a tourist site (Schwark, 2007). The mega sports events fit better into this newer definition since most of them are organized and held in certain venues dedicated to sports. Overall, sports tourism is divided into three classifications: visits to sports attractions, attendance at sports events, and active participation.
Unsurprisingly, the last few decades have proven sports events to be an important segment within sports tourism (Roche et al., 2013), with sports competitions or events as the primary product in the spectator sports market (Fullerton and Mertz, 2008). It can be observed that there has been a steady increase in active participation in competition, both formally and informally, as teams and as individuals, over the years. The rising number of competitions, tournaments, and leagues in various sports disciplines leads to the increased number of participants and participation frequency, proving their contribution to supporting the development of the segment (Fullerton and Mertz, 2008).
Observed from the perspective of the economy, the main focus of concern of sports events is their impacts and benefits, specifically the immediate and future tangible and intangible impacts and benefits. To better understand the economic impact and benefit of a sporting event, we analyzed the events separately based on their three main stages, namely pre-, during-, and post-event stages. The pre-event stage consists of preliminary actions in preparing the events, including preparation of the venue, provision of public amenities, and stimulation of private sector investment, which can directly and indirectly yield economic impacts (Baade & Matheson, 2004; Davis, 2012; Müller et al., 2016; Solberg & Preuss, 2007).
In the during-event stage, the participants and tourists, both international and domestic counterparts, generate economic impacts through their consumption of local products and services, such as food and
beverages, souvenirs, and sporting goods which are essentially purchased by the participants, as well as leisure-related services such as transportation, accommodation, and restaurant services, which are required by tourists (Case, Dey, Hobbs, Hoolachan, & Wilcox, 2010; Case, Dey, Lu, Phang, & Schwanz, 2013; Preuss, 2005; Sato, Jordan, Kaplanidou, & Funk, 2014). Through the consumption of goods and services, businesses can generate increased revenue that simultaneously creates multiplier effects in the context of profits and employment for the upstream industries.
For the post-event stage, it includes the long-term economic implication of the event, including positive impact through the promotion of the travel and tourism sector, an increased number of jobs in the tourism sector, and a lessened seasonal impact on the number of visitations (Fourie & Santana-Gallego, 2011; Kasimati, 2003; Ritchie & Adair, 2004). Therefore, generally, the economic gains generated by sports events are comparatively greater than the benefits produced by non-sports events, as each stage of the sports events is able to induce more economic activities compared to the non-sports events (Man-zenreiter, 2002; Dayan, 1992; De Moragas, 1996).
Previous studies found that, in the long term, sports events may generate particularly positive economic impacts, starting from growing tourism activities and increased tourism-related employment, improvement of destination image, development of new infrastructure, improvement of public welfare, expansion of inward investment, and upgraded experience in hosting events (Roche et al., 2013; Kasimati, 2003; Muller et al., 2016; KPMG, 2018). With many sports fans living outside the hosting cities, sports events can induce a positive impact on the tourism sector within the host cities and their surrounding areas. This is also mentioned in Ritchie and Adair (2004), where sports events are said to help in increasing visitation to the related region, improving the image of the e-ISSN 2407-392X. p-ISSN 2541-0857
hosting location or destination, and reducing tourism seasonality.
In the course of the 1996 Centennial Olympic Games in Atlanta, for instance, in addition to 3.5 billion people of 214 countries watching the Games on television, approximately two million people were recorded to directly visit the host city. This resulted in a substantial rise in the tourism industry of the host city (De Knop and Standeven, 1999). Consequently, sports events are regarded as relatively efficient to engage the attention of worldwide spectators to visit or merely learn more about the host city as a result of the fairly substantial media branding or value that these events bring (Chalip et al., 2003; Chalip et al., 2005; Green et al., 2003; Roche, 2002; Ritchie and Smith, 1991; Xing and Chalip, 2006). It is hoped that sports events catch the attention of official partners and sponsors in addition to drawing the interest of foreign tourists and media. Vico et al. (2018) revealed that the main beneficiaries of the 2014 FIFA World Cup in Brazil include FIFA and their business partners, such as Coca-Cola, McDonald’s, Budweiser, and Visa. This observation has led to intense competition among cities and countries to be able to host large sports events in an attempt to benefit from the potential economic impact generated from the spending incurred by visitors and the increased opportunities to engage future investors and visitors.
Sports events are also said to produce a demand-stimulating effect that occurs in the hosting country’s tourism from the pre-event, during-event, and post-event (Muller et al., 2016). As observed in many cases, an increasing number of tourists and tourists’ length of stay emerged as a result of the demand-stimulating effect. Sports events are also found to improve the image
of the hosting region or destination and eventually raise the number of visitors (Roche, 2013). Meanwhile, Fouri and Santana-Gallego (2011) further explained that mega-sport events can be used to promote tourism; however, the magnitude of the impact may vary as it is determined by the type, the timing (peak season or off-season), and the countries participating in the event.
Hence, economic development can be triggered by the increase in economic activities, and the impact can continue long after the event is completed. The long-run impact of sports events may occur when tourists from the event revisit the host area, and the exposure of the area through the media reporting the event may prompt new tourists to come. If the initial exposure is managed well, the potential for sustainable tourist city development can be realized.
This study specifically observes the long-term economic impact of the 2018 Asian Games held in Jakarta and Palembang, Indonesia, through increasing future tourist’s visitation and stronger country image affected by positive word-of-mouth spread by international spectators and par-ticipants.vThis continental multi-sports event is held every four years as part of the official agenda of Olympic Council of Asia (OCA) and involves all countries in Asia. Indonesia was selected as the host country for the event in 2018, or officially named the 18th Asian Games Jakarta-Palembang 2018. The event was held in three provinces, namely DKI Jakarta and South Sumatra as the host regions and West Java as the supporting region, from August 18 to September 21.
The 18th Asian Games Jakarta-Palembang 2018 was considered to be the largest Asian Games in history, with 11,478 athletes from 45 countries in Asia
competing in 465 events and 40 types of sports. The number of athletes participating in the event surpasses the previous series of events, including the 2014 Asian Games in Incheon (South Korea), the 2010 Asian Games in Guangzhou (China), and the 2006 Asian Games in Doha (Qatar), and was comparable to 11,238 athletes competing in the 2016 Summer Olympics in Rio de Janeiro (Brazil). In addition to the hundreds of OCA officials and representatives of international sports federations for each branch of sports, there were 1,149 country officials from the participating countries that joined in the 2018 Asian Games.
Furthermore, approximately 13,000 local committees were involved in ensuring the successful run of the event, comprising the Indonesia Asian Games Organizing Committee (INASGOC) and its volunteers, excluding community organizations and task forces from various government institutions assisting in realizing the Games. The event was deemed successful in attracting worldwide attention, including not only Asian-based media but also international media across the globe. The event also engaged approximately 79,000 international tourists visiting Indonesia specifically to watch the matches. Taking the magnitude of the 2018 Asian Games into account, estimating its impact on the economy is a crucial matter. The magnitude of the economic impact of a sports event on the host country is a typical quality to measure the success of the host country in hosting the event. It can serve as a reference to help the government plan similar events in the future.
The medium- and long-term effects of the 2018 Asian Games include improved branding of the image of Indonesia to the whole world, which is expected to draw more foreign tourists to Indonesia. The 2018 Asian Games may have a positive impact on future tourist visits through at least three channels: improved image and information about Indonesia on the international stage; revisits of the international
participants and spectators for tourism purposes; and positive word-of-mouth recommendations made by the international participants and spectators to their respective colleagues and families.
This study offered fivefold contributions. First, this study estimates the economic impact using microdata obtained from face-to-face interview in the course of the event, rather than using macrodata and an aggregate-level approach (as previously conducted by Haddad and Haddad, 2010; Daniels et al., 2004; Lee and Taylor, 2005). Second, this study adds to the particularly inadequate study on the 2018 Asian Games, which has received insufficient attention with the exception of studies by Revindo, et al., (2021) that examined the determinants of international visitor spending, Revindo, et al., (2019) that elaborated the probability of revisitation, and Wikarya (2022) that looked at the impact of the event on local businesses.
LITERATURE REVIEW
Attendees’ Characteristics, Experience, Expectations, and Event Satisfaction
The primary factor that may entice sports tourists to return to a country that hosted sports events is their overall experience. Zhang et al. (2014) deemed a positive experience from attendance at sports events a critical indicator of the likelihood that sports fans will attend future events. Additionally, Shonk (2006) demonstrated that the quality of sport tourism perceived by tourists provides a considerable impact on their satisfaction levels. Furthermore, satisfaction plays a crucial role in determining whether tourists are willing to revisit a sports event or a specific area. Zhou (2015) stated the five factors accounting for the experience that the tourists expect to obtain from sports events: efficiency and enjoyment, knowledge, authenticity, socialization, and comfort. Such experience could also be obtained from activities (Palrao and Filipe, 2017; Kurtzman & Zau-har, 1997; Hinch & Hugham, 2001) and e-ISSN 2407-392X. p-ISSN 2541-0857
people (Hinch & Higham, 2001; Gammon & Rawshaw, 2013). Other studies discovered that such experience also originated from the location and interaction with the place (Palrao and Filipe, 2016; Standeven & Knop, 1999; Weed and Bull, 2004).
The cultural background and heritage of sports tourists also influence tourists’ satisfaction and experiences. Zhou (2015) conducted a study on the behavior of tourists in the course of the ATP Masters 1000 in Shanghai, differentiating between two groups: Chinese (local) tourists and foreign tourists. The results indicate that both groups had distinct attitudes toward evaluating the services quality, satisfaction levels, and future intentions to revisit the hosting city.
Medium-term and Long-term Potential Impact: Behavioral Intention
Viglia et al. (2016) suggest that Word-of-Mouth (WOM) is the act of sharing a consumer's experience with other consumers. According to Wang et al. (2017), WOM is a valuable source of information that can assist individuals in evaluating the quality of a service, obtaining information about a service, and, in turn, influencing their intention to use it.
Tourist Characteristics
Stabler (1995) specifies that certain characteristics, including age, gender, education level, occupation, and social class have an impact on the perception of an individual regarding particular locations.
Perceived Environmental, Perceived Quality, and Perceived Value
Perception refers to a process through which individuals opt for, sort out, and make sense of incoming information to form an image. This process is not solely dependent on a specific stimulus; it is also influenced by stimuli that are generally associated with the environment and the characteristics and circumstances of an individual. As a result, the processes of perception regarding certain attention, http://ojs.unud.ac.id/index.php/eot
distortion, and retention may differ from one individual to another (Kotler et al., 2000).
Walmsley and Jenkins (1992) conducted a study on various resorts in Australia and discovered that the image of certain locations perceived by tourists varied based on the gender and age of the tourists. However, Baloglu (1997) discovered statistically insignificant relationships between the image of the United States perceived among German tourists and demographic variables such as gender, education, and income. Baloglu and McCleary (1999) later revealed that the age and level of education of the tourists can influence their perception of the image of different tourist destinations. Similarly, Stern and Krakover (1993) observed that the level of education of tourists led to a substantial variation in their perceived image of a city. Examining the visual impact of tourism advertisements on the perception of image, MacKay and Fesenmaier (1997) discovered that age and marital status had no effect, while gender and income level did show statistically significant differences. Finally, Chen and Kerstetter (1999) found that the gender and family status of the tourists had a significant impact on their perceived image of Pennsylvania as a rural tourist destination.
Previous empirical studies have mostly looked at how cultural factors affect how tourists see a destination based on their geographical origin. Studies by Chen and Kerstetter (1999) and Calantone et al. (1989) revealed a correlation between the image perceived by tourists and their home countries. Likewise, Ahmed (1991) discovered that the residential region among North Americans significantly influences their perceived image of Utah. However, it is important to note that nationality is not equal to society which establishes its own social organizations and that the concept of culture is more closely tied to society than to a state or country of origin.
Satisfaction, Perception, Salience, and Loyalty
Simpson & Siguaw (2008) define salience as a transient mental state that becomes a significant component of one's self-concept. In the context of destination branding, salience, along with perceived brand image and quality, is used to measure destination brand equity, which can lead to brand loyalty (Boo et al., 2009; Konecnik, 2010; Lim and Weaver, 2014). Increased satisfaction with a destination can lead to higher levels of brand loyalty, which, in turn, can attract more customers in the future (Akroush, 2012; Kim et al., 2013). The intention of the tourists to revisit and recommend a destination to others reflects their level of brand loyalty (Oppermann, 2000; Faullant et al., 2008). Brand loyalty as stated by Pike et al. (2010) indicates the level of attachment of a tourist to a destination, which is measurable by visits, intention to visit, and word-of-mouth referrals. The importance of customer satisfaction as a determinant of loyalty has been widely recognized in relation to the availability of destination image (Sou and Wu, 2008; Alexandris et al., 2008). In addition, word-of-mouth has been identified as one of the most significant forms of loyalty, as recommendations from others can attract new customers (Faullant et al., 2008).
Brand salience has been emphasized as a result of effective advertising (Ehrenberg et al., 2000), and the role of brand salience has been discussed in the brand management literature (Keller and Davey, 2001; Romaniuk, 2002; Pike et al., 2010). Salience indicates the capacity of a product to be highly noticeable against its environment or background (Guido, 1998), and it is associated with the accessibility of
beliefs in long-term memory. The concept of salience has not been specifically examined in relation to local attractions. Observed from the perspective of destination branding theory, awareness is a pivotal factor in positive brand decision-making (Keller, 2003; Kapferer, 2004).
METHODS
Analytical Framework
The extant literature discussed in the previous section provides the building blocks to analyze the determinants of positive WOM intention after a sports event. Based on the extant literature, Figure 1 shows the analytical framework used in this study. International participants and spectators of sports event’ intention to spread positive WOM about the host country (Indonesia) is affected by three groups of determinants. First, several socio-demographic factors are expected to affect WOM intention, including individual characteristics such as age and gender as well as prior knowledge and information about the host country (Indonesia). The second group of determinants is the tourist-specific factors, including previous experience in participating in an international sports event, length of stay during the event in Indonesia, event location (whether in DKI Jakarta or Palembang Greater Areas), and event visitation purpose (whether as a competing athlete, officials, or spectators). Finally, satisfaction with the event is expected to positively affect WOM intention, including the perception of the provision of various event-related services and facilities by the organizing committee (perceived performance) and the perception of the host cities' public services and people (perceived values).
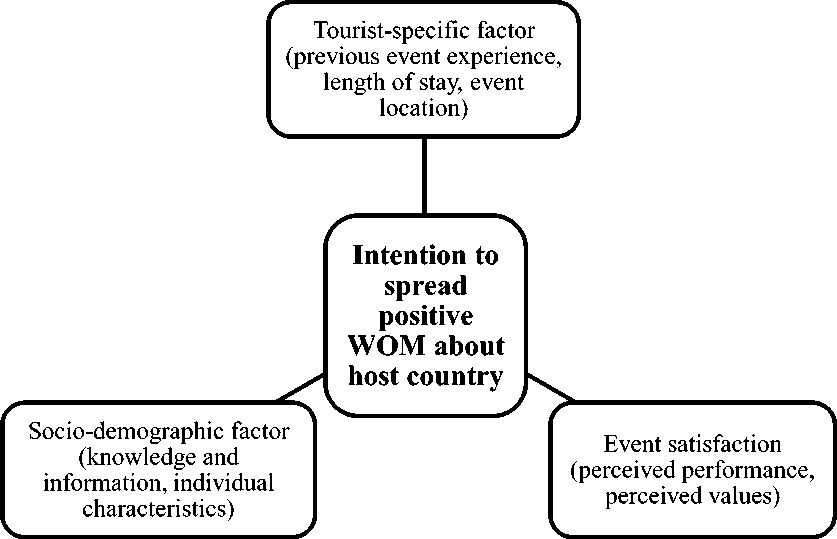
Figure 1. Analytical Framework of the Intention of Sports Event Participants and Spectators to Spread Positive WOM Data
This study employed primary and secondary data. The latter was comprised of a population list of five respondent groups: International Athletes (IAs), Foreign Country Officials (COs), International Journalists (IJs), International Spectators (ISs), and Olympic Council of Asia officials and International Sports Federations representatives (OCA-IFs). However, only the lists of IAs, COs, and OCA-IFs were provided by the Indonesian Asian Games Organizing Committee (INASGOC). These population lists served as the sample frame from which primary data was collected.
Primary data were collected using a structured questionnaire through face-to-face surveys conducted from August 19 to September 4, 2018 in various locations, including event venues, athlete's village (AV) in Jakarta and Palembang, and various cities in the Province of West Java, which co-hosted the games. The survey employed different sampling methods based on the respondent category. The survey on International Athletes (IAs) and Foreign Country Officials (COs) applied a proportional sampling method based on home country. The quota sampling method was used for International Journalists (IJs) and International Spectators (ISs), and the respondents were conveniently surveyed until the highest number of respondents from a country was reached in the absence of a population list. Due to the difficulty in organizing the appointments, the survey on representatives of Olympic Council of Asia officials and International Sports Federations (OCA-IFs) employed the convenience sampling method. Table 1 provides the population number of each respondent category and the sample obtained from the survey, resulting in a total of 1,914 completed and usable responses.
Table 1. Population and Sample of International Respondents Based on Type
|
Type of Respondents |
Total Population |
Respondents |
|
International Athletes (IAs) |
11,300 |
1,268 |
|
Foreign Country Officials (COs) |
1,149 |
261 |
|
International Journalists (IJs) |
5,000 |
121 |
|
International Spectators (ISs) |
78,854 |
218 |
|
Olympic Council of Asia & International Sports Federation Representatives (OCA-IFs) |
Unknown |
46 |
|
Total |
1,914 |
Note: The population of IAs and COs from 44 participating nations (excluding Indonesia) and IJs referred to INASGOC. The population of ISs referred to Widyasanti et al. (2019).
The structured questionnaire used in this study comprised five main sections. The first section aimed to collect general information about the respondents, including their names, nationalities, ages, genders, and contact details. The second section sought information on the arrival and departure dates of the respondents to and from Indonesia, their experience in attending or participating in international sports events, and their previous visits to Indonesia. The third section focused on the respondents' total expenditure during their stay in Indonesia, including a breakdown of spending on different goods and services. The fourth section of the questionnaire was dedicated to evaluating the organization of the 2018 Asian Games, with questions about the respondents' satisfaction levels concerning transportation arrangements, food and accommodation, safety and security, match schedules, information services, telecommunications, internet access, local culture (including local people, hospitality, and culinary offerings), and hosting cities (public utilities, traffic, and landscapes). Finally, the last section of the questionnaire explored the respondents' behavioral intentions, including their intention to return to Indonesia in the future for tourism purposes as well as their willingness to spread positive word-of-mouth about Indonesia. For the COs and OCA-IFs, there were additional questions about
whether they have the intention to support and vote for Indonesia should it bid on any future international sports event. For the COs, there was another question about whether they have the intention to use Indonesia as the training camp for their respective sports teams.
Before the event, drafts of questionnaire were tested on Indonesian athletes and sports federations. Afterward, the questionnaires were converted into a Computer-Assisted Personal Interview (CAPI) program, allowing a monitoring of the survey progress by the team in real-time. The CAPI system also enabled the team to offer immediate feedback to the enumerators, record voices, and verify the survey location coordinates.
Data Analysis
Descriptive
The dependent variable is qualitative and has a limited range of categories. The dependent variable yi is a binary choice of whether the international attendees will spread positive WOM about Indonesia to their respective colleagues and relatives after the event, comprised will recommend Indonesia or will not recommend Indonesia. Therefore, to predict the probability of respondent i in spreading WOM, we employ the binary logit regression model, given a given set of independent variables (tourist-related variables,
|
psychographic |
factors, and socio-demo- WOM (higher value of Pi implies higher | |
|
graphic variables), which is summarized as probability of spreading positive WOM), | ||
|
follows: |
and Z is a vector of independent variables, | |
|
P- = E(WOMINTENT- = 1) =__1τ- consisting of socio-demographic variables, | ||
|
1+e tourist-specific variables, and event satis- | ||
|
faction. The summary of the independent To explain this equation further, WOMINTENTi = 1 for ‘Yes’ and 0 for variables used in the analysis, along with their expected sign, is presented in Table 2. ‘No’; in which Pi = the estimated probabil- | ||
|
ity of respondent i in providing positive | ||
|
Table 2. Definition and Expected Signs of the Independent and Control Variables | ||
|
Variable |
Description |
Priori Sign |
|
Socio-demographic Variables | ||
|
Age |
Age of the respondent at the time of the survey |
+ |
|
Male |
Gender of the respondent (1 for male; 0 for otherwise) |
+ |
|
Experindo |
Past visit experience of the respondent to Indonesia (1 for ‘at least once’; 0 for ‘never’) |
- |
|
ASEAN |
The respondent’s country of origin (with 1 indicating ASEAN; 0 for Non-ASEAN) |
+/- |
|
Tourist-specific Variables | ||
|
Jakarta |
The venue location in which the respondent was interviewed (1 for Jakarta; 0 for Palembang) |
+/- |
|
LOS |
Duration of stay of the respondent in days |
+ |
|
Experevent |
Past visit experience of the respondent to an international sports event (1 for ‘at least once’; 0 for ‘never’) |
- |
|
D_CO |
Respondents belong to the ‘Country Officials’ category (1 for CO respondents, 0 for otherwise) |
+/- |
|
D_IS |
Respondents belong to the ‘International Spectators’ category (1 for IS respondents, 0 for otherwise) |
+/- |
|
D_IJ |
Respondents belong to the ‘International Journalists’ category (1 for IJ respondents, 0 for otherwise) |
+/- |
|
D_OCA |
Respondents belong to the ‘Olympic Committee of Asia & International Federation’ category (1 for OCA respondents, 0 for otherwise) |
+/- |
|
Event Satisfaction | ||
|
RTICT |
The evaluation of respondents of telecommunication and internet networks (Likert scale of 1-4, 1 for ‘very poor’ and 4 for `excellent’) |
+ |
|
RTTRANS |
The evaluation of respondents of transportation arrangements (Likert scale of 1-4, 1 for ‘very poor’ and 4 for `excellent’) |
+ |
|
RTSAF- |
The evaluation of respondents of safety and security (Likert |
+ |
|
SEC |
scale of 1-4, 1 for ‘very poor’ and 4 for `excellent’) | |
|
RTINFO |
The evaluation of respondents of the provision and access to information (Likert scale of 1-4, 1 for ‘very poor’ and 4 for `ex-cellent’) |
+ |
|
RTCUL |
The evaluation of respondents of the local culture (Likert scale of 1-4, 1 for ‘very poor’ and 4 for `excellent’) |
+ |
|
RTCITY |
The evaluation of respondents of the cities of Indonesia (Likert scale of 1-4, 1 for ‘very poor’ and 4 for `excellent’) |
+ |
RESULTS AND DISCUSSION
Respondents’ Background and Experience
Table 3 presents the total responses obtained from each respondent category based on their region of origin. The sample of each respondent category was spread across every sub-region in Asia, although comparing across sub-continents is not
within the scope of this study. It is important to note that respondents from beyond Asia were also included in the survey, considering that the 2018 Asian Games also drew the attention of spectators and journalists outside Asia. Furthermore, several country officials and OCA-IFs’ officials were hired professionally and originated from non-Asian countries.
|
Table 3. Obtained Sample by Type of Respondents and Regions | ||||||
|
Variable |
Description |
IAs |
COs |
IJs |
ISs |
OCA-IFs |
|
South East Asia (Malaysia, Singapore, Thailand, Brunei Darussalam, the Philippines, Vietnam, Cambodia, Laos, Myanmar, Timor Leste) |
304 |
67 |
27 |
49 |
11 | |
|
East Asia (China, Japan, South Korea, Hong Kong, Macau, Mongolia, North Korea, Taiwan) |
377 |
68 |
37 |
85 |
15 | |
|
Origin (count) |
South Asia (India, Sri Lanka, Pakistan, Bangladesh, Afghanistan, Nepal, Bhutan, Maldives) |
189 |
42 |
22 |
28 |
3 |
|
Central Asia (Uzbekistan, Afghanistan, Kazakhstan, Kyrgyzstan, Tajikistan, Turkmenistan) |
165 |
19 |
8 |
3 |
1 | |
|
Middle East (Saudi Arabia, Syria, Lebanon, Palestine, Jordan, Iraq, Yemen, Iran, Oman, United Arab Emirates, Qatar, Bahrain, Kuwait |
233 |
62 |
17 |
8 |
5 | |
|
Outside Asia (Europe, America, Africa, Australia & Oceania) |
3 |
10 |
45 |
11 | ||
|
Total |
1,268 |
261 |
121 |
218 |
46 | |
|
Average Age (year) |
24.77 |
42.05 |
38.57 |
34.5 |
50.22 | |
|
Gender (%) |
Male |
61.4 |
84.7 |
85.9 |
59.6 |
71.4 |
|
Female |
38.6 |
15.3 |
14.1 |
40.4 |
28.6 | |
|
First Time |
Yes |
72.4 |
59.8 |
70.3 |
60.6 |
36.7 |
|
to Indonesia (%) |
No |
27.6 |
40.2 |
29.8 |
39.4 |
63.3 |
|
First Time to International Event (%) |
Yes |
34.7 |
54 |
32.2 |
50 |
10.2 |
|
No |
65.3 |
45 |
67.8 |
50 |
89.8 | |
Source: Survey data
According to Table 3, IAs and OCA-IFs had the youngest and oldest average ages of 24.77 and 50.22 years, respectively. There were more males than females in all respondent types. For the majority of respondents, the 2018 Asian Games was their first-time visiting Indonesia, with the exception of OCA-IFs’ officials. Conversely, most respondents had prior experience attending international sports events, with the exception of COs and ISs.
Satisfaction with the Event
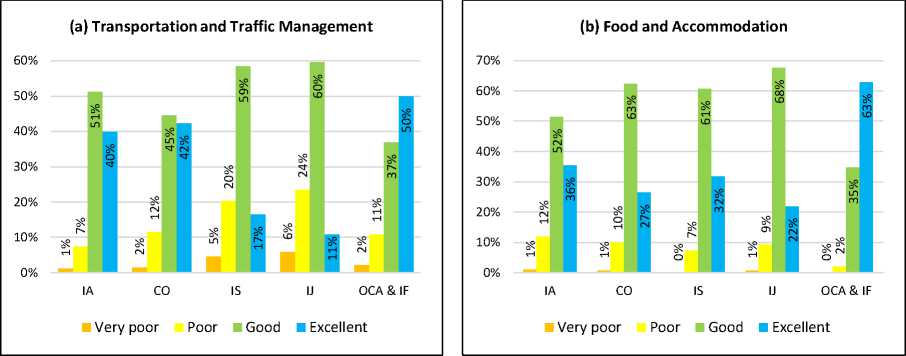
International attendees’ satisfaction with the 2018 Asian Games is crucial for their word-of-mouth referral behavior in the future. Hence, the impression that they had regarding the event needs to be taken into account and evaluated. Considerable room for improvement in transportation and traffic management was perceived by a significant number of respondents, as shown in Figure 3 (a). Except for OCA-IFs, the ‘excellence’ responses were still less than ‘good’ in other groups, especially for ISs and IJs. Special transportation services were provided for event-related activities of OCA-IFs, IAs, and COs, which resulted in higher satisfaction levels regarding transportation arrangements for these groups. On the other hand, IJs were less satisfied with transportation arrangements, as their duties involved frequent mobility between venues. Meanwhile, ISs encountered transportation problems because they had no special arrangements provided by the organizing committee.
According to the survey, the majority of respondents were satisfied with the food and accommodation provided by the organizing committee, although there were some complaints about the limited food options and small room sizes in the athlete village, particularly from IAs and COs (as shown in Figure 3 (b)). It should be noted that the organizing committee had different
arrangements for food and accommodations based on the type of attendee. OCA-IFs officials were accommodated in nearby hotels, while COs and IAs mostly stayed at the athlete village, except for those competing at venues outside the cities. On the other hand, IJs and ISs had to make their food and accommodation arrangements independently.
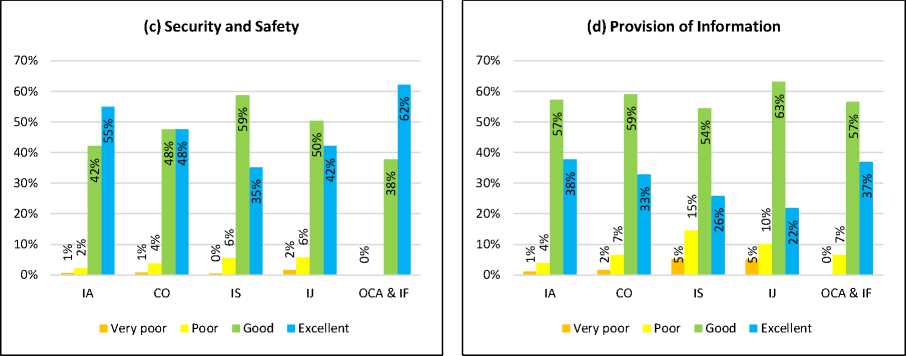
Improvements also demanded safety and security assurance (Figure 3 (c)). Except for OCA-IFs’ officials and IAs, there were more respondents who rated ‘good’ than ‘excellence’, especially for ISs and IJs. In the future, demand for safety will be even more crucial for any country hosting the event given the COVID-19 pandemic outbreak that began in 2020. The safety standard will not only cover accident risks but also health risks, while the global health standard requirements will certainly increase as well.
Figure 3 (d) reveals that respondents perceived that the event could have done a better job of giving out information like flyers, booklets, and information counters. While more respondents rated the information provision as ‘good’ than ‘excellent’ across all types of respondents, it is notable that ISs and IJs encountered more problems accessing information. More than 15% of them rated the access to information as ‘poor’ or ‘very poor’.
Figure 3 (e) illustrates that the telecommunications and internet services received the highest number of complaints compared to other evaluated aspects. While most respondents rated the services as ‘good’, some compared them unfavorably to those in their home countries. Consequently, while the majority of respondents expressed satisfaction with the services during the event, a significant percentage of respondents in each group were dissatisfied. IJs assigned the lowest ratings, with almost 20% of them rating the services as ‘poor’ or ‘very poor’.
(e) Telecommunication and Internet Service
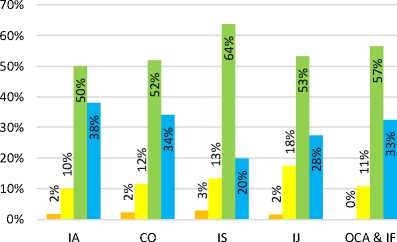
■ Very poor Poor ■ Good ■ Excellent
Figure 2. International Attendees’ Evaluation of the 2018 Asian Games (Source: Authors’ calculation based on survey data)
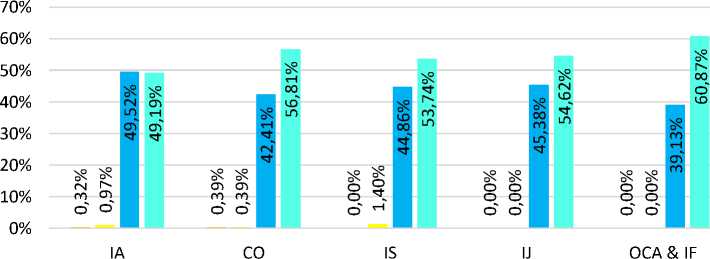
View towards Indonesia
Figure 4 (a) shows that at least 97% of respondents in each category stated ‘like’ or ‘really like’ the culture of Indonesia (the local people, hospitality, and cuisine). This indicates that Indonesia was
quite successful in selling and developing its cultural aspects and images during the event. International respondents generally had a positive perception of Indonesian cities (public service, traffic, and view), as shown in Figure 4 (b), with at least 73% of
respondents in every category stating that they either ‘like’ or ‘really like’ them. However, the percentage of respondents conveying dislike is relatively high, with respondents admitting dissatisfaction reaching at least 10% in each category. This implies that the host cities need to improve their provisions to meet global practices and standards to guarantee that the
international attendees are comfortable during their stay. It is also interesting to note that the IJs showed the highest displeasure (21.19%) and provided poor reviews of traffic or transportation, considering their need for punctual and proper transportation services to be able to perform their tasks.
(a) Culture (People, Hospitality, and Cuisine)
■ Really Dislike Dislike ■ Like ■ Very Like

Figure 3. International Respondents’ Opinion on Indonesia (Source: Authors’ calculation based on survey data)
The perception of international respondents towards the cities and culture of Indonesia carries out an essential role of shaping the impact of the 2018 Asian Games in the long run, specifically in the tourism sector. Therefore, the experience of participating in or attending the event may potentially alter the perception of
international respondents towards Indonesia. In general, most international respondents (88% in each respondent group) changed their view of Indonesia in a positive way after experiencing the 2018 Asian Games (see Figure 5). Upon closer examination, it is found that a small percentage of respondents did not experience a change e-ISSN 2407-392X. p-ISSN 2541-0857
in their opinion towards Indonesia after participating in or attending the 2018 Asian Games. Specifically, 12.38% of ISs respondents and 11.36% of surveyed OCA-IFs officials did not perceive any change. Furthermore, a small number of OCA-IFs respondents (4.55%) was reported to change their opinion in a negative manner, which is lower than other categories. Nevertheless, the overall result remains positive, in which the country officials are the respondent group with the highest percentage (91.45%) reporting a positive change in opinion towards Indonesia. This indicates that the 2018 Asian Games positively influence the perception of Indonesia among most international respondents.
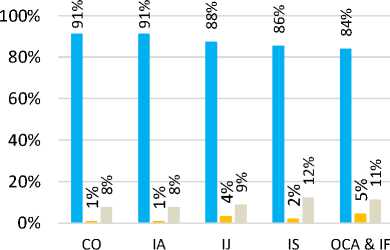
■ Positive ■ Negative Not Change
Figure 4. Change of Opinion of the International Respondents on Indonesia (Source: Authors’ calculation based on survey data)
Word-of-Mouth Intention
Table 4 presents the chi-square and frequency tests of the variables used to figure out whether or not the international respondents would recommend Indonesia as a place to visit to their colleagues and relatives. The results reveal that male respondents, those who had never visited Indonesia before the 2018 Asian Games, those who had participated in international sports events previously, older respondents, and those who stayed longer in Indonesia were more likely to give a positive reference to Indonesia. On the other hand, there was no significant difference in the proportion of respondents who were unwilling to recommend Indonesia based on their hosting city or country of origin.
The table provides information on the willingness of international respondents to promote Indonesia as a tourist destination to family and friends after their experience at the 2018 Asian Games. The results indicate that the proportion of positive responses varied across respondent groups, with the lowest percentage of 87% for IAs and the highest percentage of 100% for OCA-IFs officials. Overall, it can be concluded that the majority of international respondents were willing to recommend Indonesia as a tourist destination based on their positive experience at the 2018 Asian Games.
Table 4. Summary Statistics of Willingness to Give Positive Reference
|
Variables |
Categories |
Positive Reference |
Total |
Chi-sq. Stat | ||||
|
Yes |
No | |||||||
|
n |
% |
n |
% |
N |
% | |||
|
Gender |
Female Male |
566 1156 |
87% 91% |
83 112 |
13% 9% |
649 1268 |
100% 100% |
7.353* ** |
|
Loca- |
Palembang |
461 |
91% |
47 |
9% |
508 |
100% |
0.641 |
|
tion |
Jakarta |
1261 |
89% |
148 |
11% |
1409 |
100% | |
|
Country of |
Non-ASEAN |
1339 |
89% |
159 |
9% |
1498 |
100% |
1.465 |
|
Origin |
ASEAN |
383 |
91% |
36 |
9% |
419 |
100% | |
|
Previous Visit to |
Never |
558 |
92% |
50 |
8% |
608 |
100% |
3.700* |
|
Indonesia |
At least once |
1164 |
89% |
145 |
11% |
1309 |
100% | |
|
Never |
1052 |
89% |
131 |
11% |
1183 |
100% |
2.747* | |
|
264 |
e-ISSN 2407-392X. |
p-ISSN 2541-0857 | ||||||
|
Positive |
Reference |
Total |
Chi-sq. Stat | |
|
Varia- Categories |
Yes |
No | ||
|
n |
% n % |
N |
% | |
|
Previ- | ||||
|
ous In- | ||||
|
terna- At least once tional |
670 |
91% 64 9% |
734 |
100% |
|
Sports | ||||
|
Events | ||||
|
Int. Athletes |
1099 |
87% 169 13% |
1268 |
100% |
|
Int. Country Offi- Types cials |
249 |
95% 12 5% |
261 |
100% |
|
of Re- |
41.933 | |||
|
spond- Int. Spectators |
210 |
96% 8 4% |
218 |
100% *** |
|
ents Int. Journalists |
115 |
95% 6 5% |
121 |
100% |
|
OCA-IFs |
49 |
100% 0 0% |
49 |
100% |
|
Below 19 |
137 |
84% 26 16% |
163 |
100% |
|
19-25 |
638 |
88% 88 12% |
726 |
100% |
|
26-30 |
363 |
88% 48 12% |
411 |
100% |
|
Age 31-40 Group |
280 |
94% 18 6% |
298 |
100% 26.51 |
|
41-50 |
144 |
95% 8 5% |
152 |
100% |
|
51-60 |
110 |
95% 6 5% |
116 |
100% |
|
Above 60 |
50 |
98% 1 2% |
51 |
100% |
|
0-7 days |
380 |
89% 45 11% |
425 |
100% |
|
8-14 days |
789 |
89% 97 11% |
886 |
100% |
|
Length 15-21 days of Stay |
445 |
90% 50 10% |
495 |
100% 7.985* |
|
22-28 days |
66 |
96% 3 4% |
69 |
100% |
|
>28 days |
42 |
100% 0 0% |
42 |
100% |
Source: Authors’ calculation based on survey data.
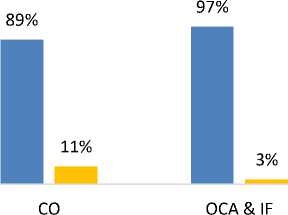
Furthermore, hosting the 2018 Asian Games offered Indonesia the opportunity to boost its global image and pave the way for future international sports events. The positive evaluation of OCA-IFs’ officials, who will play a key role in making decisions regarding future events, could further amplify this potential. As depicted in Figure 6, both OCA and IF officials, as well as foreign COs, expressed a willingness to provide a positive recommendation for Indonesia as a host for single- or multi-sport events in the future. These results indicate a promising outlook for Indonesia's future as a host of international sports events.
■ Yes ■ No
Figure 5. Willingness to Recommend Indonesia as a Future International Sports Event Host (Source: Authors’ calculation based on survey data)
82%

Yes
18%
No
Figure 6. The Willingness of Country Officials to Recommend Indonesia as a Training Location for Their Respective
Teams (Source: Authors’ calculation based on survey data)
Moreover, a significant majority of international CO respondents expressed their willingness to endorse Indonesia as a training location for their national teams, as illustrated in Figure 7. These respondents pointed out that many of the country's sports facilities, like the velodrome for cycling, already meet the necessary international standards. Furthermore, the hot climate in Indonesia can be advantageous for athletes seeking to enhance their endurance by coping with heat stress.
Estimation Results
Table 5 displays the results of the logistic regression analysis on the probability of international respondents providing a favorable recommendation of Indonesia to their colleagues and relatives back in their home countries. The dependent variable is binary, in which “No” responses are assigned a value of 0 while “Yes” responses are assigned a value of 1. The results indicate that the ratings provided by respondents to several factors, including transportation arrangements, the availability of information, and their general assessment of the cities in Indonesia (at a significance level of 10%), significantly influence their inclination to recommend Indonesia in a
positive manner to their immediate circle. Such a positive relationship demonstrates that higher perceived ratings of these factors lead to a higher probability of respondents giving positive recommendations to their close associates back home.
Visitors consider transportation as an essential aspect that influences their likelihood of giving a positive recommendation about Indonesia to their friends and relatives back home. This is particularly important because visitors may need to travel frequently during their stay in Indonesia. Additionally, how easy it is for tourists to get information, such as through information desks, booklets, flyers, and boards, is also a key factor in whether or not they will give a good reference. As the respondents were unfamiliar with the destination, access to information was critical for them to locate basic necessities and tourist attractions.
Among the various ratings, the rating of Indonesian cities had the most significant impact on how likely tourists were to recommend Indonesia to their close associates back home. The estimation results highlight the needs to improve public services, reduce traffic congestion, and multiply tourist spots in the cities of Indonesia to enhance the perceptions of the tourists of the said cities. This, in turn, can improve the overall image of Indonesia and increase the likelihood of tourists providing positive referrals to their close ones back home.
Once again, it is possible that these ratings serve as a proxy for the level of enjoyment experienced by tourists during their stay in Indonesia. As Koo (2017) has suggested, the level of enjoyment during their stay may motivate tourists to promote the host country and encourage other potential tourists to visit. Therefore, improving the quality of the aforementioned aspects could provide substantial benefits to Indonesia's tourism sector in the long term.
Table 5. Binary Logistic Regression of Positive References to Indonesia
|
Number of obs. LR chi(2) Prob. > chi2 Pseudo R2 |
1684 83.91 0.000 0.0807 |
|
Log-likelihood |
-477.7213 |
|
Referral |
Odds Ratio Marginal Effect Std. Err z P>|z| |
|
male |
1.135 0.010 0.207 0.690 0.489 |
|
age |
1.002 0.000 0.012 0.140 0.887 |
|
asean los jakarta experindo experevent rttrans** rtsafsec rtinfo* rtict rtcul rtcity*** d_CO*** d_IS*** d_IJ*** Constant*** |
1.123 0.009 0.255 0.510 0.611 1.012 0.001 0.016 0.760 0.448 0.770 -0.021 0.160 -1.250 0.210 0.830 -0.015 0.177 -0.880 0.380 1.122 0.009 0.210 0.610 0.539 1.422** 0.028** 0.195 2.560 0.010 1.168 0.012 0.191 0.950 0.340 1.299* 0.021* 0.203 1.680 0.094 1.130 0.010 0.154 0.900 0.371 1.206 0.015 0.209 1.080 0.280 1.491*** 0.032*** 0.218 2.740 0.006 3.274*** 0.094*** 1.356 2.860 0.004 4.424*** 0.118*** 1.849 3.560 0.000 4.118*** 0.112*** 2.093 2.790 0.005 0.066*** - 0.055 -3.260 0.001 |
Source: Authors’ calculation based on survey data
Note: Dependent variable: Categorical values, in which 1 = ‘Yes’ (giving a positive reference to Indonesia) and 0 = ‘No’ (unwilling to provide a positive reference).
(*), (**) and (***) represent 10%, 5% and 1% significance levels, respectively.
OCA respondents were excluded from the regression analysis due to a lack of variation in their responses (none said that they are unwilling to provide a positive reference to Indonesia).
Another important finding from this study is that the type of international respondent has a significant influence on how likely they are to give positive references about Indonesia. The results suggest that foreign COs, ISs, and IJs are more likely to give positive references about Indonesia than IAs. This could be due to the different levels of enjoyment experienced by these respondent groups, as international athletes have less free time to enjoy their stay in Indonesia outside of the venues where they train and compete. Their schedule is typically packed with training and matches, which may limit their opportunities for leisure activities such as sightseeing in the host cities. Moreover, the
athletes have the lowest total average allowances compared to other types of respondents, which limits their ability to make additional purchases for tourism or leisure purposes.
These factors may have contributed to the relatively low enjoyment level of international athletes during their stay in Indonesia, which may have led to a lower likelihood of giving positive referrals. The group of respondents with the highest likelihood of giving positive referrals were the ISs, with being an international spectator increasing the probability of giving positive referrals about Indonesia by 11.8% compared to international athletes on average. This may be because these spectators
had a more flexible schedule during their stay in Indonesia, allowing them to allocate more time for leisure activities and potentially increasing their enjoyment level and likelihood to give a positive reference about Indonesia back home.
CONCLUSION
This study investigates the potential impact of the 2018 Asian Games on the tourism and sports tourism of the host country (Indonesia) in the medium and long run. More specifically, this study attempts to evaluate the satisfaction perceived by the international participants as well as spectators with how the event was organized and how the level of satisfaction, along with experience and individual characteristics, affects their intention to spread positive WOM about Indonesia to their colleagues and relatives back home. The survey results indicate that the majority of international respondents viewed the 2018 Asian Games as a success, despite acknowledging the need for improvements in several areas such as food and accommodation, venues, match schedules, transportation, safety and security, telecommunications, internet access, and information services. In addition, the respondents held positive perceptions of the host cities, including public utilities, traffic, and landscapes, as well as developed notably favorable views towards the culture of Indonesia, including the people, hospitality, and culinary offerings.
Unsurprisingly, more than 80% of all types of international respondents changed their views toward Indonesia in a positive way. Further, 89% of foreign COs and 97% of OCA-IFs officials expressed their intention to support Indonesia should it bid for a future sports event, either single or multiple events. More than 82% of foreign COs expressed their intention to pick Indonesia for training camps for their respective teams. Finally, at least 84% of international respondents across gender, age group, type, location of the survey, home http://ojs.unud.ac.id/index.php/eot 268
country, a past visit to Indonesia, duration of stay, and previous experience in international sports events expressed their intention to spread positive WOM about Indonesia to their respective colleagues and relatives. However, referring to the estimation results, the factors that considerably affect the WOM intention of the respondents are satisfaction with the provision of information, transportation arrangements, and views towards the host cities. Further, COs, ISs, and IJs respondents have a significantly higher probability of giving positive WOM than international athletes.
Several policy implications are obtained based on the findings of the study. First, in order to increase the probability of international participants and spectators’ intentions to spread positive WOM, the host country needs to ensure a high standard of provision for venues, accommodations, food, telecommunications and internet access, safety and security, as well as match schedules, and specifically consider the transportation arrangements as well as the provision of information services (information counters, flyers, and booklets). Second, the host cities should ensure the quality of public services and traffic management, as well as organize short trips for international participants and spectators to visit various nearby tourist attractions. Third, despite the host country generally paying more attention to ensuring the convenience of the athletes as the main actors of the event, attention towards officials, journalists, and traveling spectators should not be overlooked. These improvements are not solely the responsibility of the host country's federal and city government agencies but also of the private sectors partnered to co-organize the event.
Furthermore, the findings of this study present several academic implications for future research. First, they reaffirm that sports events may have a potential long-term positive effect on the host country, and thereby, event impact analysis may consider both the short- and medium-term and long-term horizons. Second, despite e-ISSN 2407-392X. p-ISSN 2541-0857
the fact that some deterministic models such as IO, social accounting matrix, and CGE can capture potential direct and indirect economic impacts in the long-term through several rounds of the multiplier effect, they cannot capture the long-term effects caused by visitors’ loyalty, which in turn enhance the host country’s tourism. Hence, future studies on visitors’ satisfaction and behavioral intentions can complement the economic impact analysis stimulated by visitors’ spending during the event.
However, future studies can also be carried out based on the limitations of this current study. First, this study only captures the intention to spread positive WOM; its actual impact on future tourist visits remains to be confirmed. This study was carried out with the presumption that athletes, officials, and journalists can be potential effective endorsers due to their high profiles and public exposure. However, future studies carried out on tourists arriving in Indonesia may investigate to what extent their decision is affected by positive WOM or a strong image of Indonesia due to the 2018 Asian Games. Second, this study incorporates a previous visit to Indonesia as one of the independent variables but did not specifically measure their perception of Indonesia prior to their arrival at the 2018 Asian Games. Future studies may include this question in the survey by which a more robust difference-in-difference can be carried out.
REFERENCES
Ahmed, Z. U. (1991). The Influence of the Components of a State’s Tourist Image on Product Positioning Strategy. Tourism Management, 12(4), 331-340.
Akroush, M. (2012), Perceived brand salience and destination brand loyalty from international tourists’ perspective: the case of Dead Sea destination, Jordan. International Journal of
Culture Tourism and Hospitality Research, January 2015. pp. 48-89.
Alexandris et al., 2008). Alexandris, K., Douka, S., Papadopoulos, P. and Kaltsatou, A. (2008), “Testing the role of service quality on the development of brand associations and brand loyalty”, Managing Service Quality, Vol. 18 No. 3, pp. 239-254.
Baade & Matheso 2004 Baade, R. A., & Matheson, V. A. (2004). The quest for the cup: Assessing the economic impact of theworld cup. Regional Studies, 38(4), 343–354.
Baloglu, Seyhmus & Brinberg, David (1997) 'Affective Images of Tourism Destinations'. Journal of Travel Research 35(4):11-15.
Baloglu, S. and McCleary, K.W. (1999), “A model of destination image formation”, Annals of Tourism Research, Vol. 26 No. 4, pp. 868-897.
Boo S., Busser J., Baloglu S. (2009). A model of customer-based brand equity and its application to multiple destinations. Tourism Management, 30(2), 219–231.
Calantone, R., C. Di Benetton, A. Hakam, and D. Bojanic 1989 “Multiple Multinational Tourism Positioning Using Correspondence Analysis”. Journal of Travel Research 28(2): 25-32.
Case, Robert., Tanujit Dey, Stephen Hobbs., Jordan Hoolacha, Andrew Wilcox. (2010). An Examination of Sporting Event Direct-Spending Patterns at Three Competitive Levels. Journal of Convention & Event Tourism, Volume 11, 2010 – Issue 2, Pages 119 – 137.
Case, Rober., Tanujit Dey, Jasper Lu, Jeff Phang, ndie Schwanz. (2013). Participant Spending at Sporting Events: An Examination of Survey Methodologies. Journal of
Convention & Event Tourism 14(1):21-41.
http://dx.doi.org/10.1080/15470148 .2012.755607
Chalip, L., & Leyns, A. (2002). Local business leveraging of a sport event: Managing an event for economic benefit. Journal of Sport Management, 16(2), 132-158.
Chalip et al., 2003 MEDIA BRANDING L. Jago, L. Chalip, G. Brown, T. Mules and S. Ali, ‘Building Events into Destination Branding: Insights from Experts’, Event Management, 8, 1 (2003), 3–14.
Chalip et al., 2005 MEDIA BRANDING G. Brown, L. Chalip, L. Jago and T. Mules, ‘Developing Brand
Australia: Examining the Role of Events’, in N. Morgan, A. Pritchard and R. Pride (eds), Destination Branding: Creating the Unique
Destination
Proposition (Amsterdam: Elsevier, 2004), pp.279–305. A. Smith,
‘Reimaging the City: The Value of Sport Initiatives’, Annals of Tourism Research, 32, 1 (2005), 217–36
Chen, Po-Ju., Deborah Kerstetter. (1999). International Students’ Image of Rural Pennsylvania as a Travel Destination. Journal of Travel Research – February 1999. DOI:
10.1177/004728759903700307
Daniels, M. J., Backman, K. F., &
Backman, S. J. (2004).
Supplementing event economic impact results with perspectives from host community business and opinion leaders. Event Management, 8(3), 117-125.
Davis 2012 Davis, J. A. (2012). The Olympic Games effect: How sports marketing builds strong brands. Singa-pore:John Wiley & Sons.
Dayan., Danie; and Elihu Katz (1992). Media Events The Live Broadcasting of History. Harvard University Press
De Knop., Paul and Joy Stadeven (1999). Sport Tourism., Human Kintics, 1999
Deply, 1998 Delpy, L. (1998). An overview of sport tourism: Building towards a dimensional
framework. Journal of vacation marketing, 4(1), 23-38.
Ehrenberg, A.S.C., Barnard, N., Kennedy, R. and Bloom, H. (2000) ‘Brand Advertising as Creative Publicity’, Journal of Advertising Research 42(July/August): 7–18.
Faullant et al., 2008). Faullant, R., Matzler, K. and Fuller, J. (2008), “The impact of satisfaction and image on loyalty: the caseof Alpine ski resort”, Managing Service Quality, Vol. 18 No. 2, pp. 163-178.
Fourie, J. and Santana-Gallego, M. (2011) ‘The impact of mega-sport events on tourist arrivals’, Tourism Management. Elsevier Ltd, 32(6), pp. 1364– 1370. DOI: 10.1016/j.tour-
man.2011.01.011.
Fullerton, Sam., and Merz, G. Russell. (2008) ‘ The Four Domains of
Sports Marketing: A Conceptual Framework. Sport Marketing Quarterly, 17, 90 – 108
Green, C. Costa and M. Fitzgerald, (2003). “Marketing the Host City: Analyzing Exposure Generated by a Sport Event”, International Journal of Sports Marketing and Sponsorship, 4, 4 (2003), 335–52.
Guido, G. (1998) ‘The Dichotic Theory of Salience: A Framework for Assessing Attention and Memory’, European Advances in Consumer Research 3(3): 114–19.
Haddad and Haddad, 2010). → Haddad, Eduardo A., and Paulo R. Haddad. (2010) "Major sport events and regional development: the case of the Rio de Janeiro 2016 Olympic Games." Regional Science Policy & Practice 2, no. 1: 79- 95
Hinch, Tom., Higham, James. (2011) 'Sports Tourism Development'. 2nd Edition. Channel View Publications.
Kapferer, J.N. (2004), The New Strategic Brand Management: Creating and Sustaining Brand Equity Long Term, Kogan Page, London.
Kasimati, E. (2003) ‘Economic aspects and the Summer Olympics: a review of related research’, International Journal of Tourism Research, 5(6), pp. 433–444. DOI: 10.1002/jtr.449.
Keller, K.L. and Davey, K.K. (2001) ‘Building Customer-Based Brand Equity’, paper presented at Advertising Research Foundation workshop, New York.
Keller, K.L. (2003) ‘Brand Synthesis: The Multidimentionality of Brand Knowledge’, Journal of Consumer Research 29(March): 595–601.
Kim et al., 2013 Kim, S., Holland, S., Han and H. (2013), “A structural model for examining how destination image, perceived value, and service quality affect destination loyalty: a case study of Orlando”, International Journal of Tourism Research International Journal Tourism Research, Vol. 15 No. 4, pp. 313-328.
Konecnik, M.R. (2010), “Clarifying the concept of customer-based brand equity for a tourism
destination”, Annales, series Histori-aetSociologia, Vol. 20 No. 1, pp. 189-200.
Koo., Sun Keun. (2013) ‘The Effect of Destination Image, Event Image, and Satisfaction In Determinig
Behavioural Intention: Recurring Small-Scale Event’. Master Thesis. University of Georgia.
Kotler Philip. (2005). Manajemen Pemasaran, Jilid 1, PT. Indeks Kelompok Gramedia, Jakarta
KPMG (2017) ‘The Economic Impact of Major Sports Events’, (September). Available at: https://as-
sets.kpmg.com/con-tent/dam/kpmg/cn/pdf/en/2018/09/t he-economic-impact-of-major-sports-events.pdf.
Kurtzman, J. and Zauhar, J. (2005) ‘Sports tourism consumer motivation’, Journal of Sport & Tourism. Routledge, 10(1), pp. 21–31. DOI: 10.1080/14775080500101478.
Lee and Taylor, 2005). → Lee, C. K., & Taylor, T. (2005). Critical reflections on the economic impact assessment of a mega-event: the case of 2002 FIFA World Cup. Tourism management, 26(4), 595-603.
Lim, Y. and Weaver, P.A. (2014), “Customer-based brand equity for a destination: the effect of destination image on preference for products associated with a destination brand”, International Journal of Tourism Research, Vol. 16 No. 3, pp. 223-231.
MacKay, Kelly J., Daniel R Fesenmaiaer. (1997). Pictorial element of destination in image formation. Annals of Tourism Research, Volume 24, Issue 3, 1997, Pages 537 - 565
Manzenreiter 2002 Horne, J.and Manzen-reiter, W.(eds. ) (2002) Japan, Korea and the 2002 World Cup, London: Routledge.
Moragas, M. de, Rivenburgh, N.K., and Larson, J.F. (Eds.) (1996). Television in the Olympics. London: John Libbey
Muller, A., Biro, M., Rathonyi-Ódor, K. I. N. G. A., Rathonyi, G., Szeles-e-ISSN 2407-392X. p-ISSN 2541-0857
Kovacs, G. Y. U. L. A., Boda, E., ... & ndras, A. (2016) ‘Economic impacts of sports events.’, Studia Uni-versitatis Babes-Bolyai Educatio Artis Gymnasticae, pp. 85–96.
Oppermann, M. (2000), “Tourism destination loyalty”, Journal of Travel Research, Vol. 39 No. 1, pp. 78-84.
Oribis Research 2018 Orbis Research.
(2018). Sports tourism market estimated to be worth US$800 billion globally according to new research report. Retrieved from https://www.whatech.com/market-research/industrial/ archive/436642-sports-tourism-market-estimated-to-be-worth-us-800-billion-globallyaccording-to-new-research-report
Palrão, T. and Filipe, J. A. (2017) ‘Sports Events Tourism: An Approach to the Portuguese Case’, (2), pp. 1320– 1335.
Pike et al. (2010) Pike, S., Bianchi, C., Kerr, G. and Patti, C. (2010), “Consumer-based brand equity for Australia as a long-haul tourism destination in an emerging market”, International Marketing Review, Vol. 27 No. 4, pp. 434-449.
Preuss., Holger. (2005). The economic impact of visitors at major multi-sport events. European Sport Management Quarterly 5(3):281-301. September 2005.
http://dx.doi.org/10.1080/16184740 500190710
Revindo, M. D., Widyasanti, A. A., Sire-gar, C. H., Anindita, D., Hastuti, N.
W., & Hambali, S. (2019). LongTerm Effect of Mega Sports Event on Host Country’s Tourism: Evidence From the Jakarta-Palembang 2018 Asian Games. Working Paper No 040. Institute for Economic and Social Research.
Revindo 2021 Mohamad Dian Revindo, Amalia Adininggar Widyasanti, Chairina Hanum Siregar & Sean Hambali (2021) Factors explaining the expenditure of sports event participants and spectators: evidence from the 2018 Asian Games, Journal of Sport & Tourism, 25:2, 105127, DOI: 10.1080/14775085.2021. 1883460
Ritchie, Brent W., Adair, Daryl. (2004) 'Sports Tourism: Interrelationships, Impacts and issues', Channel View Publications.
Ritchie and Smith, 1991 MEDIA BRANDING J. Ritchie and B. Smith, ‘The Impact of a Mega-Event on Host Region Awareness: A Longitudinal Study’, Journal of Travel Research, 13, 2 (1991), 14–20.
Roche., Maurice (2002) The Olympics and ‘Global Citizenship’. Citizenship Studies 6 (2):165-181. July 2002
Roche, S., Spake, D. F. and Joseph, M. (2013) ‘A model of sporting event tourism as economic development’, Sport, Business and Management: An International Journal, 3(2), pp. 147–157. DOI:
10.1108/20426781311325078.
Romaniuk, J. (2002) ‘Want to Make Your Brand Successful?’, B&T Weekly 11 October:12.
Sato, Mikihiro., Jeremy S. Jordan, Kyriaki Kaplanido, Daniel C. Funk. (2014). Determnants of Tourist’ Expenditure at Mass Participant Special Events: A Five-Year Analysis. Current Issues in Tourism. Volume 17,2014-Issue 9.
https://doi.org/10.1080/13683500.2 014.892918
Schwark, Jurgen. (2007) ‘Sports Tourism: Introduction and Overview’, European Journal for Sport and Society, 4 (2), 117 - 132
Shonk., David. (2006) ' Perceptions of Service Quality, Satisfaction and The Intent to Return Among Tourists Attending A Sports Event'. Dissertation. Ohio State University.
Simpson, Penny M. Judy A. Siguaw. (2008). Destination Word of Mouth: The Role of Traveler Type, Residents, and Identity Salience. Journal of Travel Research Volume 47, Issue 2.
https://doi.org/10.1177/0047287508 321198
Solberg & Preuss 2007 Solberg, H. A., & Preuss, H. (2007). Major sport events and long-term tourism impacts. Journal of Sport Management, 21(2), 213–234.
Sou, V. and Wu, W. (2008), “An investigation of the effectiveness of destination loyalty in tourism sites:interna-tional travelers experiences in Taiwan, Singapore, and Malaysia”, Society for Marketing Advances Proceedings, Vol. 4 No. 23, pp. 343354.
Stern, E., & Karkover, S. (1993). The formation of a composite urban image, Geographical Analysis, 25(2), 130146.
Technavio Research 2020 Technavio Research. (2020). Sports Tourism Market 2019–2023. Retrieved from https://www.whatech. com/market-research/industrial/archive/436642-sports-tourism-market-estimated-to-be-worthus-800-billion-globally-according-to-new-research-report
Vegara-Ferri, J. M. et al. (2018) ‘The touristic impact of a sporting event attending to the future intentions of the participants’, Journal of Physical Education and Sport, 18(3), pp. 1356–1362. DOI:
10.7752/jpes.2018.s3201.
Vico, R. P., Uvinha, R. R., & Gustavo, N. (2018): Sports mega-events in the perception of the local community: the case of Itaquera region in São Paulo at the 2014 FIFA World Cup Brazil, Soccer & Society, DOI: 10.1080/14660970.2017.1419471
Vico, R. P., Uvinha, R. R., & Gustavo, N. (2019). Sports mega-events in the perception of the local community: the case of Itaquera region in São Paulo at the 2014 FIFA World Cup Brazil. Soccer & Society, 20(6), 810823.
Vico et al., 2018 → world cup sao paolo : Viglia et al. (2016) → Viglia, G., Minazzi, R., Buhalis, D., 2016, The influence of e-word-of-mouth on hotel occupancy rate, International Journal of Contemporary
Hospitality Management, Vol.28(9), pp. 2035 – 2051
Walmsley, D.J. and Jenkins, J.M. 1992. ‘ Appraisive images of tourist areas: application of personal constructs. Australian Geographer. Volume 24, 1993. Issue
2. https://doi.org/10.1080/0004918
9308703083
Wang, Tz-Li., Phuong Thi Kim Tran, Tran Vinh (2017). Destination perceived quality, tourist satisfaction and word-of-mouth. Tourism Review 72(3):00-00. October 2017. 10.1108/TR-06-2017-0103
Wasilczuk and Zawadzki, 2013), The Attitude of Polish Entrepreneurs to the Fact of Staging the Mega Sport Event–the Case of Pomeranian SMEs Towards Euro 2012. Przedsiębiorstwo we współczesnej gospodarce-teoria i praktyka, (1), 16-23.
Wikarya, U., Widyasanti, A. A., Revindo, M. D., Siregar, C. H., & Dewi, C. E. (2022). Impact of International Sports Event on Local Businesses:
Insight from the Stallholders and Official Partners of the 2018 Asian Games. JEJAK, 15(2), 336-353.
Xing and Chalip, 2006 MEDIA BRANDING Xing., Xiaoyan and Laurence Chalip. (2006). Effects of Hosting a Sport Event on Destination Brand: A test of Co-Branding and Match-up Models. Sport Management Review, 2006, 9, 49-78.
Zhang, Y. et al. (2014) ‘The Relationship among Service Quality, Satisfaction, and Future Attendance Intention: The Case of Shanghai ATP Masters 1000’, International Journal of Sports Science, 4(2), pp. 50–59. DOI: 10.5923/j.sports.20140402.03.
Zhou, Xiaoqian (2015), Expectation of Sport Event Tourism Experience. Master Thesis. Department of Service Management and Service Studies. Lund University
http://ojs.unud.ac.id/index.php/eot
274
e-ISSN 2407-392X. p-ISSN 2541-0857
Discussion and feedback