CARBON STOCKS ESTIMATION ON URBAN VEGETATION USING UAV-SfM PHOTOGRAMMETRY METHOD
on
Carbon Stocks Estimation on Urban Vegetation Using UAV.., [Agus Sukma Yogiswara, dkk]
CARBON STOCKS ESTIMATION ON URBAN VEGETATION USING UAV-SfM PHOTOGRAMMETRY METHOD
Agus Sukma Yogiswara1)*, Takahiro Osawa2), I Wayan Nuarsa3), Abd. Rahman As-syakur3)
1)Masters Program in Environmental Science, UdayanaaUniversity-Denpasar, Bali 2)CenteraforaResearchaandaaApplicationaof SatelliteaRemoteaSensing (YUCARS)aYamaguchi
University,aJapan
3)MarineaandaFisheriesaScienceaFacultyaofaUdayanaaUniversity-Badung, Bali
*Email: sukmayogiswara08@gmail.com
ABSTRACT
Global warming and biodiversity loss are critical issues, and forest retention and reforestation programs are crucial in mitigating climate change. However, discussions around these programs often exclude the role of urban vegetation in carbon sequestration. Preserving urban vegetation, such as trees, can also significantly reduce carbon emissions. Urban vegetation can be found in two main locations: Urban Green Open Spaces (UGS) and Road Landscapes (RL). In Denpasar Bali, Glodokan Tiang or Polyalthia longifolia trees are planted at those locations. Data management and carbon stock calculation mechanisms are required to demonstrate the contribution of urban vegetation in terms of carbon sequestration. The technology of Unmanned Aerial Vehicle (UAV) can be used as an alternative to efficiently calculate the estimated carbon stock. The calculation uses the Diameter Breast High (DBH) value approach using the canopy area and Canopy Height Model (CHM) obtained from UAV data processing using the Sfm method. UAV estimates show that the highest Above Ground Biomass (AGB) value at Bajra Sandhi Renon Field is 201.59 kg with a stored carbon content of 94.75 kg, while on I Gusti Ngurah Rai Bypass has the highest AGB value of 215.04 kg with a stored carbon content of 101.07 kg. These results have been validated by field observations, where the results of the regression analysis at the location of Bajra Sandhi Renon and I Gusti Ngurah Rai, show that between field observation data and estimation data with UAV there is no significant difference. While the results of the t-test: Paired Two Sample for Means at the Bajra Sandhi Renon Field and the Bypass I Gusti Ngurah Rai have a value above the significance level which proves that there is no significant difference between the carbon stock value from field observations and the carbon stock from the UAV approach.
Keywords: Carbon Stock; Above Ground Biomass; Urban Vegetation; UAV-Sfm
Reducing deforestation and forest degradation emissions and increasing forest carbon stocks in developing countries (REDD+) does not consider smallholder trees but only large-scale forests. However, community trees outside the forest, if not cut down can
reduce carbon emissions from the atmosphere. The only reason community trees are not the main focus in REDD+ arrangements is that their contribution to carbon stocks is not done well. To improve country negotiations for REDD+, it is necessary to provide evidence of the potential contribution of small trees outside the forest to biodiversity
conservation, livelihood options, and carbon stocks.
Urban community trees can be found in urban vegetation and can be divided into two main types UGS and RL. UGS is a repository of carbon stocks in urban areas, contributes to the mitigation of climate change impacts through carbon stocks, and provides various benefits. RL also contributes to the reduction of carbon emissions and air pollution from vehicles, especially Pb. In Bali, especially in Denpasar City, UGS and RL chose the Glodokan pole tree or Polyalthia longifolia because it has thick leaves that make filtering and a fast growth rate. This tree is a type of vegetation with strong roots, easy to grow in hot areas, and resistant to wind (Abobsesa et al., 2018).
Calculation of carbon stock also aims to determine how much the ability of vegetation to absorb carbon will have a positive impact on controlling climate change. Carbon stock estimation can be done by direct data collection and using satellites/vehicles such as UAVs. UAVs have begun to receive more attention in the field of ecology in the last 15 years, as they provide very high-resolution imagery that ranges from meters to millimeters. The UAV-based photogrammetric system goes a step further as it offers acceptable results for tree canopy delineation at a lower cost than the UAV-based LIDAR system. Currently, in forest applications, UAV-based studies have been successfully used with high precision to map vegetation, calculate plant biomass and nitrogen, monitor vegetation change, monitor harvest, and recruitment, and estimate tree canopy parameters and canopy height (Yurtseven et al., 2019). The height of the photo acquisition can be adjusted so that the detailed photo resolution obtained is less than 25 cm/pix (Ramadhani et al., 2015).
This UAV is expected to be able to summarize the time of data collection in the field without the need for direct measurements. This will be a key aspect for various forest-related studies to improve understanding of stands, landscape structure, and dynamics and develop appropriate methods for mapping and inventorying (Suhardiman, et al. 2016). Tree geometric features such as canopy area, canopy perimeter, and CHM obtained from the UAV provide useful information in estimating the carbon stock generated by the tree.
The photogrammetric image processing method of UAV derivatives uses the structure from motion (SfM) algorithm. The SfM algorithm, a new approach in photogrammetric surveying and one of the most popular 3D reconstruction algorithms, is used to process UAV-based photos. (Iizuka et al., 2018) used UAV and SFM to estimate diameter at breast height and tree height, (Li et al.,2019) and (Navarroaet al., 2020) used UAV and SFM to estimate aboveground biomass in mangrove forests, (Panagiotidis et al., 2016) and (Krause et al., 2019) conducted research on extracting tree crown and tree height information using a UAV. Based on several studies using UAV and SFM methods, it was concluded that the use of SFM has good potential to find out information related to forest biophysics (Iglhaut et al., 2019). It is very important to know the carbon stock in urban areas. This study aims to predict the carbon stock in urban vegetation by using the UAV-SfM photogrammetry method. The focus of the urban vegetation study is UGS and RL which have small trees that will illustrate the potential for future carbon stocks.
The research was conducted in two locations: I Gusti Ngurah Rai Bypass Road (2 km) and Bajra Sandhi Renon
Field. The two research locations have Polyalthia longifolia trees as the majority of plants. In addition, both locations have a wide area for performing UAV flights with low flying heights. Figures 1 show the research locations.
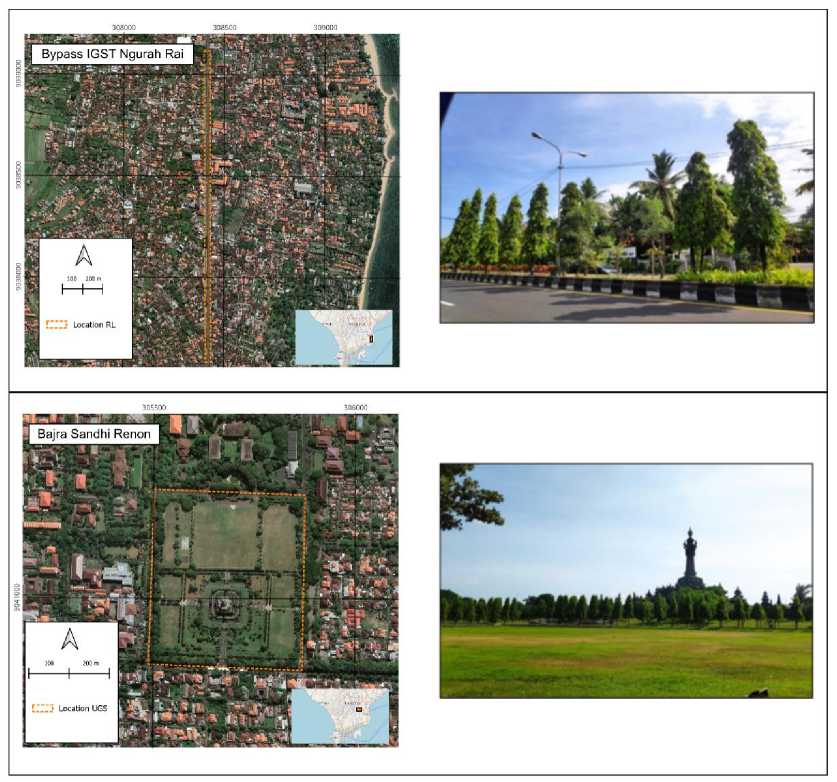
Figure 1.
Research Locations: Bypass I Gusti Ngurah Rai (Top Figure) and Bajra Sandhi Renon (Bottom Figure).
In this study, the independent variables observed will the amount of carbon stock of Polyalthia longifolia trees, tree height, canopy perimeter, volume, DBH, and tree biomass measured by the UAV-SfM method. Meanwhile, the dependent
variable is the amount of carbon stock, tree height, canopy perimeter, volume, DBH, and tree biomass measured using the survey method.
The DJI Mavic 2 Pro was used as a flying vehicle in this study. This UAV is equipped with a Hasselblad L1D-20c
visible camera with Hasselblad Natural Color Solution (HNCS) technology. The DJI Mavic 2 Pro has a 20-megapixel (5472 X 3648) resolution, a 1-inch CMOS sensor, and a 35-mm focal length. The UAV acquisition process with a flying height used is 60 m with a vertical camera angle variation of 90° and an angled camera angle of 70°. Overlap and Sidelap in each photo are 80°. With this variable, 2.3 cm GSD can be obtained. The mission flight software used in this study is pix4D capture (Pix4D version 4.10.0). In addition, before conducting flight missions, more than 6 Ground Control Points (GCPs) will be established and measured using GPS Geodetic to improve spatial accuracy in aerial photographs. The data generated from this UAV are Canopy Area, Canopy Perimeter and CHM.
Measurements in the field will carry out as a reference/validation/comparison of the UAV data obtained. Measurements in the field include ICP (Independent Control Point), tree height measurement, and DBH. ICP is measured by geodetic GPS concerning aerial photographic GCP measurements. ICP is measured without using a unique plate/mark such as GCP but using existing objects in the measurement area (e.g., sidewalks, corner markings, ornaments, etc.). In this study, Total Station (TS) was applied to measure tree height.
-
a) Pre-Processing
A manual check is required to reduce errors and blunders in the acquisition results before image processing. This manual check includes sorting excellent and low-quality images (e.g., overexposure, blur). Low and nonuniform image quality can reduce the accuracy of the image.
-
b) Structure-from-motion proses
The image processing that has been collected at the research sites is carried
out on commercial software Agisoft Metashape Professional version 1.5.2. This software processes a collection of stereo images to produce several outputs, such as dense point cloud, 3D mesh, upright image (orthophoto), and DSM (Digital Surface Model). The SfM algorithm, basically an image processing technique on a computer, aims to obtain plane geometry, cloud points, camera calibration, position, and orientation in overlapping images (Yurtseven et al., 2019).
The stages in processing this software (Partama, 2018) are Photo input, Photo alignment, Georeferencing, Optimization, Dense point cloud, DSM, and Orthophoto.
-
a) Segmentation
The thresholding method simply
replaces every pixel in an image (image) with a black pixel if the image intensity Ii,j is less than the value T, (that is, Ii, jT), and will replace every pixel in an image (image) into white pixels if the image intensity is greater than the value of the constant T, as shown in Equation 1 (Rafael et al., 2008),
-
g( i ,D =
(1 (white) if l(i, j) > T ( 0 (black) if I(i, j) ≤ T
(1)
where g(i, j) is the pixel value of a binary image and I(i, j) is the intensity value of the grayscale image.
Thresholding operation is defined as in equation 2 below (Rafael et al., 2008).
T = M [x, y, p(x, y), f(x, y)] (2)
In equation 2, T is the threshold, while f(x, y) is the gray level value of a point (x, y), and p(x, y) shows some local properties of a point such as the average gray value of the environment. center at point (x, y).
-
b) Canopy Height Model (CHM)
CHM represents the height of the trees. This is not an elevation value, rather
it’s the height or distance between the ground and the top of the trees (or buildings or whatever object that the lidar system detected and recorded). In short, the calculation of the CHM value is done by thinking like the following:
CHM = DSM – DTM…………...(3)
The Digital Terrain Model (DTM) is simply an elevation surface representing the bare Earth referenced to a vertical datum. The CHM value can be calculated using ArcGIS software, Global Mapper, Simactive, and other spatial data processing software. Calculations are performed automatically using the programming language contained in each software.
-
c) Above Ground Biomass
Assessing the carbon stock of Polyalthia longifolia in urban green spaces. The method used in this research is nondestructive sampling or without logging. This method is carried out by measuring the diameter of the tree using an appropriate allometric formula to estimate the biomass. The allometric formula used for the tree uses the allometric formula Dung, et al. (2012).
Allometric equation for aboveground biomass:
AGB = 6.4050*(D2*H0.4137).......(4)
Where:
(AGB) = Above Ground Biomass (kg)
D = Tree Diameter (cm)
H = Tree Height (m)
Above-ground biomass will be converted to carbon stock, and the amount of carbon is approximately 47% of the dry biomass of the tree. For this study, the IPCC (2006) conversion factor was used.
C = AGB x CF……......................(5)
Where:
C = Carbon Stock (kg)
AGB = Above Ground Biomass (kg)
CF = fraction of the carbon in the biomass (0.47)
-
d) Relationship AGB values from the UAV imagery with field observation data
From AUV data have orthophoto and DSM data. DSM produce DTM and CHM. From CHM data were analyzed using thresholding segmentation and produced Canopy Area and Canopy Perimeter, while DSM data were interpolated and obtained CHM (Tree Hight) data.
The data will be validated using RMSE, the orthophoto data will be validated with ICP data, CHM data will be validated with tree height from field data. The equation is:
R MSE = (∑(z^))1 / 2 (6)
Where:
RMSE = root mean square error value y = observed value (field data)
ŷ = predictive value (UAV) data
i = order of data in database
n = amount of data
-
e) Validity Test
Test the validity of the carbon stock from the estimation results from the UAV with field observations carried out with 2 approaches:
Create a linear regression equation between the estimated carbon and field observations. The higher the value of the coefficient of determination (R2), the higher the level of validity of the carbon estimation results from the UAV.
Perform a paired t-test (paired t-test). The results of the estimated carbon stock with UAV are declared valid if there is no significant difference between the estimated carbon stock from the UAV and field observations at the level α = 5%.
The CHM was used to calculate the AGB of the Glodokan tiang tree. The
CHM value is obtained from the reduction of DSM and DTM.
To evaluate the CHM data, a Root Mean Squared Error (RMSE) was calculated between the CHM value and the tree height measurement value in the field (using Total Station). The RMSE value for the I Gusti Ngurah Rai Bypass Road location is 0.38, while the RMSE value for the Bajra Sandhi Renon Field location is 0.48.
Thresholding is an image segmentation method that separates objects from the background in an image based on differences in brightness or darkness. The image region that tends to be dark was made darker (perfect black with an intensity value of 0), while the image region that tends to be lighter was made lighter (perfect white with an intensity value of 1). Therefore, the output of the segmentation process using the thresholding method is a binary image with a pixel intensity value of 0 or 1.
The value used in the segmentation is the threshold value of the CHM data obtained by the UAV (CHM > 2), where this segmentation will separate objects with a height above 2 meters and below. Objects that are at the height of more than 2 meters was white and have a value of 1, while objects that are below 2 meters was dark in color and have a value of 0.
Segmentation is continued by vectorizing objects that have values. So that tree objects can be segmented automatically.
The segmentation results were then analyzed to obtain information on canopy perimeter, canopy area, and CHM value. These values were analyzed using QGIS software.
The study used 66 and 45 Glodokan tiang trees, which were individually sampled to avoid biased data caused by overlapping with other trees.
Validation data were obtained from field observation (Tree Height and DBH). The sample is divided into model data and validation data. 60% as model data and 40% as validation data
The AGB is calculated from the field data obtained for each Glodokan Tiang tree using the allometric formula to estimate the AGB for each tree.
The highest AGB value in Bajra Sandhi Renon Field is 193.05 kg with a stored carbon content of 90.73 kg, while the lowest value is 92.86 kg with stored carbon of 43.65 kg. While the highest AGB value at the location of I Gusti Ngurah Rai Bypass Road is 242.21 kg with a stored carbon content of 113.84 kg, while the lowest value is 84.84 kg with a stored carbon content of 39.87 kg.
-
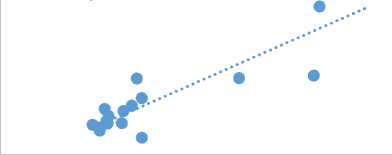
3.1.2 Relationship of DBH value with UAV data (Canopy Area, Canopy Perimeter, and CHM)
The relationship between DBH field observation and UAV data which was used to estimate the UAV’s DBH. Modeling uses 60% of the existing data, 40 trees Bajra Sandhi and 27 trees in Bypass. The UAV data used are Canopy Area, Canopy Perimeter and CHM. each of these data is associated with the value of DBH (field Observation). The best relationship value is used as the DBH value approach (DBHuav).
Q
50,00
40,00
30,00
20,00
10,00
5,00
AREA
y = 9,9719e0,1567x
R² = 0,6808
AREA
Expon. (AREA)
25,00
20,00
15,00
CQ
Q 10,00
5,00
y = 10,84e0,136x R² = 0,5221
Expon.
(Series2)
0,00
0,00
10,00
0,00
0,00 2,00 4,00 6,00
AREA
a). Relationship between Canopy Area with DBH 50,00
d). Relationship between Canopy Area with DBH
Q
40,00
30,00
20,00
10,00
10,00 20,00
0,00
0,00
y = 5,8882e0,104x R² = 0,5637
Expon.
(Series1)
25,00
20,00
15,00
CQ
Q 10,00
5,00
y = 8,9842e0,0609x
R² = 0,4677
Expon.
(Series1)
0,00
0,00 5,00 10,00 15,00
Perimeter
Perimeter
b). Relationship between Canopy Perimeter with DBH
-
e) . Relationship between Canopy Perimeter with DBH
Q
50,00
40,00
30,00
20,00
10,00
5,00 10,00
CHM
0,00
0,00
y = 5,2889e0,1889x R² = 0,4786
Expon.
(Series1)
25,00
20,00
15,00
CQ
Q 10,00

5,00
0,00Illl
0,00 5,00 10,00 15,00
CHM
y = 8,8037e0,0702x
R² = 0,2654
• Series1
Expon.
(Series1)
c). Relationship between CHM with DBH
-
f) . Relationship between CHM with DBH
-
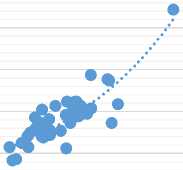
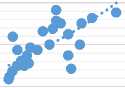
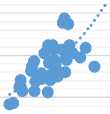
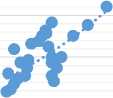
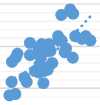
Figure 2.
Scatterplot a), b), and c) is the relationship DBH with UAV data in Urban Green Open Space (Bajra Sandhi Renon); Scatterplot d), e), and f) is the relationship DBH with UAV data in Road Landscaping (I Gusti Ngurah Rai).
The best results on the two locations are the relationship between the canopy area and the diameter of the field observation. Bajra Sandi Renon has a value of R2 = 0.6808 and the approximate value is DBH = 9.9719e0.1567x. Road
Landscaping have a value R2 = 0.5221 and the approximate value is 10.3e0.1503x.
In this calculation, the value of relationship between canopy area and
DBH (Observation field) is used. This relationship is used to build the value of the DBH approach used in the allometric formula. The approximate DBH value in Urban Green Open Space (Bajra Sandhi Renon) is 9.9719e0.1567x and in the location of Road landscaping location (I Gusti Ngurah Rai Bypass) is 10.3e0.1503x. Equation of DBH approach (DBHuav) at each location.
Bajra Sandhi Renon (UGS):
DBHuav = (9.9719e0. 1567 × Canopy Area )2
I Gusti Ngurah Rai Bypass Road (RL):
DBHuav = (10.8e0. 136 × Canopy Area )2
(7)
(8)
The value of the DBH approach that has been obtained, was used to calculate the AGB for each Glodokan Tiang tree using the allometric formula. In calculating AGB, the canopy area and CHM values are required, where the calculation results can be observed in Table 2 and Table 3.
The CHM value and DBHuav are entered into the allometric formula allometric equation at each location:
Bajra Sandhi Renon (UGS):
AGB= 6.4050 ×(DBHuav2 × CHM)0. 4137 (9)
I Gusti Ngurah Rai Bypass Road (RL):
AGB= 6.4050 ×(DBHuav2 × CHM)0. 4137 (10)
From the calculation, the highest AGB value in Bajra Sandhi Renon Field is 201.59 kg with a stored carbon content of 94.75 kg, while the lowest value is 99.61 kg with stored carbon of 46.82 kg.
The highest AGB value at the location of I Gusti Ngurah Rai Bypass Road is 215.04 kg with a stored carbon content of 101.07 kg, while the lowest value is 103.95 kg with a stored carbon content of 48.86 kg.
-
3.1.5 The validation test between the carbon stock produced by the UAV and the field observation
Validation is done to find out how well the model has been done. The data used for validation is 40% data from field observation and UAV that has been collected, Bajra Sandhi has 26 samples and I Gusti Ngurah Rai has 18 samples (Table 1).
Regression analysis/test is widely used in calculating final results for writing scientific/research papers. The results of the analysis/regression test calculations was included in the research conclusions and was determine whether the research being conducted is successful or not. Calculation analysis on the regression test involves several statistical calculations such as significance test (t-test, F-test), ANOVA, and hypothesis determination. The results of the analysis/regression test are in the form of a regression equation.
A regression test is used to determine whether there is a significant difference between the calculation of carbon stock field observations and UAV data. Terms of decision making are if the value of R2 <0.05 then there is a
significant difference between the two variables used. On the other hand, if R2 > 0.05, there is no significant difference between the 2 variables used with a confidence interval of 95%, which means the research error rate is 5% or 0.05. The results of the regression test can be seen in Table 2 and the graph in Figure 3 and Figure 4.
Table 1. Comparison of Carbon Stock Results from Field Observation and UAV
Bajra Sandhi Bypass I Gusti Ngurah Rai
|
Tree |
C UAV |
C Field |
Tree |
C Field |
C UAV |
|
Number |
Estimation (kg) |
Observation (kg) |
Number |
Observation (kg) |
Estimation (kg) |
|
176 |
67.18 |
69.69 |
46 |
51.44 |
48.68 |
|
177 |
57.53 |
67.00 |
48 |
52.70 |
56.79 |
|
178 |
62.63 |
68.38 |
49 |
56.20 |
48.59 |
|
179 |
74.59 |
67.06 |
50 |
52.80 |
50.16 |
|
180 |
54.67 |
65.95 |
51 |
48.86 |
42.00 |
|
217 |
53.07 |
67.07 |
53 |
59.94 |
62.27 |
|
218 |
61.35 |
58.15 |
54 |
88.90 |
76.43 |
|
219 |
55.44 |
56.18 |
55 |
58.70 |
58.28 |
|
220 |
54.72 |
43.65 |
59 |
82.83 |
78.99 |
|
222 |
46.82 |
59.70 |
61 |
53.60 |
49.49 |
|
223 |
52.90 |
48.96 |
64 |
49.34 |
44.57 |
|
224 |
62.30 |
81.34 |
67 |
63.41 |
78.55 |
|
225 |
79.34 |
74.03 |
69 |
101.07 |
113.84 |
|
226 |
71.10 |
73.73 |
75 |
62.75 |
39.87 |
|
227 |
93.23 |
89.86 |
76 |
56.50 |
53.57 |
|
298 |
84.05 |
65.57 |
84 |
95.59 |
106.03 |
|
299 |
94.75 |
83.74 |
85 |
62.36 |
65.05 |
|
303 |
72.31 |
72.39 |
86 |
55.98 |
56.35 |
|
304 |
65.69 |
74.20 | |||
|
306 |
86.26 |
79.56 | |||
|
307 |
81.19 |
90.73 | |||
|
308 |
86.32 |
68.76 | |||
|
358 |
72.45 |
55.31 | |||
|
359 |
78.53 |
87.46 | |||
|
362 |
76.95 |
67.51 | |||
|
363 |
57.24 |
52.10 |
Table 2. Carbon Stock Validation Test Results from Field Observation and UAV
|
Regression Statistics |
Bajra Sandhi Renon Field |
I Gusti Ngurah Rai Bypass |
|
R Square |
0.329114886 |
0.811327283 |
|
Adjusted R Square |
0.301161339 |
0.799535238 |
|
Standard Error |
748.7426519 |
397.3377466 |
|
Observations |
26 |
18 |
6000
5000
4000
3000
2000
1000
0
4000
3000
2000
1000
0
0
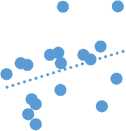
•y = 0,4806x + 1060 R² = 0,3291
1000 2000 3000 4000 5000
Figure 3.
The Comparison Carbon Stock between Feild Observation and UAV Estimation at Bajra Sandhi Renon Field
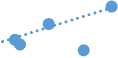
y = 1,2603x - 417,44 R² = 0,8113
0 1000 2000 3000 4000
Figure 4.
The comparison Carbon Stock between Field Observation and UAV Estimation at I Gusti Ngurah Rai Bypass
From the results of the regression analysis in table 3 and Figure 4, in Bajra Sandhi Renon Field, the value of R2 = 0.3291 is obtained, while at Bypass I Gusti Ngurah Rai Bypass Road has a value of R2 = 0.8113.
Paired Sample T-test is a method of testing hypotheses where the data used is not independent which is characterized by
the existence of a valued relationship in each of the same samples (in pairs). The level of significance or alpha value in this study was set at 0.05 or 5%, where if the P-value < 0.05 then there was a significant difference between the two variables used, if the P-value > 0.05 then there was no significant difference between the two variables used.
Table 3. t-Test Result Carbon Stock between Field Observation and UAV Estimation
|
Bajra Sandhi Renon Field |
I Gusti Ngurah Rai | |||
|
C Estimation |
C Observation |
C Estimation |
C Obsevation | |
|
Mean |
2108.088077 |
2180.625644 |
1624.913187 |
1630.395556 |
|
Variance |
563096.388 |
802210.2813 |
787556.2921 |
1541747.762 |
|
Observations |
26 |
26 |
18 |
18 |
|
Pearson Correlation |
0.573685354 |
0.900737077 | ||
|
Hypothesized Mean Difference |
0 |
0 | ||
|
Df |
25 |
17 | ||
|
t Stat |
-0.479843281 |
-0.039643925 | ||
|
P(T<=t) one-tail |
0.317755197 |
0.484419433 | ||
|
t Critical one-tail |
1.708140761 |
1.739606726 | ||
|
P(T<=t) two-tail |
0.635510395 |
0.968838866 | ||
|
t Critical two-tail |
2.059538553 |
2.109815578 | ||
The validation test results on the Bajra Sandhi Renon Field table are 0.635, and I Gusti Ngurah Rai Bypass 0.968. The results of the t-Test: Paired Two Sample for Means show that there is no significant difference between the carbon stock value from the observation field and the carbon stock from the UAV.
The relationship between DBH field data and data obtained by UAV which has the best R2 value is the relationship between Canopy Area and DBH on Road Landscaping 0.5221 and Urban Green Open Space 0.6808. Iizuka, et al (2018) in his research said the relationship between height and DBH is difficult to observe because height can vary depending on various environmental conditions,
especially microtopographic heterogeneity. The observed differences between the two study locations were attributed to the varying degree of human interventions in the treatments applied. The trees in the UGS area are better maintained compared to those along the RL.
The highest estimated AGB value in the Bajra Sandhi Renon Field using a UAV value is 331.68 kg with a stored carbon content of 155.89 kg, not much difference when compared to field observation data which has the highest AGB value of 346.57 kg with a stored carbon content of 162.89 kg. Meanwhile, in the Bypass I Gusti Ngurah Rai, the estimated AGB value by UAV when compared with the AGB value based on field observations also does not have
much difference in the highest AGB UAV, which is 193.96 kg with a stored carbon content of 91.16 kg and AGB field observation is 195.88 kg with a stored carbon content of 92.06 kg.
Paired Sample T-test is used to determine whether there is a difference in the average of two paired or related samples. The decision-making requirement for the best model is if the probability value or P <0.05, then there is a significant difference between the 2 variables used. Conversely, if the probability value or sig. (2-tailed) > 0.05 then there is no significant difference between the 2 variables used with a confidence interval of 95%, which means the research error rate is 5% or 0.05. From the study results, the Paired Sample T-test value at Bajra Sandhi Renon Field was 0.635 and I Gusti Ngurah Rai Bypass 0.484. So it can be said that the two locations have a P-value > 0.05, i.e. there is no significant difference between the value of the carbon stock field observation and the estimate obtained by the UAV. The observed differences between the two locations were attributed to the varying degree of human interventions in the treatments applied. The trees in the UGS area are better maintained compared to those along the RL.
Based on the results of research to estimate AGB and carbon stock by utilizing UAV aerial photography technology, it provides an opportunity to be applied to urban forest inventory activities as well as to shade plants in cities.
Research conducted at Bajra Sandhi Renon Field and I Gusti Ngurah Rai Bypass to estimate the dimensions of trees in an area of 5 ha only takes approximately 18 hours. This time is used starting from the preparation of the vehicle, taking aerial photos, photogrammetry, data analysis, and field sampling. Another study also showed that
it took 23 hours to analyze tree dimensions from aerial photographs of an area of 27 ha (Iizuka et al., 2018). Another study found that the UAV was able to fly and record over an area of 85 ha for 40 minutes with the help of 3 people and this is different from the conventional survey conducted by 6 people for an area of 0.25 ha for 8 days (Li et al., 2019). Navarro et al. (2020) conducted a cost analysis related to the use of UAVs (DJI Phantom 4 Advanced) and conventional surveys and it was found that the cost of using UAVs was cheaper than conventional surveys.
The ability of UAVs in assisting work in the field for data collection has been proven to save time and of course costs. This is because UAVs have the ability to move much more freely in the air than they do on the ground. UAVs also have the ability to fly at a certain altitude which can record objects on the ground in a wider area.
-
4. CONCLUSIONS AND SUGGESTIONS
In this study, it can be concluded that there is a relationship between Field Observations variables and UAV Measurement variables. The best coefficient of determination (R2) can be seen in the relationship between the value of the Canopy Area (UAV measurement) and DBH (field observation), which is higher between DBH and Canopy Perimeter and DBH with CHM. This situation applies to 2 research locations. At Road landscaping (Bypass I Gusti Ngurah Rai), the result Canopy area and DBH have a value of R2 (0.5221), and at Urban Green, Open Space (Bajra Sandhi Renon) has the R2 (0.6808) as the best result.
The highest AGB UAV estimation results at Bajra Sandhi Renon Field is
201.59 kg with a stored carbon content of 94.75 kg, and the highest AGB value at I Gusti Ngurah Rai Bypass Road is 215.04 kg with a stored carbon content of 101.07 kg.
Bajra Sandhi Renon Field (UGS) has a value of R2 = 0.3291, while Bypass I Gusti Ngurah Rai Bypass Road has a value of R2 = 0.8113. These calculations have been validated using Regression Analysis and Paired Sample T-test. The results showed significant levels of paired two samples(means) at the Bajra Sandhi Renon Field and the Byass I Gusti Ngurah Rai.
The method proves that there is no significant difference between the carbon stock value from the observation field and the carbon stock from the UAV. It can be concluded that the measurement method using UAV-sfm can be used to estimate carbon stock on Urban Vegetation.
It is recommended to conduct research with a more significant number of tree samples and find a solution to the problem of overlapping the canopy tree to obtain more representative data. It is hoped that future researchers will try to use UAVs in all shade trees and be able to compare the effectiveness of trees in storing carbon stocks. In the future, further research can assist the government in recommending trees to be planted.
REFERENCES
Abobsesa, F. M. O., Arief R., and Amin S.
-
L. 2018. Estimation of Carbon Dioxide and Carbon Stock of Vegetation along the Sukarno-Hatta Street Sides. J-PAL. 9(2). 98-101.
Adinugroho, W.C. 2010. Pendugaan Cadangan Karbon Dalam Rangka Pemanfaatan Fungsi Hutan Sebagai
Penyerap Karbon. Hutan dan Konservasi Alam. 3 (1): 103 – 117
Direktorat Jenderal Bina Marga, Direktorat Pembinaan Jalan Kota, Spesifikasi Tanaman Lansekap Jalan, No : 033/T/BM/1996
Dung, N. T. Pham M. T., Vu T. H., Le T. A., and Phung V. K. 2012. Tree Allometric Equation in Evergreen Broadleaf and Bamboo Forest In The North Central Region, Viet Nam. UN-REDD Programme, pp:1-69.
Iglhaut, J., Carlos C., Stefano P., Livia P., James O., and Jacqueline. R. 2019. Structure from Motion
Photogrammetry in Forestry: a
Review. Curr Forestry Rep.
5, 155168.
Iizuka, K., Yonehara, T., Itoh, M., and Kosugi, Y. 2018. Estimating tree height and Diameter at Breast Height (DBH) from digital surface models and orthophotos obtained with an unmanned aerial system for a Japanese Cypress (Chamaecyparis obtusa) Forest. Remote Sensing. 10(1).
https://doi.org/10.3390/rs10010013
IPCC. 2006. Guidelines for National Greenhouse Gas Inventories. Intergovernmental Panel on Climate Change National Greenhouse Gas Inventories Programme. IGES, Japan
Krause, S., Sanders, T. G. M., Mund, J. P., and Greve, K. 2019. UAV-based photogrammetric tree height measurement for intensive forest monitoring. Remote Sensing. 11, 1– 18.
https://doi.org/10.3390/rs11070758
Li, S., Yuan, F., Ata-Ui-Karim, S.T., Zheng, H., Cheng, T., Liu, X., Tian, Y., Zhu, Y., Cao, W., Cao, Q., 2019.
Combining color indices and textures of UAV-based digital imagery for rice LAI estimation. Remote Sensing. 11 (15), 1763.
Navarro, A., Mary Y, Allan, Carnell B, Macreadie P, Ierodiaconou P, and Daniel. 2020. The application of unmanned Aerial Vehicles (UAVs) to estimate above-ground biomass of mangrove ecosystems. Remote Sensing of Environment, 242, 111747
Panagiotidis, D., Azadeh A, Peter S, and Vasco C. 2016. Determining tree height and crown diameter from high-resolution UAV imagery, International Journal of Remote Sensing, DOI:
10.1080/01431161.2016.1264028
Rafael C. Gonzalez, Richard E. Woods. 2008. Digital Image Processing. 3rd ed. Prentice Hall, New Jersey, 2008
Rahayu, S, B. Lusiana, dan M. van Noordwijk. 2007. Pendugaan
Cadangan Karbon di Atas
Permukaan Tanah Pada Berbagai Sistem Penggunaan Lahan di Kabupaten Nunukan, Kalimantan
Timur. Bogor: World Agroforestry Centre.
Ramadhani, Y.H., Rokhmatulloh, R. & Susanti, R., 2015. Pemetaan pulau kecil dengan pendekatan berbasis objek menggunakan data unmanned aerial vehicle (uav). Majalah Ilmiah Globe, Globe, 17(2):125 -134.
Suhardimana, A., Satoshi T, Yunianto S. 2016. Estimating mean tree crown diameter of mangrove stands using aerial photo. Procedia
Environmental Sciences. 33 (2016) 416 – 427
Yurtseven, H., M. Akgul, S. Coban, and S. Gulci. 2019. Determination and Accuracy Analysis of Individual Tree Crown Parameters Using UAV Based Imagery and OBIA Techniques, Measurement. doi: https://doi.org/10.1016/j.measureme nt.2019.05.092.
Partama, I. G. Y. 2018. 3-D Recording of Slope Failure in Indonesian Tropical Peatland by UAV-photogrammetry. Conference: 70th (2018) Chugoku Branch Research Presentation Meeting Guidelines (Japan Society of Civil Engineering).
54
ECOTROPHIC • 17(1): 42-54 p-ISSN:1907-5626,e-ISSN: 2503-3395
Discussion and feedback