THE ACCURACY OF GILILAWA DARAT WILDFIRE SPREAD ESTIMATION USING BURN SEVERITY AND WRF-SFIRE MODEL
on
The Accuracy of Gililawa Darat Wildfire Spread Estimation..,
[Imam Barnadi, dkk]
THE ACCURACY OF GILILAWA DARAT WILDFIRE SPREAD ESTIMATION USING BURN SEVERITY AND WRF-SFIRE MODEL
Imam Barnadi1)*, Takahiro Osawa2), I Wayan Nuarsa3)
1)Forensic Laboratory Bureau, Bali Regional Police
2)Center for Research and Application of Satellite Remote Sensing (YUCARS), Yamaguchi University-Japan
3)Postgraduate, Environment Science, Udayana University-Denpasar, Bali
*Email: barnadi2011@polri.go.id
ABSTRACT
In this research, the origin of the wildfire area is assessed by using the potential of burn severity and the WRF-SFIRE model. This research focuses on the mountainous savanna region, by taking the case of the Gililawa Darat wildfire event. The most accurate index among Sentinel-2B optical burn severity indices, i.e. dNBR, MIRBI, dMIRBI, CSI, dCSI, NDVI, dNDVI, EVI, and dEVI and among Landsat-8 OLI/TIRS thermal and mixed burn severity indices, i.e. LST, dLST, LST/EVI, and d(LST/EVI) was used to map the areas with low burn severity, an indication generally found at origin area. A series of fire spread simulation from these areas was conducted using WRF-SFIRE to assess the accuracy of each simulation in reproducing the burned area. The burn severity accuracy assessment showed that dNBR and dCSI indices had the highest value of Overall Accuracy and Kappa Hat Coefficient, i.e. 91.67% and 0.889 (almost perfect agreement). However, dNBR was the most suitable index for mapping burn severity in the region due to its goodness-of-fit measure for linear regression model with the R-squared value of 0.7856. The assessment of thermal and mixed burn severity indices based on Landsat-8 OLI/TIRS resulted in LST, LST/EVI, and d(LST/EVI) gained the same overall accuracy of 58.33% and Kappa Hat Coefficient of 0.444 indicating moderate agreement, whereas dLST performed poorer than these indices. However, it is not recommended to use these burn severity indices in the region due to the nonlinearity of severity level with the index value. According to WRF-SFIRE simulations result, it was found that fire ignition started from low burn severity area coordinates which have a distance of 0 to 334 metres from the origin area resulting in fire area witan h overall accuracy value range from 77.04% to 81.90% and Kappa Hat Coefficient value range from 0.536 to 0.626. The simulation from the origin area resulted in an overall accuracy of 81.57%, a Kappa hat coefficient of 0.613, underestimated burned area ratio of 0.08, overestimated burned area ratio of 0.23, and a backing fire perimeter difference ratio of 0.4 to the reference.
Keywords: wildfire; Gililawa Darat; wildfire spread; burn severity; WRF-SFIRE, fire origin area
(Jhariya and Raj, 2014). Wildfire
-
1. INTRODUCTION investigations must be conducted to
determine the origin and causes of fires so Wildfires have many environmental, that fire events do not reoccur or become
social, and economic consequences less common (Bureau of Indian Affairs,
2019). In fire investigation, the observations of damage after the fire are frequently independent of the path taken by the fire, making it difficult to determine where the fire started (Gorbett et al., 2015). When the flames became too intense, it became difficult to read any patterns. Observing prominent and easily visible fire patterns from a distance appears best suited for areas with high fire intensity (Simeoni et al., 2017).
Burn severity which displays changes in objects and fuel when affected by a fire can be used as a fire pattern indicator. Satellite observation has a synoptic view capability to identify burn severity from a distance. This capability can view the fire patterns easier than close observation in the field. Remote sensing burn severity estimation can overcome extensive field surveys' cost and logistical constraints (Franco, et al., 2020).
The various fire pattern indicators, combined, analysed within fire behaviour, and compared with witness statements, can lead to the ignition area (National Wildfire Coordinating Group, 2016). Weather Research and Forecasting Model (WRF) with a Spread Fire model (WRF-SFire) can calculate the average and direction of
data from interpolated atmospheric models and land characteristics such as the type, amount/mass of land cover, moisture content, and elevation data (Lai et al., 2020).
Burn severity of a wildfire is essential for post-fire assessment and wildland management decisions (Barkley, 2019), and WRF–SFIRE can assist authorities in issuing fire bans and allocating firefighting and fire prevention resources (Mandel et al., 2014). Despite the current common uses, the potential use of the methods to determine wildfire origin areas was assessed in this research. The proposed method was assessed using the Gililawa Darat Island wildfire data, which occurred on 1st August 2018.
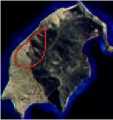
The research focused on large wildfires that burned Gililawa Darat island (Figure 1) on 1st August 2018 in a dry season. The fire was reported at around 19.00 Central Indonesia Time (CIT) and extinguished at 03.10 CIT on 2nd August 2018 (Balai Taman Nasional Komodo, 2018).
the fire using surface wind
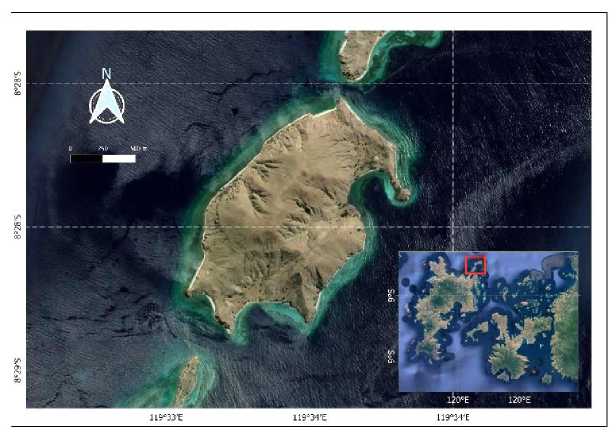
Figure 1.
Study Area
Gililawa Darat isa small island with an area of 40 hectares (from 8° 27' 39.5''S to 8° 28' 39.3''S and from 119° 33' 5.1''E to 119° 34' 1.1'’E. The island is a part of Komodo National Park in East Nusa Tenggara, and This island is included in the administrative area of the West Manggarai Regency. It has a hot and dry climate, characterized by savannah vegetation (Ramono et al., 2000).
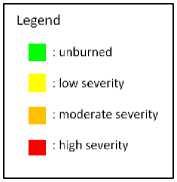
In this study, field observation data were obtained from the investigation that was conducted by a Forensic Investigator Team from the Denpasar Branch of the Indonesian National Police Forensic Laboratory Centre and West Manggarai Regency Police on the 5th and 6th August 2018. The Composite Burn Index (CBI) was used to estimate burn severity in the field. The severity is divided into four levels: unburned, low, moderate, and high (Key and Benson, 2006). A total of 30 plots (20 m x 20 m) were sampled within the perimeter of the burned area.
Based on the closest sensing date to the wildfire event and cloud free image, the two best datasets suitable for the study were selected from sentinel-2B images with sensing date 29th July 2018 and 8th August 2018. In the same way, the two datasets of Landsat-8 Operational Land Imager (OLI)/ Thermal Infrared Sensor (TIRS) Collection 2 Level-1 with sensing date 14th July 2018 and 15th August 2018 was obtained.
Simulations based on WRF-Fire required input data from various sources, from static surface properties to meteorological initial and boundary conditions. Static geographical data was downloaded from WRF Model Users' Page website at https://www2.mmm.ucar.edu/wrf/ users/. The digital elevation model data was built with National Digital Elevation Model (DEM) from DEMNAS BIG website at
http://tides.big.go.id/DEMNAS/. Fire
behaviour fuel model was built by reclassifying Normalized Difference Vegetation Index (NDVI) into 13 standards by Anderson fuel model (Anderson, 1982). The National Centers for Environmental Prediction (NCEP) Global Forecast System (GFS) 0.25-degree global forecast grids historical archive data (ds084.1) was used as meteorological gridded data.
The whole step of Burn Severity processing was performed using QGIS Software with Semi-Automatic
Classification Plugin using the Raster Calculator plugin with equations based on Stavrakoudis (2020), Zheng et al. (2016), and Yu et al. (2014) to calculate Sentinel-2B optical burn severity indices, i.e.
-
1. differenced Normalized Burn (dNBR).
_ nNIR - ISWIR NBR = + ISWIR
dNBR = - NBRpost-f ire
-
2. Mid-Infrared Bispectral
(MIRBI).
MIRBI=10∙B12 – 9․8∙B11 + 2
Ratio
(1)
(2)
Index
(3)
-
3. differenced Mid-Infrared Bispectral Index (dMIRBI)
dMIRBI = - MIRBIp0St_^[re
-
4. Char Soil Index (CSI).
nNIR
CSI =-----
=
(4)
(5)
-
5. differenced Char Soil Index (dCSI).
dCSI =
-
CSIp0st-fire
(6)
6. Normalized Difference Vegetation al., 2020). To obtain optimal thresholds, Index (NDVI). several trials were conducted for each
spectral index (Marino et al., 2016). The
nNIR - RED
NDVI =--------- nNIR + RED
(7)) most suitable burn severity index was
7. differenced Normalized Difference Vegetation Index (dNDVI).
dNDVI = - NDVIp0st-fire
(8)
determined using error matrix and was used to map the areas with low burn severity, an indication generally found at origin area (The National Wildfire Coordinating Group, 2016; Simeoni et al., 2017).
A series of fire spread simulation from
8. Enhanced Vegetation Index (EVI).
EVI =2,5×
ι NIR - RED '
(NIR+6RED -7,5×BLUE+1
(9)
9. differenced Enhanced Vegetation
Index (dEVI).
dEVI = - EVIpost-fire (10)
10. Thermal Metric LST.
=
BT
1+
0,00115BT1
1,4388-lnε
(11)
the low burn severity areas was conducted using WRF-SFIRE to assess the accuracy of each simulation in reproducing the burned area. Multiple domains were run simultaneously at different grid resolutions in a two-way nested run. The coarse-to-fine grid ratio was five, thereby, atmospheric initialization (about 25 km) could be scaled down to the fire grid resolution (about 200 m). The fire model (coupled with the innermost domain) ran with mesh step 20 m. The time step for the inner domain and the fire model was 1,2 s, while for the outermost domain d01 it was 150 s. Initial conditions for all
11. differenced Thermal Metric (dLST).
dLST =
-
LSTpre-f[re (12)
12. Mixed metric
LST
EVI

(13)
(14)
The continuous burn severity indices dataset was stratified into severity levels based on threshold levels to simplify the burned area description and comparison. Using the mean of the median index values for each consecutive pair of fire severity classes: unburned-low, low-moderate, and moderate-high, threshold values were calculated (Tran et al., 2018). The thresholds were adjusted until the highest percentage of samples was correctly classified (Franco et
domains and boundary conditions for the outermost domain d01 were extracted from the NCEP GDAS/FNL 0.25 Degree Global Tropospheric Analyses and Forecast Grids (ds083.3). Model initialization is placed at 09:00:00 on the 31st of July 2018 UTC, more than 24 hours prior to the fire ignition, while the simulation time window is 9 hours. The model obtained files containing FIRE_AREA variable and it was used to asses the accuracy of the model by comparing the fire perimeter of the model with the reference (the most suitable burn severity index map).
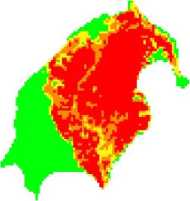
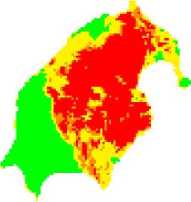
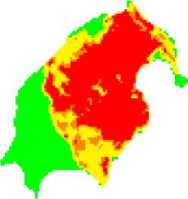
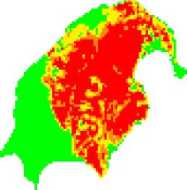
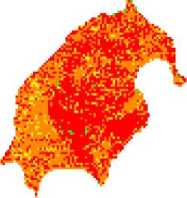
In dNBR, MIRBI, dMIRBI, CSI, and dCSI map, the locations of unburned areas corresponded accurately to the actual situation which covered almost
only southwest region of the island. dMBR and dCSI were very similar in distributing all burn severity levels at entire region. In MIRBI and dMIRBI maps, more low severity areas were identified than those of dNBR, CSI, and dCSI maps. The wrong location of unburned areas among the burned areas was identified in CSI map. NDVI,
dNDVI, EVI, and dEVI showed the worst scattering of unburned and burned areas at wrong locations. However, NDVI and dEVI could recognize unburned areas better that dNDVI and EVI. Figure 2 shows difference in the distribution of burn severity levels when comparing the burn severity indices maps.
(a) dNBR
(b) MIRBI
(c) dMIRBI
(d) CSI
(e) dCSI
(f) NDVI
2 km
(g) dNDVI
(h) EVI
(h) dEVI
0
-
Figure 2.
Optical Burn Severity Index Maps of Gililawa Darat island based on Sentinel-2B datasets, that is: (a) dNBR, (b) MIRBI, (c) dMIRBI, (d) CSI, (e) dCSI, (f) NDVI, (g) dNDVI, (h) EVI, and (i) dEVI.
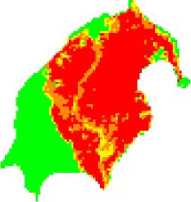
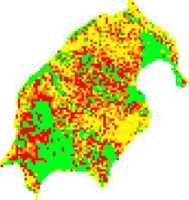
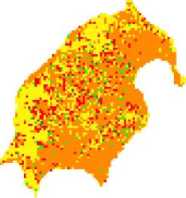
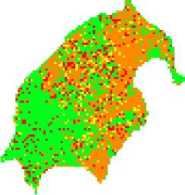
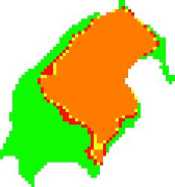
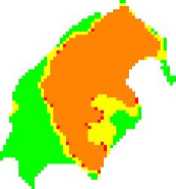
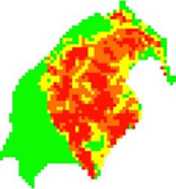
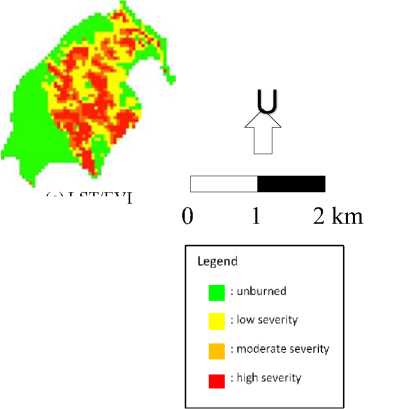
A large difference is also observed between thermal burn severity indices, i.e. LST and dLST and mixed burn severity indices, i.e. LST/EVI and d(LST/EVI) which were based on Landsart-8 OLI/TIRS datasets as shown in Figure 3. In the LST and dLST map, large areas of
moderate burn severity (orange) were clustered in the middle part of burned areas. The unburned area was overestimated in LST and dLST map covering the south east part of the island which was burned. In dLST map, there were unburned and low burn severity
areas which were mistakenly assigned at the wrong location, i.e. the areas in the west and south east part of the island. The mixed burn severity indices (LST/EVI
(a) LST
(b) dLST
(e) d(LST/EVI)
and d(LST/EVI)) showed the better distribution of burn severity levels but there were still large unburned areas that were identified at wrong locations.
(c)
LST/EVI
Figure 3.
Thermal and Mixed Burn Severity Maps Gililawa Darat Island Based on Landsat-8 OLI/TIRS Datasets, that is: (a) EVI, (b) dEVI, (c) LST, (d) dLST, (e) LST/EVI, (f) d(LST/EVI).
Burn severity estimated by dNBR and dCSI resulted in an overall accuracy of 91.67% and the user’s accuracy for the four burn severity levels was from 75% to 100% as shown in Table 1, indicating that these indices were good for estimating burn severity. The Kappa Hat Coefficient of these two indices were 0.889 indicating the almost perfect agreement. dNBR and dCSI performed especially well for discriminating low severity areas with unburned, moderate, and high severity areas. dNBR and dCSI had slight difficulty in separating moderate (a producer’s accuracy of 66.67%) and high (a user’s accuracy of 75%) burn severity levels. The second most accurate map was the CSI map with an overall accuracy of 75%, it did not identify all severity levels areas perfectly. CSI had a substantial level of agreement
with Kappa Hat Coefficient of 0.667. MIRBI and dMIRBI had the same overall accuracy of 58.33% and Kappa Hat Coefficient of 0.667 0.444 indicating moderate agreement. NDVI, dNDVI, EVI and dEVI showed little accuracy with overall accuracy values ranged from 16.6% to 33.33% and Kappa Hat Coefficient values ranged from -0.111 to 0.111 indicating no agreement and slight agreement. Among the Landsat-8 OLI/TIRS thermal and mixed indices in Table 2, i.e. LST, dLST, LST/EVI, and d(LST/EVI), dLST showed the lowest overall accuracy with the value of 50% and Kappa Hat Coefficient of 0.333 indicating fair agreement. LST, LST/EVI, and d(LST/EVI) showed the same overall accuracy of 58.33% and Kappa Hat Coefficient of 0.444 indicating moderate agreement.
|
Table 1. |
Accuracy Assessment of the Optical Burn Sentinel-2B Datasets |
Severity Indices Based on | ||||||||
|
UA |
PA |
Kappa | ||||||||
|
OA |
Hat | |||||||||
|
U |
L |
M |
H |
U |
L |
M |
H |
Coeffic | ||
|
ient | ||||||||||
|
dNBR |
100 |
100 |
100 |
75 |
100 |
100 |
66.67 |
100 |
91.67 |
0.889 |
|
MIRBI |
100 |
75 |
0 |
33.33 |
100 |
100 |
0 |
33.33 |
58.33 |
0.444 |
|
dMIRBI |
100 |
50 |
0 |
40 |
100 |
66.67 |
0 |
66,67 |
58.33 |
0.444 |
|
CSI |
100 |
66.67 |
60 |
100 |
66.67 |
66.67 |
100 |
66.67 |
75 |
0.667 |
|
dCSI |
100 |
100 |
100 |
75 |
100 |
100 |
66.67 |
100 |
91.67 |
0.889 |
|
NDVI |
100 |
20 |
0 |
20 |
66.67 |
33.33 |
0 |
33.33 |
33.33 |
0.111 |
|
dNDVI |
0 |
0 |
0 |
42.86 |
0 |
0 |
0 |
100 |
25 |
0 |
|
EVI |
0 |
16.67 |
25 |
0 |
0 |
33.33 |
33.33 |
0 |
16.67 |
-0.111 |
|
dEVI |
42.87 |
0 |
0 |
50 |
100 |
0 |
0 |
33.33 |
33.33 |
0.111 |
U: unburned, L: Low severity, M: Moderate severity, and H: High severity.
Table 2. Accuracy Assessment of the Thermal and Mixed Burn Severity Indices Based on Landsat-8 OLI/TIRS Datasets
|
UA |
PA |
OA |
Kappa Hat Coeffic ient | |||||||
|
U |
L |
M |
H |
U |
L |
M |
H | |||
|
LST |
50 |
66.67 |
100 |
50 |
100 |
66.67 |
33.33 |
33.33 |
58.33 |
0.444 |
|
dLST |
100 |
50 |
0 |
50 |
66.67 |
100 |
0 |
66.67 |
58.33 |
0.444 |
|
LST/EVI |
75 |
50 |
0 |
50 |
100 |
66.67 |
0 |
0.67 |
33.33 |
0.333 |
|
d(LST/EVI) |
100 |
60 |
0 |
50 |
100 |
100 |
0 |
33.33 |
58.33 |
0.444 |
U: unburned, L: Low severity, M: Moderate severity, and H: High severity.
The accuracy assessment on the optical burn severity indices that were based on Sentinel-2B datasets, dNBR and dCSI had the highest accuracy level and could discriminate areas with low burn severity well. However, dNBR was more convincing to be used obtain fire ignition start coordinate inputs for WRF-SFIRE model by considering the regression analysis of training plots burn severity value that showed the highest R-squared value. Whereas the thermal and mixed burn severity indices that were based on Landsat-8 OLI/TIRS datasets was not satisfying enough to be used due to the incapability of all indices in discriminating low severity areas well.
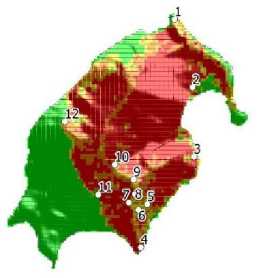
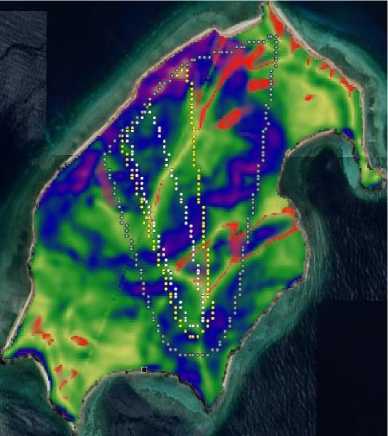
Fire ignition start coordinate inputs of the WRF-SFIRE model were selected from 12 coordinates of the low burn severity
area of dNBR index map representatively. Coordinates 5, 6, 8, and 9 was closer to coordinates 7 that represented the origin area that the other coordinates. This selection was carried out with due observance of cardinal and ordinal points to assess the trend of the final fire perimeter, as depicted in Figure 4.
Using dNBR map as a reference, the error matrix was arranged to evaluate the fire area agreement between reference and WRF-SFIRE estimation as shown in Figure 5. Total 3868 points coordinates that were represented all pixels in dNBR map were used to arrange the error matrix. The assessment was carried out by inspecting whether the coordinates covered by WRF-SFIRE fire area output or not.

0 500
1000 m
Legend
: unburned
: low severity
: moderate severity
-
Figure 4.
The dNBR Low Severity Area Coordinates Selected as WRF-SFIRE Fire Ignition Start Coordinates
(10)
(3)
U
(6)
2 km
(9)
(11) (12)
-
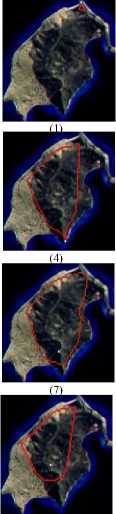
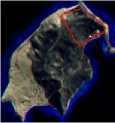
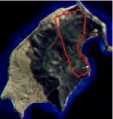
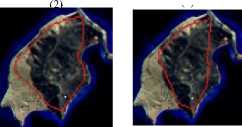
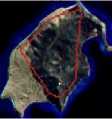
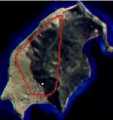
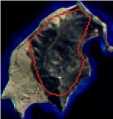
Figure 5.
Fire Perimeters of the Simulated Wildfire (Red Line), Which Was Started from 12 Different Locations (White Dots) Compared with the Burned Area (Black Color) of dNBR.
As shown in Table 3, even though the fire area result of the simulation which used the valid fire ignition start coordinate (coordinate 7) had a good agreement with reference (the overall accuracy of 81.57% and the Kappa hat coefficient of 0.626), this performance was still below that of
the simulation which used a false fire ignition start at coordinate 9 (the overall accuracy of 81.90% and the Kappa hat coefficient of 0.613). However, the tendency of better agreement between reference and estimation for the simulations that used fire ignition start
coordinates near the valid fire ignition start coordinate could be used to be initial assessment of the most potential valid fire ignition start coordinate. It was apparent that the simulation that used the fire
ignition start coordinate closed to origin area had the overall accuracy around 80% and the Kappa Hat Coefficient above 0,5 (moderate agreement).
Table 3. Assessment of Burned and Unburned Points Coordinates Agreement of WRF-SFIRE Output with Those of dNBR
|
Coordinate |
UA |
PA |
OA |
Kappa Hat Coefficient | ||
|
U |
M |
U |
M | |||
|
1 |
30.42 |
100 |
100 |
0.81 |
30.81 |
0.005 |
|
2 |
34.39 |
95.20 |
97.77 |
19.12 |
42.91 |
0.111 |
|
3 |
37.25 |
96.40 |
97.52 |
28.76 |
49.56 |
0.180 |
|
4 |
55.96 |
97.63 |
96.23 |
67.16 |
75.95 |
0.527 |
|
5 |
63.95 |
88.89 |
76.58 |
81.28 |
79.86 |
0.548 |
|
6 |
59.55 |
97.72 |
96.15 |
71.68 |
79.08 |
0.578 |
|
7 |
63.42 |
95.84 |
92.31 |
76/91 |
81/57 |
0.613 |
|
8 |
57.49 |
95.57 |
92.48 |
70.35 |
77.04 |
0.536 |
|
9 |
63.25 |
97.70 |
95.89 |
75.83 |
81.90 |
0.626 |
|
10 |
45.83 |
93.99 |
92.22 |
52.74 |
64.68 |
0.349 |
|
11 |
33.02 |
74.51 |
68.97 |
39.32 |
48.29 |
0.063 |
|
12 |
29.58 |
64.87 |
86.07 |
11.15 |
33.81 |
-0.018 |
Although simulation from coordinate 7 generated larger overestimated burned area than those of coordinate 9, however the underestimated area result was smaller. The overestimated burned areas of simulations using coordinates 11 and 12 were at the fire's west flank, which was propagated mainly by lateral fire in the southwest and was also contributed by backing fire in the south direction. These fire spreads were resulted from placing the fire ignition start coordinates 11 and 12 on the west flank of dNBR’s burned area perimeter, therefore, the southwest wind blow caused lateral fire to spread outward from the fire perimeter of the dNBR. The incorrect placement of fire ignition starts at coordinate 5 also resulted in the overestimation of fire area. However, coordinate 5 should not be taken into consideration due to the location had not been burned yet at least until 16.00 UTC according to the
information from National Park personnel. On the other hand, all simulations except those that used coordinate 1 and 2, resulted in underestimation of fire area at east region of the island. The model seemed to be unable to capture the lateral spread at the flank side of the fire. Moreover, all simulations could not reach the backing region that located at the south edge of the island. However, the fire simulations that started from the valid fire ignition start coordinate (coordinate 7) and the nearby coordinates (coordinate 4, 5, 6, 8, and 9) showed the shape and extent of backing region that was closer to the reference. Coordinate 4 could be excluded from the analysis due to it had not been burned yet at the beginning of the actual event, therefore coordinate 7 generated the closest backing fire region to the reference.
Tabel 4. Assessment of Overestimated Burned Area, Underestimated Burned Area and Backing Fire Difference
|
No. |
Fire ignitions start coordinate |
Approx distance from origin area (m) |
Overestimate d ratio to reference burned area |
Underestimated ratio to reference burned area |
Backing fire perimeter difference ratio to reference |
|
1 |
-8.4614, 119.5622 |
1357 |
0.00 |
0.99 |
0.92 |
|
2 |
-8.4658, 119.5634 |
945 |
0.02 |
0.81 |
0.84 |
|
3 |
-8.4703, 119.5635 |
573 |
0.02 |
0.71 |
0.74 |
|
4 |
-8.4762, 119.5601 |
334 |
0.04 |
0.33 |
1.00 |
|
5 |
-8.4734, 119.5605 |
133 |
0.23 |
0.19 |
0.35 |
|
6 |
-8.4737, 119.5599 |
87 |
0.04 |
0.28 |
0.47 |
|
7 |
-8.4733, 119.5593 |
0 |
0.08 |
0.23 |
0.40 |
|
8 |
-8.4727, 119.5597 |
76 |
0.08 |
0.29 |
0.53 |
|
9 |
-8.4718, 119.5596 |
170 |
0.04 |
0.24 |
0.47 |
|
10 |
-8.4708, 119.5584 |
290 |
0.08 |
0.47 |
0.62 |
|
11 |
-8.4728, 119.5573 |
232 |
0.31 |
0.61 |
0.65 |
|
12 |
-8.4681, 119.5551 |
745 |
0.14 |
0.89 |
0.77 |
Assessment of overestimated burned area, underestimated burned area and backing fire difference in Table 5.10 shows that the simulation from coordinate 7 gained the smaller backing fire difference and underestimated area than those of coordinate 9. There was a tendency of the farther the coordinate from fire origin area, the smaller the differences.
Based on the analysis of error matrix of burned area and fire vector spread particularly backing fire spread, the simulation that used the valid fire ignition start coordinate (coordinate 7) reproduced the fire area that was closest to the
ignition start coordinate
Moderate and high severity area spectral signature that overlapped at SWIR band as shown in Figure 5 was needed to be paid attention because it could bring out the inaccuracy problem, especially for indices that only employ SWIR bands, i.e., MIRBI and dMIRBI. These areas were indicated by little change between moderate and high severity, with only a little light-coloured soil exposure reflectance decrease could be identified.
reference than those of using the false
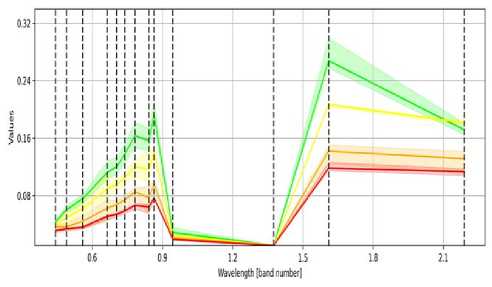
Figure 6.
Sentinel-2B Spectral Signature of Burn Severity Area. Green: Unburned, Yellow: low, Orange: Moderate, Red: High
The spectral signature of moderate and high severity areas that overlapped at the Visible and NIR band also could affect the accuracy of indices based on these bands. NDVI, dNDVI, EVI, and dEVI which employ these bands performed worse than NIR-SWIR spectral indices, i.e., dNBR, CSI, and dCSI, indicating the SWIR band outperformed the Visible band in burn severity detection, especially in discriminating moderate area and high severity area. Although the decrease of Visible reflectance and SWIR reflectance depended on the increase of black char, the different widths of SWIR band reflectance were more significant than Visible band reflectance. Kumar and Roy (2018) simulated the spectral response of different fires and found that fires with a larger size and higher temperature had higher reflectance values in the longer wavelength bands (e.g. SWIR) and negligible contribution in the Red band. Frazer et al. (2010) also mentioned that the NIR-SWIR bands enabled burned areas to be more easily discriminated against than the NIR-visible bands.
Visible-NIR indices, i.e. NDVI, dNDVI, EVI and dEVI showed poor performance. Since soils may contain organic materials and chemical constituents that could alter the reflectivity of the red band, using red band values does not model areas of exposed soil well. Also, burn severity and vegetation cover results may overlap, causing the findings to be overestimated (Wheeler, 2022). Hence the NDVI and dNDVI values appear not to be correlated to either burn severity and vegetation cover. Although, EVI as a modified version of NDVI that has been adapted
for soil color and aerosol scattering and has improved sensitivity to areas which are rich in biomass (Ellsworth, 2012) could not outperformed NDVI due to the dry condition of the region. In addition, gray, which belongs to the blue spectral range, can be reflected from ash and char (Lewis et al., 2021) also could not be identified due to very little grey ash in the burned area.
Figure 7 depicts the increase of DN (Digital Number) values in band 10 Thermal Infrared 1 at the burned area. This increase was similar to the result of research conducted by Kafy et al. (2021), which showed an increase in Land Surface Temperature due to reducing vegetation cover. However, there were some problems using only this TIRS1 data for burn severity assessment in Gililawa Darat. First, the order of increasing DN values did not correspond directly with the increasing order of burn severity level. The DN values of the high severity area were not the highest; instead, those of the low severity area were the highest, and the DN value of the high severity area was only one level above the unburned area. Second, all burn severity classes overlapped, indicating poor accuracy of all severity classes. Consequently, if only Land Surface Temperature (LST) values were used to assess the burn severity at the burned area, there would be incorrectness in assigning high severity and low severity areas. Integrating LST with other burn severity such as EVI (Enhanced Vegetation Index) for burn severity assessment would probably produce better accuracy.
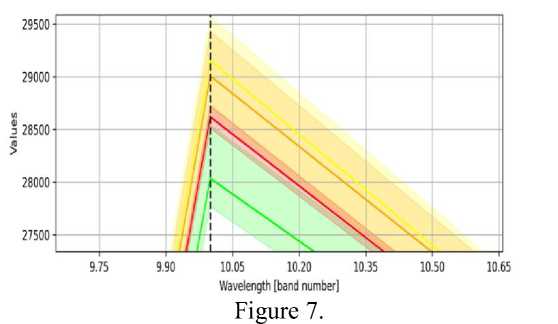
Landsat 8 OLI/TIRS Band 10 Spectral Signature of Burn Severity Area. Green: Unburned, Yellow: Low, Orange: Moderate, Red: High
All thermal indices had low Overall capacity and Kappa hat coefficient, indicating little agreement between burn severity and LST. The LST increase was detected in the burned area, but no increase linearity between LST and burn severity. Indeed, the decrease of vegetation in the burned area and the appearance of lower emissivity coverage (ash, char, and mineral soils) lead to a significant increase in the LST. However, aspect and illumination geometry also increase LST contrast in the different burn severity areas, so the better-illuminated slopes have higher contrast (Vlassova et al., 2014). Therefore, the nonlinearity of increase between LST and burn severity may be due to topographic influence, i.e., aspect and altitudinal differences. Thermal metrics are best to assess soil burn severity in locations with homogeneity in topography and moisture (Fernández-García et al, 2018), but they could not work well in Gililawa Darat that has topography heterogeneity. The previous research by Quintano et al. (2015) confirmed that topographic variables (elevation and aspect) related to LST contrast. Figure 6.5 depicts the relationship between burn severity, topographic variables, and LST. The more severe area in the high position, which faced north, tended to have higher LST. Indeed, integrating thermal with optical
bands (LST/EVI and dLST/EVI) performed better than thermal metrics, but they did not exceed optical indices accuracy. This result was similar with the research result of Fernández-García et al. (2018).
This research result showed that the using of error matrix method alone to assess the agreement between burned area between reference and estimation (Salis et al., 2016; Giannaros et al., 2020) was not reliable for determining the correct fire ignition start coordinate. However, it could be used as a preliminary assessment to refine the low burned areas into the more potential fire origin area.
In this research, some simulations showed overestimation and underestimation of fire area. According to Rim et al. (2018) and Giannaros et al. (2020), the overestimated burned area of WRF-SFIRE output could be caused by overestimating wind speed due to the coarse atmospheric-fire model mesh. However, the overestimation in some simulations in this research was not caused by coarse mesh due to the overestimation did not occur evenly at all fire area. It seemed that the simulated fire spread shifted from the actual fire perimeter, therefore, apart from having an overestimated area at one flank, an underestimated area is also found at the opposite flank. Furthermore, Mandel et al.
(2011) did not observe the overlarge fire spread at 400-metre resolution, whereas this research used a finer resolution (200-metre) that could not possibly cause the overestimation of fire area.
On the other hand, the large underestimated burned area output could be attributed to an incorrect fire ignition start coordinate as mentioned by Giannaros et al. (2020) or to the incapacity of WRF-SFIRE to capture the extensive mid to long-range spotting. Simpsons et al. (2015) pointed out that on steep slopes, a wildfire spread model which was based on fuel properties, wind, and slope, but without a mid-to long-range spotting model, would understate the downwind extent of atypical lateral fire spread in a direction transverse to the background wind. During severe fires in rough terrain, vorticity-driven lateral spread (VLS) might occur. Wind and topography could interact to create lee slope eddies (rotors) that conveyed firebrands across the direction of the ambient wind, sparking many spot fires near the fire flanks. These spot fires subsequently merged with other spot fires and the fire edge, significantly increasing the rate of spread (ROS) of a fire flank (Hilton et al., 2019; Storey, 2021a). Spotting could accelerate dynamic spread caused by interactions between wind, steep slopes, and active fire, resulting in rapid lateral fire spread over ridges perpendicular to the primary wind direction. Most existing operational fire spread models had a severe weakness in capturing the influence of spots. (Storey, 2021b). Based on previous research by Simpson et al. (2016), lee fire whirls, which spread the fire laterally across the ridge, required steep lee-facing slopes, sufficient wind speed, and proper wind direction relative to the terrain aspect. Slope steepness at 20° required wind speed between 5 and 7.5 m s-1 and between 10 and 15 m s-1, 30° steepness
needed wind speed between 7.5 and 10 m s-1, and steepness of 40° would allow pyrogenic vorticity, which developed and drove lateral spread if the wind speed was around 7.5 m s-1. Background wind is required to be angled between 20° and 30° relative to the terrain aspect. Because the wind direction was between 350° and 355° when the fire spread almost reached the east region, fire whirls would occur at lee ridge with terrain aspect between 10° – 25°. Figure 6.11 shows the area where pyrogenic vorticity and fire whirls might occur when the fire spread reached (based on fire spread of valid fire ignition start coordinate). However, without the spotting model, the lateral spread was too slow to capture east region resulting in underestimation of the east flank of the fire area.
In addition, the simulation was also unable to capture the backing region of the fire area as close as the actual fire spread. This underestimation was most likely due to a simplified approach to backing fire ROS in the Rothermel model. The simplified analytical rate of spread (ROS) was used by empirical models to estimate the propagation of a fire as a function of time (Bakhshaii and Johnson, 2018). When the wind component normal to the fire line was present, the constant no-wind rate of spread was still used as a backing fire ROS (Coen, 2013). At the same time, there is no general backing fire ROS, and its evolution needs to be modelled with different spread mechanisms (Kochanski et al., 2013b). Kochanski et al. (2013a and 2013b) and Peace (2014) identified that the Rothermel default no-wind ROS (which affects the flanks and backing fire spread) validates poorly for their study, and the same is likely to apply in the cases observed in this research. It could be understood that the model was mainly designed for wildfire risk management and firefighting (Mandel et al., 2014;
Bakhshaii and Johnson, 2018); therefore, it focuses on the most active progression of the fire perimeter meanwhile backing
fire which is the slowest spread among the fire’s spread vectors (Coen et al., 2013) got less attention.
Legend
:terrain aspect 50’- 65’
H Islopesteepness 20*
ιslope steepness 30'
!slope steepness 40*
-----: fire perimeter at 12:00:00 UTC
: fire perimeter at 13:00:00 UTC
: fire perimeter at 12:00:00 UTC
Figure 8.
The Region with Possible Pyrogenic Vorticity and Fire Whirls
-
4. CONCLUSION AND SUGGESTION
Among the optical burn severity indices based on Sentinel-2B datasets that was asessed, i.e. dNBR, MIRBI, dMIRBI, CSI, dCSI, NDVI, dNDVI, EVI, and dEVI, dNBR and dCSI indices was the most suitable indices for mapping burn severity area in Gillawa Darat island.
WRF-SFIRE could be customized and applied for simulating wildfire spread in Gililawa Darat island by providing the model with several datasets, i.e. National Digital Elevation Model (DEMNAS) from from DEMNAS BIG website at http: //tides.big.go.id/DEMNAS/, fire behavior fuel model in accordance with specific condition in the region using NDVI index to map the existing vegetations, and static geographical datasets and NCEP GDAS/FNL 0.25 Degree Global Tropospheric Analyses and Forecast
Grids (ds083.3) meteorological datasets as initial and boundary conditions input from National Center for Atmospheric Research (NCAR). A series of WRF-SFIRE simulation using selected low burn severity coordinates of dNBR burn severity index map as fire ignition start coordinates showed that simulations from fire ignition start coordinates closed to origin area had the overall accuracy around 80% and the Kappa Hat Coefficient above 0,5 (moderate agreement).
A spotting model for fire flanks at steep slope must be developed in order to improve the functionality of WRF-Fire for covering the underestimation of the fire flank. An advanced research on backing fire spread can be conducted on improving model formulations in WRF-SFIRE in order to be able to approach the actual backing fire spread. The possibility of using the surface wind from geostationary satellites data with high
temporal and spatial resolution, such as Himawari-8 data was need to be researched to substitute the wind derived from forecast or analysis meteorological data in order to approach the real condition
REFERENCES
Anderson, H. E. 1982. Aids to Determining Fuel Models for Estimating Fire Behavior. Utah: U.S. Department of Agriculture.
Bakhshaii, A. and Johnson, E.A. 2019. A Review of a New Generation of Wildfire–Atmosphere Modeling. Canadian Journal of Forest Research, 49(6): 565-574.
https://doi.org/10.1139/cjfr-2018-0138.
Balai Taman Nasional Komodo. 2018. Siaran Pers Kebakaran di Gili Lawa Darat Taman Nasional Komodo. Manggarai Barat.
Barkley, Y. 2019. How to Determine Burn Severity After a Wildfire. Surviving Wildfire. [cited 2021 August 9]. Available from: URL: https://surviving-wildfire.extension.org/how-to-determine-burn-severity-after-a-wildfire/.
Bureau of Indian Affairs. Office of Trust Services. 2019. Wildland Fire Origin and Cause Investigation
Handbook. Washington: Division of Forestry and Wildland Fire Management.
Coen, J.L., Cameron, M., Michalakes, J., Patton, E.G., Riggan, P.J., Yedinak, K.M. 2013. WRF-Fire: Coupled Weather–Wildland Fire Modeling with the Weather Research and Forecasting Model. Journal of Applied Meteorology and
Climatology, 52:16-38.
https://doi.org/ 10.1175/JAMC-D-12-023.1.
Ellsworth, L.M. 2012. Improved Wildfire Management in Mega Thyrsus
Maximus Dominated Ecosystems in Hawai’i. (dissertation). Manoa:
University of Hawai’i.
Fernández-García, V., Santamarta, M., Fernández-Manso, A., Quintano, C., Marcos, E., Calvo, L. 2018. Burn Severity Metrics in Fire-Prone Pine Eecosystems Along A Climatic Gradient Using Landsat imagery. Remote Sensing of Environment, 206:205–217.
Franco, M.G., Mundo, I.A., Veblen, T.T. 2020. Field-Validated BurnSeverity Mapping in North Patagonian Forests. Remote Sensing, 12:214.
https://doi.org/10.3390/rs12020214.
Giannaros, T.M., Lagouvardos, K., Kotroni, V. 2020. Performance Evaluation of an Operational Rapid Response Fire Spread Forecasting System in the Southeast Mediterranean (Greece).
Atmosphere, 11:1264.
https://doi.org/10.3390/atmos11111 264.
Gorbett, G.E., Meacham, B.J., Wood, C.B., Dembsey, N.A. 2015. Use of Damage in Fire Investigation: A Review of Fire Patterns Analysis, Research and Future Direction. Fire Science Reviews, 4:4.
https://doi.org/10.1186/s40038-015-0008-4.
Jhariya, M.K. and Raj, A. 2014. Effects of Wildfires on Flora, Fauna and Physico-Chemical Properties of Soil-An Overview. Journal of
Applied and Natural Science,
6(2):887-897.
https://doi.org/10.31018/jans.v6i2.5 50.
Kafy, A., Al Rakib, A., Akter, K., Rahaman, Z., Faisal, A., Mallik, S., Nasher, N.M., Hossain, Md., Ali, Y. 2021. Monitoring the Effects of Vegetation Cover Losses on Land Surface Temperature Dynamics Using Geospatial Approach in Rajshahi City, Bangladesh.
Environmental Challenges,
4(100187).
https://doi.org/10.1016/j.envc.2021. 100187
Key, C.H. and Benson, N.C. 2006. Landscape Assessment: Sampling and Analysis Methods. Colorado: USDA Forest Service, Rocky Mountain Research Station.
Kochanski, A.K., Jenkins, M.A., Mandel, J., Beezley, J.D., Krueger, S.K. 2013a. Real Time Simulation of 2007 Santa Ana Fires. Forest Ecology and Management, 294:136149.
https://doi.org/10.1016/j.foreco.201 2.12.014.
Kochanski, A. K., Jenkins, M. A.,
Mandel, J., Beezley, J. D.,
Clements, C. B., Krueger, S. 2013b. Evaluation of WRF-SFIRE
Performance with Field
Observations from The Fireflux Experiment. Geoscience Model
Development, 6:1109–1126.
https://doi.org/10.5194/gmd-6-1109-2013.
Kumar, S.S. and Roy, D.P. 2018. Global Operational Land Imager Landsat-8 Reflectance Based Active Fire Detection Algorithm. International Journal of Digital Earth, 11:154– 178.
https://doi.org/10.1080/17538947.2 017.1391341.
Lai, S., Chen, H., He, F., Wu, W. 2020. Sensitivity Experiments of the Local Wildland Fire with WRF-Fire
Module. Asia-Pacific Journal of Atmospheric Sciences, 56:533–547. https://doi.org/10.1007/s13143-019-00160-7.
Lassalle, G. 2019. “Exploitation of Hyperspectral Data for Assessing Vegetation Health under Exposure to Petroleum Hydrocarbons” (thesis). Toulouse: University of Toulouse.
Lewis, S.A., Robichaud, P.R., Hudak, A.T., Strand, E.K., Eitel, J.U.H., Brown, R.E. 2021. Evaluating the Persistence of Post-Wildfire Ash: A Multi-Platform Spatiotemporal
Analysis. Fire, 4(68). https://
doi.org/10.3390/fire4040068.
Mandel, J., Beezley, J., Kochanski, A., Kondratenko, V., Zhang, L., Anderson, E., Daniels, J., Silva, C., Johnson, C. 2011. A Wildland Fire Modeling and Visualization
Environment. Paper presented at the Ninth Symposium on Fire and Forest Meteorology. California, 1720 Oktober.
Mandel, J., Amram, S., Beezley, J.D., Kelman, G., Kochanski, A.K., Kondratenko, V.Y., Lynn, B.H., Regev, B., Vejmelka, M. 2014. Recent Advances and Applications of WRF–SFIRE. Natural Hazards and Earth System Sciences,
14:2829–2845.
https://doi.org/10.5194/nhess-14-2829-2014.
Marino, E., Guillen-Climent, M., Ranz Vega, P., and Tomé, J. 2016. Fire Severity Mapping in Garajonay National Park: Comparison
Between Spectral Indices.
FLAMMA, 7:22-28.
Peace, M. 2014. “Coupled FireAtmosphere Simulations of Three Australian Fires Where Unusual Fire Behavior Occurred” (thesis).
Adelaide: University of Adelaide.
Quintano, C., Fernández-Manso, A., Calvo, L., Marcos, E., Valbuena, L. 2015. Land Surface Temperature as Potential Indicator of Burn Severity in Forest Mediterranean
Ecosystems. International Journal of Applied Earth Observation and Geoinformation, 36:1–12.
https://doi.org/10.1016/j.jag.2014.1 0.015.
Ramono, W.S. Wawandono, N.B., Subijanto, J. 2000. Rencana Pengelolaan 25 Tahun Taman Nasional Komodo Buku 2 Data dan Analisis. Jakarta: The Nature
Conservancy.
Salis, M., Bachisio, A., Fermin, A., Margarita, A., Valentina, B., Pierpaolo, D., Beatriz, D., Nikos, K., Giorgos, M., Ioannis, M., José, M., José, P., Itziar, U., Fotios, X., Gonzalo, Z., Donatella, S. 2016 Predicting Wildfire Spread and Behavior in Mediterranean
Landscapes. International Journal of Wildland Fire. 25(10):1015-
1032.
https://doi.org/10.1071/WF15081.
Simeoni, A., Owens, Z.C., Christiansen, E.W., Kemal, A., Gallagher, M., Clark, K.L., Skowronski, N., Mueller, E.V., Thomas, J.C., Santamaria, S., Hadden, R.M. 2017. A Preliminary Study of Wildland Fire Pattern Indicator Reliability Following an Experimental Fire. Journal of Fire Sciences, 35(5):359–378. https://doi.org/
10.1177/0734904117720674.
Simpson, C., Sharples, J., Evans, J. 2015. WRF-Fire Simulation of Lateral Fire Spread in the Bendora Fire on 18 January 2003. In: Weber, T., McPhee, M.J. and Anderssen, R.S., editors. MODSIM2015, 21st
International Congress on
Modelling and Simulation.
Modelling and Simulation Society of Australia and New Zealand. December 2015.
Simpson, C. C., J. J., Sharples, Evans, J.P. 2016. Sensitivity of Atypical Lateral Fire Spread to Wind and Slope. Geophysics Research Letters, 43:1744–1751.
https://doi.org/10.1002/2015GL067 343.
Stavrakoudis, D., Katagis, T., Minakou, H., Gitas, I. 2020. Automated Burned Scar Mapping Using Sentinel-2 Imagery. Journal of Geographic Information System, 12:221-240.
https://doi.org/10.4236/jgis.2020.12 3014.
Storey, M. A. 2021a. “Empirical Analysis of Wildfire Spread and Spotting in Southern Australia” (thesis). Wollongong: University of
Wollongong.
Storey, M. A., Price, O. F., Almeida, M., Ribeiro, C., Bradstock, R. A., Sharples, J. J. 2021b. Experiments on The Influence of Spot Fire and Topography Interaction on Fire Rate of Spread. PLloS One, 16(1). https://doi.org/10.1371/journal.pone .0245132.
The National Wildfire Coordinating Group. April 2016. Guide to wildland fire origin and cause determination. PMS 412, NFES 1874.
Tran, B., Tanase, M., Bennett, L., Aponte, C. 2018. Evaluation of Spectral Indices for Assessing Fire Severity in Australian Temperate Forests. Remote Sensing, 10(11): 6810.
https://doi.org/10.3390/rs10111680.
Vlassova, L., Pérez-Cabello, F., Mimbrero, M., Llovería, R., García-Martín, A. 2014. Analysis of The Relationship Between Land Surface Temperature and Wildfire Severity in A Series of Landsat Images. Remote Sensing, 6(7):6136–6162.
https://doi.org/10.3390/rs6076136.
Wheeler, D.K. 2003, The Use of Remote Sensing Imagery for Evaluation of Post-Wildfire Susceptibility to Landslide and Erosion Hazards in the Salmon-Challis National Forest, Lemhi County, Idaho. (thesis).
Pocatello: Idaho State University.
Yu, X., Guo, X., Wu, Z. 2014. Land Surface Temperature Retrieval from
Landsat 8 TIRS—Comparison Between Radiative Transfer Equation-Based Method, Split Window Algorithm and Single Channel Method. Remote Sensing, 6:9829–9852.
https://doi.org/10.3390/rs6109829.
Zheng, Z., Zeng, Y., Li, S., Huang, W. 2016. A New Burn Severity Indice Based on Land Surface Temperature and Enhanced
Vegetation Indice. International Journal of Applied Earth Observation and Geoinformation, 45:84–94.
https://doi.org/10.1016/j.jag.2015.1 1.002.
136
ECOTROPHIC • 17(1): 119-136 p-ISSN:1907-5626,e-ISSN: 2503-3395
Discussion and feedback