RELATIONSHIP BETWEEN CHLOROPHYLL-A AND SEA SURFACE TEMPERATUR WITH Sardinella lemuru CATCHING IN BALI STRAIT
on
Relationship Between Chlorophyll-a and Sea…
[Niken Gustantia, dkk]
RELATIONSHIP BETWEEN CHLOROPHYLL-A AND SEA SURFACE TEMPERATURE WITH Sardinella lemuru CATCHING IN BALI STRAIT
Niken Gustantia1), Takahiro Osawa2,3), I Gusti Bagus Sila Dharma4), I Wayan Sandi Adnyana5)
-
1)Masters Program in Environmental Science, Udayana University
-
2)Center for Remote Sensing and Ocean Sciences (CReSOS) Udayana University 3)Center for Research and Application of Satellite Remote Sensing (YUCARS) Yamaguchi University, Japan
-
4)Marine and Fisheries Science Faculty of Udayana University 5)Faculty of Agriculture, Udayana University
Email: gustantia48@gmail.com
ABSTRACT
The Bali Strait is one of Indonesia's territorial waters that have high natural resource potential. The area is only about 2,500 km2 but has a high potential fishing ground. The Bali Strait has unique and dynamic waters that can cause fluctuations in fish production amount each year. The largest type of fish caught in the Bali Strait is lemuru (Sardinella lemuru), a fish found only in the Bali Strait. This fish plays a significant role in the economy of fishers in the Bali Strait. Each year the catch of lemuru has fluctuated, making fishing locations challenging to predict. Sea Surface Temperature (SST) and Chlorophyll-a (Chl-a) are oceanographic parameters that can affect the resources of the ocean. Oceanographic phenomena, such as upwelling, can also influence the condition of fish resources. Therefore, understanding the relationships between these factors is essential in practical fisheries management. Observation of oceanographic factors is very hard with the field observation due to time and cost limitations. The remote sensing technique is an efficient method to determine SST distributions and Chl-a concentrations using satellite imagery. This study analyzes SST and Chl-a concentration in the Bali Strait using the Global Change Observation Mission(GCOM-C) satellite and determines the correlation between Chl-a and SST with a total fish catch(lemuru) during 2019. The results showed the maximum average Chl-a concentration observed on August 1.62 mg/m3 and the lowest concentration observed on January 0.45 mg/m3, the maximum SST on March was 28.12° C, and on August (Dry season) with 22.40° C. The SST variable's influence provides a negative correlation (R = -0.209) with changes in lemuru catch, while the Chl-a parameter has a positive correlation (R = 0.375) with changes in the catch. The pattern of relationship between Chl-a with fish catching had a good relationship than the SST in 2019.
Keywords: Bali Strait; Sardinella lemuru; SST; Chl-a.
-
1. INTRODUCTION
Bali Strait is a water area located south of the equator between Java and Bali's islands. The Bali Strait is one of Indonesia's territorial waters with high potential natural resources, so it is used for fishing activities. According to Wijaya and Bayu (2019), the largest type of fish caught in the Bali Strait is lemuru (Sardinella lemuru).
Lemuru is a filter feeder fish that has the family name Clupeidae. Lemuru feed, in general, is phytoplankton and zooplankton (Carpenter and Niem, 1999). What makes this fish unique is its existence, which only exists in the Bali Strait (Ritterbush, 1975 in Merta, 1992). Therefore, lemuru plays an essential role in the economy of fishers in the Bali Strait. Lemuru is also a critical fishery commodity in these waters. However, every year the number of lemuru catches always fluctuates; this makes lemuru catching locations challenging to predict.
Susilo (2015) stated that the Bali Strait has unique and dynamic waters, where this condition causes fluctuations in the amount of fish production each year, and the peak of Lemuru production at Muncar port occurred in 2006 2007, which decreased the following year, oceanographic factors influenced this. Siwi et al. (2015) stated that oceanographic phenomena that affect the characteristics of the waters also affect the condition of the resources in it.
Hendriarti et al. (2005) stated that the rainy season significantly affects changes in surface currents, which cause upwelling in the Indian Ocean and indirectly also occurs in the Bali Strait. Besides, Wijaya and Bayu (2019) also stated that the relatively narrow geographical condition of the Bali Strait is one of the effects of changes in oceanographic conditions in the Bali Strait, both physically, chemically, and biologically. Sea surface temperature
(SST) and chlorophyll-a (Chl-a) concentration are the most influential oceanographic factors in analyzing lemuru distribution (Susilo, 2015).
Seasonal conditions positively influence SST in Indonesia. Seasonal differences are related to the concentration of sunlight, which affects sea temperatures. This temperature difference can affect the distribution of fish. Chl-a concentration also affects fish distribution because Chl-a represents phytoplankton, which is the leading food of pelagic fish, one of which is lemuru. Susilo (2015) stated that the interaction pattern between SST and Chl-a could indicate an increase in water mass from the bottom to the surface, which causes the nutrients below to rise to the water surface (upwelling).
The upwelling phenomenon increases the mass of water from the bottom or column of water to the surface because it is influenced by the wind and the Ekman divergence process (Silubun, 2015). Upwelling areas are potential areas for fishery activities because they are rich in food sources to survive larvae, juveniles, and adult fish (Hendiarti et al., 2004; Hendiarti et al., 2005). Therefore, understanding these factors' relationship is very important for effective fisheries management (Syah et al., 2016). Observation of oceanographic factors is complicated and challenging if the in-situ observation is due to time resolution and cost limitations.
This remote sensing technique is an efficient method in determining the Oceanographic parameter distribution such as SST and Chl-a (Tangke et al., 2015). Various studies have been conducted that show remote sensing data to understand the physical and biological processes that manage fisheries potential. Moderate Resolution Imaging Spectroradiometer (MODIS) has succeeded in providing global marine coverage of SST and Chl-a with a spatial and temporal resolution to
determine lemuru fishing areas in the waters of the Bali Strait (Mawarni, 2014). However, MODIS has a low-middle range spatial resolution(1.1km), making it less suitable for observing the Bali Strait's narrow waters. However, In 2017 the new Satellite, Global Change Observation Mission (GCOM-C 250m resolution), was launched to monitoring oceanic parameters and others by Japan Aerospace Exploration Agency (JAXA). This study was employed four times a high-resolution satellite than MODIS. The purpose of this study was to analysis SST and Chl-a concentration in the Bali Strait using GCOM-C Satellite and to determine how is the correlation with a total fish catch.
-
2. METHODOLOGY
-
2.1. Research Location
-
The research location is in the Bali Strait, which is located at 114.41°BT – 8.177°LS. The Bali Strait in the West has bounded the mainland of Java, while Bali's island in the east limits it. The Bali Strait is the water that connects the Flores Sea and the Madura Strait in the north and the Indian Ocean in the south. Based on the topography, the Bali Strait waters tend to be influenced by the mass of water from the Indian Ocean compared to the Flores Sea or Java Sea (Burhanuddin and Praseno, 1982).
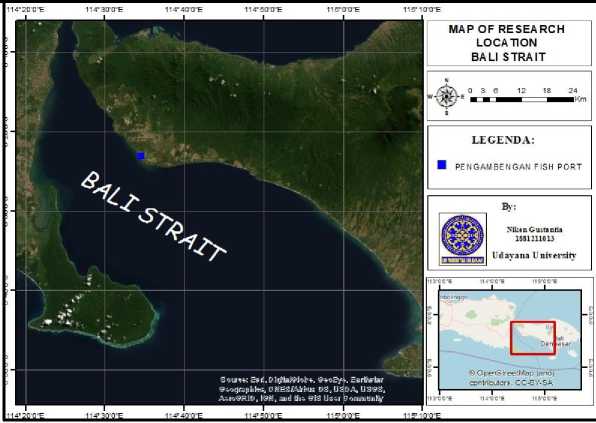
Figure 1.
Reseach Location
The data were collected from remote sensing data and fish data by (Marine and Fisheries Ministry) KKP, Indonesia government data. This study's data sets are environmental parameter data such as Chl-a and SST and the catch of lemuru. The data were processed and analyzed using SNAP, QGIS 3.14.16, and ArcGIS 10.6. The following is a description of each piece of
data that be used. Daily fishing data (Sardinella lemuru) were obtained from the Marine and Fisheries Ministry in 2019. The data set (SST and Chl-a) was estimated from the GCOM-C with the product type level 2. The temporal resolution is the daily duration.
-
a) Chlorophyll-a and SST data
Process remote sensing data for level 2 from GCOM-C data collection, data cropping, data extraction, and visualization. The first step SNAP(The
Sentinel Application Platform), opened as digital numbers and then converted into Chl-a values and SST using the slope coefficient and the correlation. After the cropping process, the output data was extracted and stored with an estimate of longitude, latitude, and parameter values. This data performs data control; controlling the data means determining only points in the Bali Strait area and eliminating the cloud value for the GCOM-C dataset. The controlled data was visualized as timeseries graph data by Excel software. The monthly time series data show the fluctuation patterns of CHL-a and SST data in the Bali Strait in 2019.
-
b) Correlation Chl-a, SST and Fish Catch Data
Fish catch data show the fluctuation patterns with Chl-a concentration and SST data in the Bali Strait from January to December 2019. The data are categorized into four seasons patterns as December-January-February (DJF), March-April-May (MAM), June-July-August (JJA), and September-October-November (SON).
-
a) Correlation analysis between Chl-a, SST, and fish catch data.
Linear correlation is employed to understand the relationship between oceanographic data with fisheries data (lemuru fish landing data). The equation is as following (1):
Corτ (X , V) =
Where:
∑(x-x)(y-y)
√∑(χ-x)∑(y-y)2
(1)
Corr = Corellation coefficient
Xi = Remote sensing data (SST, Chl-a)
Y = Fisheries data (lemuru fish catching)
-
3. RESULT AND DISSCUSION
-
3.1. Condition SST and Chlorophyll-a concentration in the Bali Strait water using GCOM-C Satellite
-
3.1.1. Clorophyll-a Concentration (Chl-
-
-
-
a) in Bali Strait
The chlorophyll-a concentration in the Bali Strait is shown in Figure 2. These daily data were composited into monthly data.
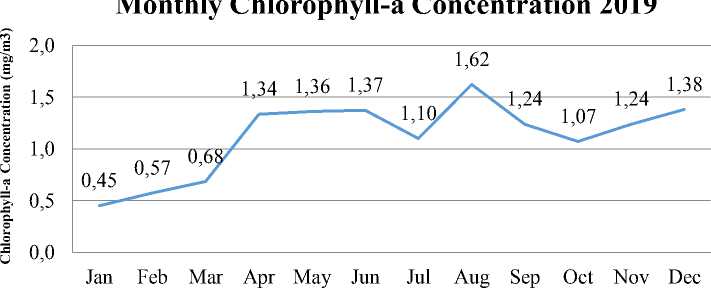
Figure 2.
Monthly Chlorophyll-a Concentration 2019
Figure 2. shows the highest Chl-a and the lowest concentration is in January concentration in August (1,622 mg/m3), (0,451 mg/m3).
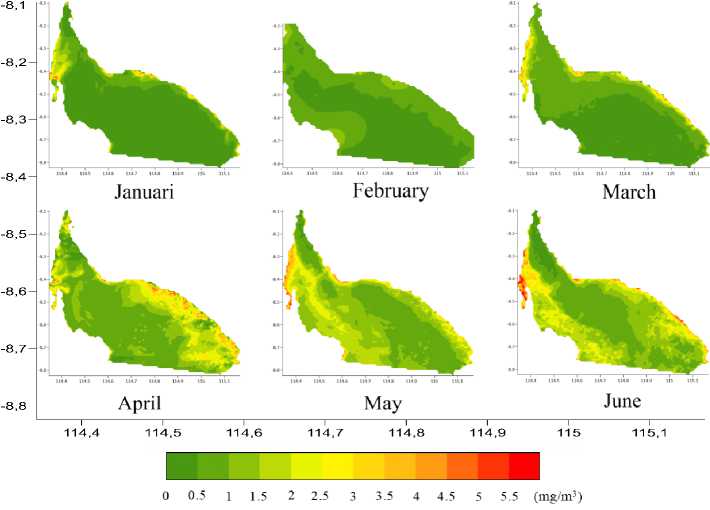
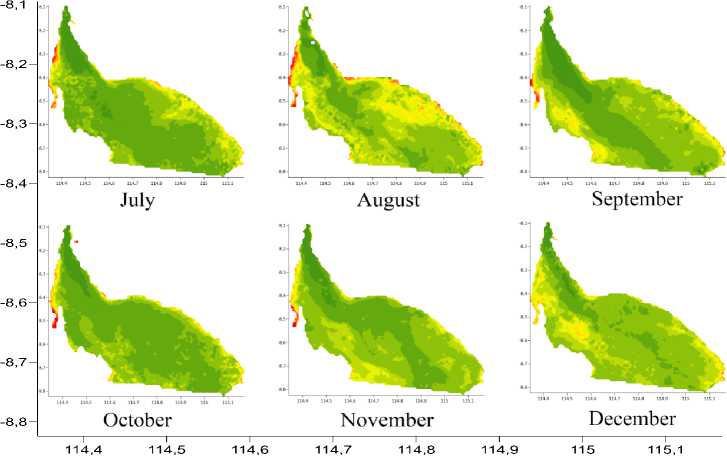
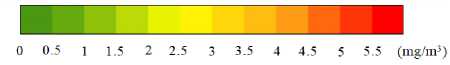
Figure 3.
Monthly Chl-a concentration in the Bali Strait in 2019
The maximum average Chl-a (Dry season) 1.62 mg/m3, and the lowest
concentration was observed in August concentration in January (Wet season)
0.45 mg/m3. Wyrtki (1961) explained that the east monsoon (June-July-August) winds blowing harder along with Java and Bali's southern coast. The Coriolis force's effect on water transportation causes the surface layer to be deflected to the middle of the sea so that the water void was filled with water masses from the bottom layer (Upwelling). The area where upwelling occurs generally has higher nutrients than the surrounding area, as in the research of Rintaka et al. (2014), which stated that in June-September, the Bali Strait waters get
a strong upwelling effect from the Indian Ocean.
-
3.1.2. Sea Surface Temperature (SST) in
Bali Strait
Sea Surface Temperature in the Bali Strait is presented in Figure 4. The daily data were converted into monthly – from January 2019 to December 2019.
Figure 4. shows that the highest temperature was observed in March (28,12° C), and the lowest temperature in August (22,40° C) in Bali Strait, 2019.
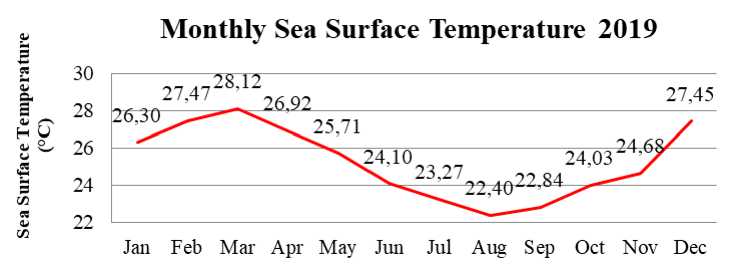
Figure 4.
Sea Surface Temperature in Bali Strait 2019
The distribution of SST in the Bali Strait is influenced by seasonal patterns caused by monsoons' movement. In the east monsoon, the wind blows more vital from the southeast to the northwest, and in the west monsoons, the wind blows from the west at a slower speed (Wyrtki, 1961). Figure 3 shows that the average SST began to be high in January, reaching a maximum temperature in March with a value of 28.12° C. The following month, It began to decline until it reached the minimum temperature in August with a value of 22.40° C. Ridha et al. (2013)
stated that SST reaches a minimum temperature in the east monsoon period and reaches a maximum temperature in the west monsoon. Soebekti et al. (2014) also showed Aqua MODIS images found the Bali Strait waters experienced a monthly temperature decrease in the eastern monsoon, and the decline started in June, July, August to September.
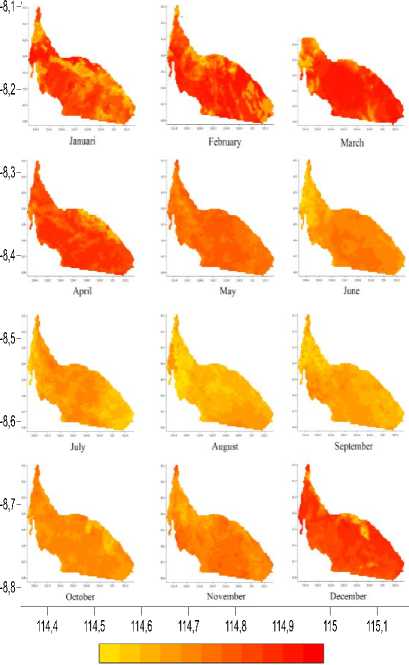
20 21 22 23 24 25 26 27 28 29 30 (0C)
Figure 5.
Monthly Sea Surface Temperature in the Bali Strait in 2019
Figure 6 shows the total fluctuation of lemuru fish-catching from Pengambengan Port from January to
December 2019. The port's highest catch was observed from November to October at 2859,967 Tons, while the lowest catch was observed in January, namely 101.59 tons.
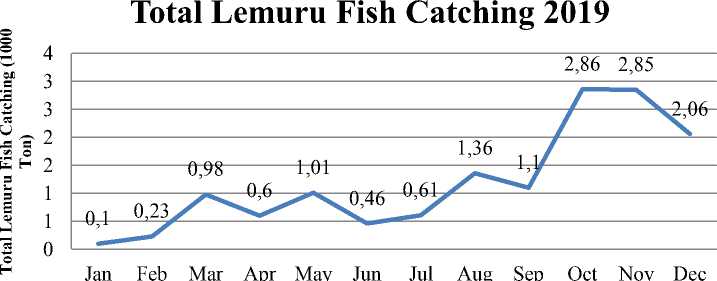
Figure 6.
Total Lemuru Fish Catching in Bali Strait 2019
-
3.2. Fluctuation SST and Chl-a concentration influence lemuru
fish catching
The variability
of monthly
oceanographic conditions (SST and Chl-a) = 0.375). with total monthly fishing is shown in
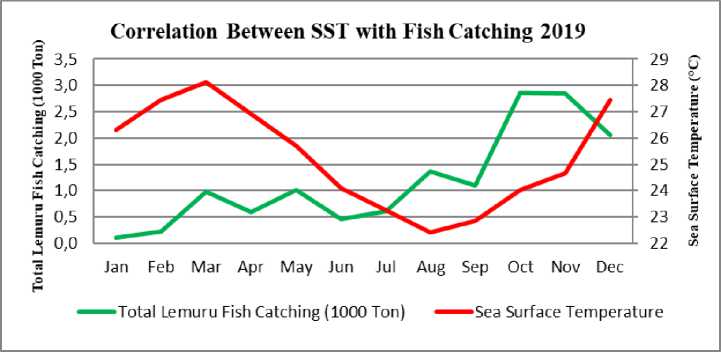
Figure 7.
Variability of SST with Total Lemuru Fish Production
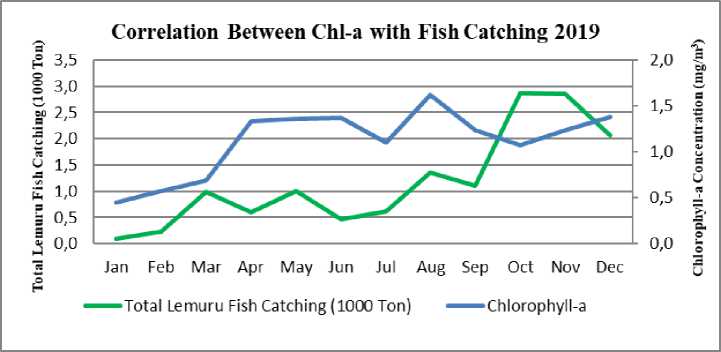
Figure 8.
Variability of Chl-a with Total Lemuru Fish Production
Lemuru species in the Bali Strait are among essential pelagic fish economically in Indonesia (Pradini et al., 2011). Sardinella lemuru was a pelagic fish whose primary food source is plankton, so Chl-a concentration changes were among the causes of changes in the amount of catch. Fishery statistical data was obtained from PPN Pengambengan, which was data from January to December 2019. The pattern of the relationship between SST
Figures 7 and 8. A negative relationship between SST and total lemuru catching
(R= -0,209) and Chl-a has a positive correlation with total lemuru catching (R
and Chl-a oceanographic parameters and total lemuru fish-catching shows that there was an inverse relationship between SST and Chl-a parameters in influencing changes in lemuru catch. These results provide information that the effect of the SST variable provides information inversely (R = -0,209) with changes in lemuru catch, while the Chl-a parameter has a direct effect (R = 0.375) with changes in a catch (Figure 7 and 8).
According to Sartimbul et al. (2010), changes in the concentration of Chl-a an essential factor affecting changes in lemuru production and closely related to the phenomenon of ENSO and IOD. However, increasing the concentration of Chl-a does not necessarily increase the catch's production, but it takes time because of the energy transfer process through the food chain. Meanwhile, Nurdin et al. (2015) stated that SST and Chl-a parameters significantly affected
fish catch changes in the Makassar Strait, but Chl-a parameters had a more substantial effect than SST changes.
The time lag analysis between lemuru fish catching with Chl-a and SST is shown in Figures 9, 10, and Table 1. The time lag is set as six-months before and six-months after. The linear correlation value between fish catching with Chl-a was positive (R=0,451), and fish catching with SST was positive (R=0,574).
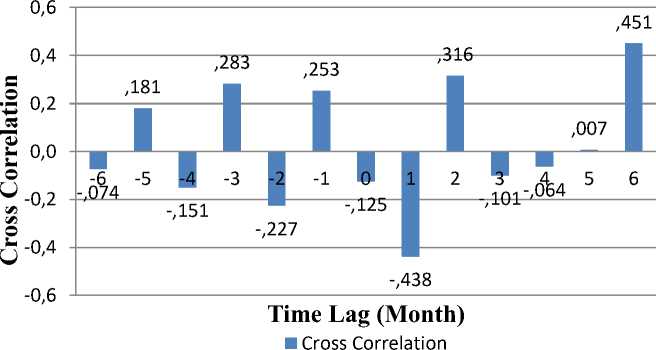
Figure 9.
Time Lag Between Fish Catching with Chl-a
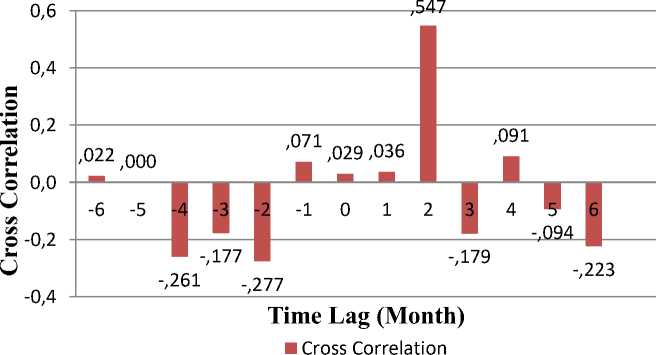
Figure 10.
Time Lag between Fish Catching with Sea Surface Temperature
Table 1. Coefficient correlations with the time lag between lemuru fish catching with
SST and Chl-a in 2019
|
Time Lag |
Chl-a |
SST |
|
-6 |
-0.074 |
0.022 |
|
-5 |
0.180 |
0.000 |
|
-4 |
-0.151 |
-0.261 |
|
-3 |
0.283 |
-0.177 |
|
-2 |
-0.227 |
-0.277 |
|
-1 |
0.253 |
0.071 |
|
0 |
-0.125 |
0.029 |
|
1 |
-0.438 |
0.036 |
|
2 |
0.316 |
0.547 |
|
3 |
-0.101 |
-0.179 |
|
4 |
-0.064 |
0.91 |
|
5 |
0.007 |
-0.094 |
|
6 |
0.451 |
-0.223 |
In the time lag analysis (Figure 9 and 10), the correlation between the Chl-a concentration and the lemuru catch was positive and significant in 6 months. Therefore, phytoplankton might be affected lemuru within 6 months. Palupi (2018) showed that the correlation between Chl-a concentration and lemuru production would be significant in 2 to 6 months. Figure 9 and 10 shows the crosscorrelation between SST and lemuru; SST might take 2 months to affect lemuru production. However, SST was still within the tolerable range of fish and generally does not significantly affect fish presence. According to Siregar and Hariyadi (2011), the lemuru fishing area in the Bali Strait in each season was generally in the temperature range of 25° C - 29.5° C.
Susilo's research (2015) that around 70% of lemuru fishing activities in the Bali Strait occurred in temperature 25.5 - 26.5° C. SST range was narrow because it represents the point at the fishing location that occurred in the study. Gaol et al. (2004) showed that cross-correlation between Chl-a concentration and lemuru production showed a significant positive relationship with a lag time of 4 months
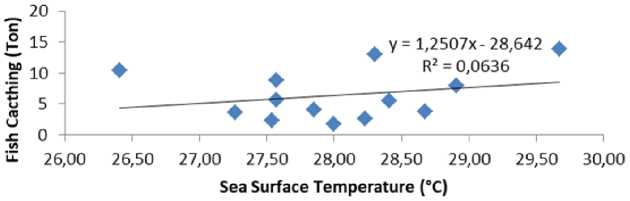
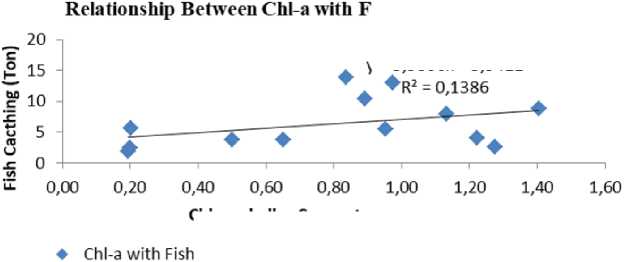
Figures 11 to 14 show the correlation between SST and Chl-a with the one coordinate's fishing average.
Relationship Between SST with Fish Catching DJF 2019
♦ SSTwithFishCacthing ----Linear(SSTwithFishCacthing)
√ = 3,5S06x+3,5412
Catching DJF 2019
Chloropħyll-a Concentration (mg∕m3)
Cacthing ----Linear (Chl-a with Fish Cacthing)
Figure 11.
Correlation Between SST and Chl-a with Fish Catching on DJF
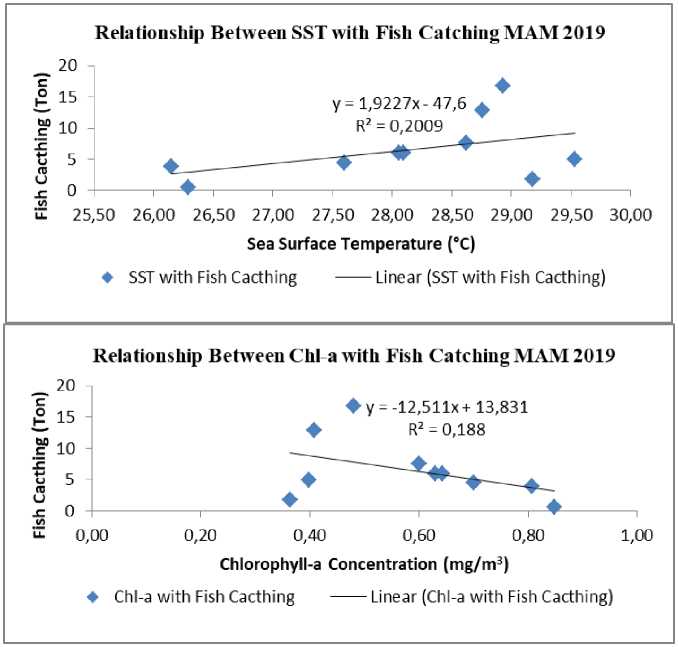
Figure 12.
Relationship Between SST and Chl-a with Fish Catching on MAM
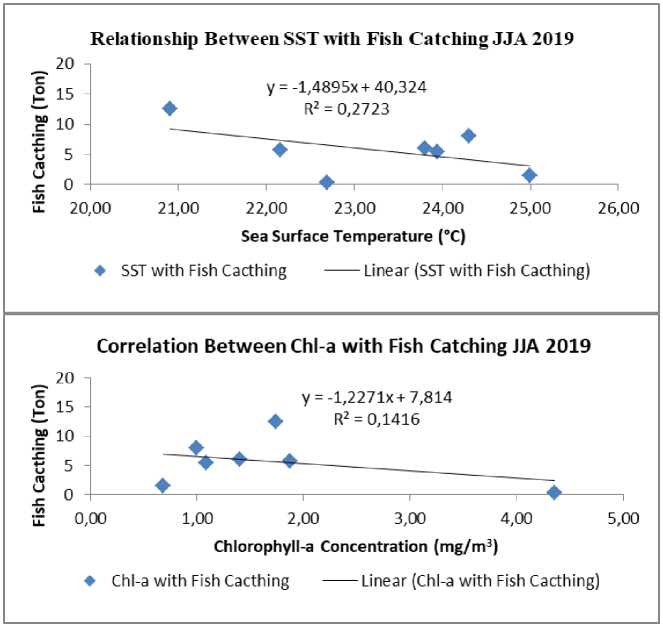
Figure 13.
Relationship Between SST and Chl-a with Fish Catching on JJA
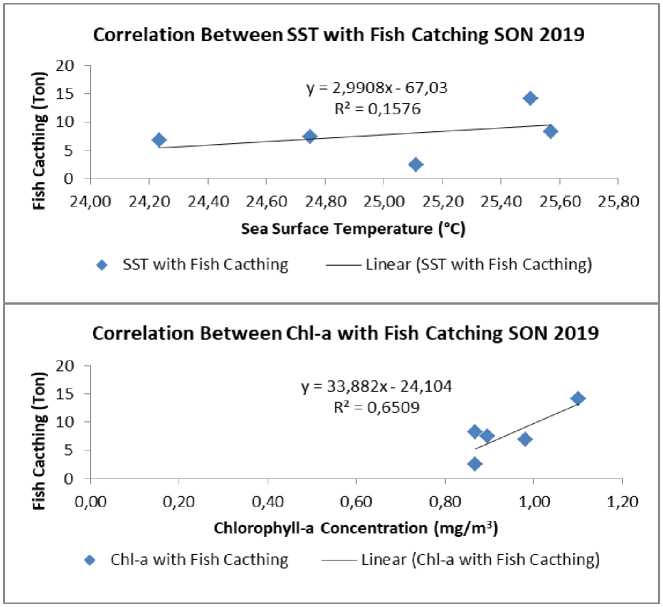
Figure 14.
Correlation Between SST and Chl-a with Fish Catching on SON
The value of R2 shows that the relationship between the average catch of lemuru with Chl-a and SST has a significant relationship. Figures 11 to 14 shows the relationship between the concentration of Chl-a and the average catch of lemuru in SON and DJF months has a positive relationship pattern (SON = 0.6509 and DJF = 0.1386), if the concentration of Chl-a increases, the average result lemuru catch also increase. Meanwhile, during the month of MAM and JJA Chl-a, it has a negative relationship (MAM = 0.188 and JJA = 0.1416). Meanwhile, the correlation between SST and the average catch of lemuru in SON, DJF and MAM has a positive relationship pattern (SON = 0.1576; DJF = 0.0636; MAM = 0.2009). Meanwhile, in the month of JJA, SST has a negative relationship (JJA = 0. 2723). The R2 value close to number 1 was the relationship between Chl-a and the average catch of lemuru in SON. Several previous studies stated that the relationship between lemuru catch and SST showed no direct relationship between SST values and CPUE values of lemuru fish in Java Sea Waters, Putra et al., (2012). Furthermore, Ridha (2013) stated that the catch of lemuru in the eastern season has a higher coefficient than the western season. Indrawati (2002) found that lemuru fish prefer waters with lower temperatures, between 23° - 26° C, where relatively low temperatures are in the east monsoon.
The maximum average Chl-a concentration occurs in August (Dry season) 1.62 mg/m3, and the lowest concentration occurs in January (Wet season) 0.45 mg/m3. Furthermore, the average SST began to be high in January,
reaching a maximum temperature in March (Wet season) with a value of 28.12° C; It began to decline the minimum temperature in August (Dry season) a value of 22.40° C.
The pattern of relationship between SST, Chl-a oceanographic parameters, and total lemuru fish-catching showed that an inverse relationship between SST and Chl-a parameters in influencing changes in lemuru catches. These results provide information that the SST variable's influence provides information inversely (R = -0,209) with lemuru catch changes, while the Chl-a parameter has a direct effect (R = 0.375) with changes in the catch. The relationship patterns between the concentration of Chl-a and the average catch of lemuru in SON (September-October-November) and DJF (December-January-February) months has a positive relationship pattern (SON = 0.6509 and DJF = 0.1386); meanwhile, during the month of MAM (March-April-May) and JJA (June-July-August) Chl-a, it has a negative relationship (MAM = 0.188 and JJA = 0.1416). Meanwhile, the correlation between SST and the average catch of lemuru in SON, DJF and MAM has a positive relationship pattern (SON = 0.1576; DJF = 0.0636; MAM = 0.2009).
Data with a longer duration will make this study more accurate with the correlation. Moreover, oceanographic parameters that affect lemuru fish in the Bali Strait are necessary to increase accuracy.
REFERENCES
Burhanuddin dan D.P. Praseno. 1982. Lingkungan Perairan Selat Bali. Pros. Sem. Perik. Lemuru. Banyuwangi 18-21 Jan. 1982. Buku II. Puslitbangkan, Jakarta. Hal 27-32
Carpenter K.E., and Niem, V.H. 1999. FAO Species Identification Guide for Fishery Purposes. The Living Marine Resources of The Western Central Pacific. Volume 3. Batoid Fishes, Chimaeras, and Bony Fishes Part.1 (Elopidae to Linophrynidae). Roma: FAO.
Gaol JL, Wudianto, Pasaribu BP, Manurung D, Arhatin RE. 2004. The fluctuation of chlorophyll-a concentration derived from satellite imagery and catch of oily sardine (Sardinella lemuru) in Bali Strait. International Journal of Remote Sensing and Earth Sciences. Vol I: 24-30
Hendiarti, N., Suwarso, Edvin A, Khairul A, Retno A, Suhendar I. S, And Ikhsan B W. 2005. Seasonal Variation of Pelagic Fish Catches Around Java. Oceanography. Vol. 18 (4): 113 – 123.
Indrawati, A.T. 2000. “Studi tentang hubungan Suhu Permukaan Laut Hasil Pengukuran Satelit Terhadap Hasil Tangkapan Lemuru
(Sardinella lemuru Bleeker 1853) di Selat Bali”. (Thesis). Tidak Dipublikasikan. IPB. Bogor
Mawarni, N. M. C. 2014. "Study of Lemuru Fish Production in the Bali Strait Using Aqua MODIS Satellite Data." (Thesis). Udayana University. Bali
Merta, I. G. S. 1992. “Dinamika Populasi Ikan Lemuru Sardinella lemuru bleeker 1853 (Pisces : Clupeidae) di Perairan Selat Bali dan Alternatif Pengelolaannya”. (Disertation). Program Pascasarjana. Institut Pertanian Bogor. Bogor.
Nurdin, S., Mustapha, A.M., Lihan, T., Ghaffar, A.A., 2015. Determination of potential fishing grounds of Rastrelliger kanagurta using satellite remote sensing and GIS technique.
Sains Malaysiana. Vol. 44 (2): 225– 232.
Palupi, H. K. 2018. “Hubungan Antara Produksi Lemuru (Sardinella
Lemuru) Dengan Konsentrasi Klorofil-A Dan Spl Di Selat Bali Periode 2013-2017”. (skripsi).
Bogor. Institut Pertanian Bogor
Pradini, S., Rahardjo, M.E., dan Kaswadji, R. 2011. Kebiasaan makanan ikan lemuru (Sardinella lemuru) di perairan Muncar, Banyuwangi. Jurnal Iktiologi Indonesia. Vol. 1 (1):41-45.
Putra, E., Gaol,J.L., dan Siregar,V.P. 2012. Hubungan konsentrasi klorofil-a dan suhu permukaan laut dengan hasil tangkapan ikan pelagis utama di perairan Laut Jawa dari citra satelit MODIS. Jurnal Teknologi
Perikanan dan Kelautan. Vol. 3 (1):1-10.
Ridha, U., Muskananfola, dan M.R., Hartoko, A. 2013. Analisa Sebaran Tangkapan Ikan Lemuru (Sardinella lemuru) berdasarkan Data Satelit Suhu Permukaan Laut dan Klorofil-a di Perairan Selat Bali. Diponegoro Journal Of Maquares, Management of Aquatic Resources. Vol. 2 (4) : 53-60.
Rintaka W E, Setiawan A, Susilo E and Trenggono M. 2014. Variasi
Sebaran Suhu, Salinitas Dan
Klorofil Terhadap Jumlah
Tangkapan Lemuru Di Perairan Selat Bali Saat Muson Tenggara. Pertemuan Ilmiah Nasional Tahunan X ISOI 2013 Jakarta, 1112 November 2014.
Sartimbul, 2010. Dalam Rintaka. E.W, Setiawan. A, Susilo. E, dan Trenggono. M, 2013. Variasi Sebaran Suhu, Salinitas Dan Klorofil Terhadap Jumlah
Tangkapan Lemuru Di Perairan Selat Bali Saat Muson Tenggara, Pertemuan Ilmiah Nasional
Tahunan X ISOI 2013, Balai Penelitian dan Observasi Laut, Kementerian Kelautan dan
Perikanan, Jembrana Bali
Silubun T. D, Lumban Gaol. J, dan Naulita Y. 2015. Estimasi Intensitas Upwelling Pantai dari Satelit Aqua Modis di Perairan Selatan Jawa dan Barat Sumatera. Journal Teknol Perik Kel. 6: 21-29.
Siregar, V., dan Hariyadi. 2011. Identifikasi parameter oseanografi utama untuk penentuan daerah penangkapan ikan lemuru dengan menggunakan citra satelit MODIS di Perairan Selat Bali. Jurnal Akuatik. Vol. 1 (1): 32 – 38
Siwi, W.E.R., Bayu P, dan Teguh A. 2015. Observasi Karakteristik Perairan Selat Bali Melalui Pendekatan Insitu Dan Numerik. Balai Penelitian dan Observasi Laut Badan Penelitian dan
Pengembangan Kelautan dan Perikanan Jalan Baru Perancak, Negara, Jembrana, Bali.
Soebekti, A., Agus A., dan Alfi S. 2014. Pemetaan Sebran Suhu Permukaan Laut Dan Klorofil-A Untuk Menentukan Fishing Ground Potensial Menggunakan Data Citra Satelit Aqua Modis Pada Musim Timur Di Selat Bali. Jurnal Oseanografi. Vol. 3 (2): 200 – 209
Susilo, E. 2015.Variabilitas Faktor Lingkungan Pada Habitat Ikan lemuru Di Selat Bali Menggunakan Data Satelit Oseanografi Dan Pengukuran Insitu. Omni-Akuatika Vol. XIV (20): 13 -22 alai Penelitian dan Observasi Laut, KKP. Bali.
Syah, A.F., Saitoh, S-I., Alabia, I.D. and Hirawake, T. 2016. Predicting potential fishing zones for Pacific saury (Cololabis Saira) with
maximum entropy models and remotely sensed data. Fishery Bulletin. Vol. 114 (3): 330-342.
Tangke, U, John Ch K, Mukti Z, and Achmar M. 2015. Sebaran Suhu Permukaan Laut Dan Klorofil-A Pengaruhnya Terhadap Hasil Tangkapan Yellowfin Tuna
( Thunnus Albacares ) Di Perairan Laut Halmahera Bagian Selatan. Jurnal IPTEKS PSP. Vol. 2 (3): 248-260.
Wijaya, A. and Bayu P. 2019. Pola Hubungan Kondisi Perairan dan Produksi Ikan Lemuru di Selat Bali Menggunakan Citra Satelit. Seminar Nasional. Fakultas Perikanan: Universitas Negeri Muhammadiyah Kupang
Wyrtki, K. 1961. The Physical Oceanography Of South East Asian Waters. Naga Report Vol. 2. University California Press., La Jolla, California.
26
Discussion and feedback