SHORELINE SENSITIVITY INDEX TO OIL SPILLS IN NUSA PENIDA MARINE PROTECTED AREA (MPA), BALI
on
Shoreline Sensitivity Index to Oil Spills…
[IPG Eka Handrayana Putra, dkk]
SHORELINE SENSITIVITY INDEX TO OIL SPILLS IN NUSA
PENIDA MARINE PROTECTED AREA (MPA), BALI
IPG Eka Handrayana Putra1*), Takahiro Osawa2,3), I Wayan Gede Astawa Karang4)
-
1)Master Program of Environmental Science, Udayana University
-
2)Centre for Remote Sensing and Ocean Science (CReSOS), Udayana University
-
3)Centre for Research and Application of Satellite Remote Sensing (YUCARS) Yamaguchi University, Japan
-
4)Faculty of Marine Science and Fisheries, Udayana University
*Email: eka.handrayana27@gmail.com
ABSTRACT
The Shoreline Sensitivity Index(SSI) is one crucial aspect to know in protecting the coast from all threats, including oil spills. This study aims to determine the shoreline's sensitivity for oil spills based on several oceanographic parameters: shoreline type, tidal range, slope, and wave high in Nusa Penida, Map Protection Area (MPA). The weight overlay method was employed to apply the geographic information system (GIS). Each parameter component was scored as five categories before the weighted overlay. The shoreline sensitivity level of Nusa Penida island is divided into five categories: very low sensitive, low sensitive, medium sensitive, high sensitive, and very high sensitive. As the results, the SSI was categorized during the east monsoons (from June to August) and during the west monsoons (from December to February) is at a low sensitivity level to very high sensitivity. SSI during east monsoons there is about 60.05% (627.33 ha) in the medium, 9.39% (98.11 ha) in the high, and 2.39% (24.99 ha) in the very high sensitive. The SSI during the west season is about 78.16% (816.95 ha) with the medium, 19.43% (203.11 ha) with the high, and 2.39% (24.99 ha) with the very high sensitive. The difference in wave height during east and west monsoons greatly affects the sensitivity level of the Nusa Penida coastal area. However, sensitivity level in Jungutbatu and Lembongan Villages are not affected by the east or west monsoons.
Keywords: Shoreline Sensitivity; GIS; Nusa Penida; Oil Spill.
Nusa Penida Sub-district is located in Klungkung Regency, Bali Province. The only archipelago district in Bali Province has three main islands: Nusa Penida, Nusa Lembongan, and Nusa Ceningan. These three islands are included in the Nusa Penida Marine Protected Area (MPA) because these land and water areas have very high resources. According to Tania et al. (2011), Nusa Penida has high resources because it is included in the world's coral
triangle so that it has fertile ecological conditions.
Darma et al. (2010); Pemkab Klungkung (2012); Dermawan et al. (2014) stated that Nusa Penida MPA has a complex resources. Turak and Lyndon (2011) stated that Nusa Penida waters have high biodiversity, there is approximately 149 Ha of coral reefs with 296 species of coral. Sanjaya (2009), noted that Nusa Penida has 149 Ha of coral reef, 230 Ha of mangrove forest, and 108 Ha of seagrass. Dermawan et al. (2014) add that this island also has 576 species of fish.
Nusa Penida borders directly with the Badung Strait in the North and West, the Indian Ocean in the South, and Lombok Strait in the East (BPS, 2020; Widyarsana and Agustina, 2020). Ship traffic activity in these bays is very high, both locally, regionally, and internationally. The high activity of ships in the Badung Strait and the Lombok Strait can cause Nusa Penida MPA exposed to the threat of oil spills. Dewanto and Faturachman (2018) stated that there are frequent ship accidents in Indonesian waters. At least 349 ship accidents were recorded from 2003-2013. About 80-85% of accidents that occur are caused by human error. Therefore, it is necessary to prepare to anticipate greater losses in the event of an oil spill.
Mapping shoreline sensitivity to oil pollution is an essential step in the preparedness, response, and collaborative efforts to overcome oil pollution. IPIECA/IMO/OGP (2012) and UNEP-WCMC (2019) states that maps are tools that responders can use more quickly and accurately for decision-makers to prevent oil-spread spills. NOAA (2019) states that shoreline sensitivity mapping will play an essential role for planners or responders to identify vulnerable locations, set protection priorities, and identify cleaning strategies.
This study aims to spatially analyze the level of shoreline sensitivity based solely on coastal physical parameters such as the type of coastline, wave height, bathymetric slope, and tidal range. whereas biological and socio-economic parameters are not considered. The results of this study will
show the level of sensitivity of the Nusa Penida coastline simply by using only a few physical parameters that have been mentioned earlier.
Nusa Penida MPA is located in Klungkung Regency, Bali Province. Nusa Penida archipelago has a beach length of around 83.5 km. The Nusa Penida MPA covers an area of 20.057 ha with an outer border of 1 mile (1.8 km) from the coastline, marked by coordinates at six locations namely: Batununggul (115°34'37.10" E -8°39'14.43" S), Batu Abah
(115°39'41.36" E - 8°46'25.54" S),
Sekartaji (115°35'32.77" E -8°52'39.59"S), Sakti (115°24'13.28" E -8°45'46.33" S), Lembongan
(115°24'13.28" E - 8°41'5.82" S), and Jungutbatu (115°26'45.52" E - 8°
38'34.63" S).
Field observation of shoreline conducted in the MPA Nusa Penida in August and September 2020. The shoreline classification refers to the guidelines published by NOAA (2019), which can be accessed at https://response.restoration.noaa.gov. Each type of shoreline was contained in terms of which can be seen in Table 1.
Table 1. Shoreline Type Sensitivity Ranking
|
No |
Shoreline Type |
Score |
Sensitivity |
|
1. |
Code 1 and 2 (Man-Made Structure, Rocky Cliffs) |
1 |
Very Low Sensitive |
|
2. |
Code 3, 4, 5 and 6 (Sand) |
2 |
Low Sensitive |
|
3. |
Code 7 (Gravel) |
3 |
Medium Sensitive |
|
4. |
Code 8 (Sheltered area) |
4 |
High Sensitive |
|
5. |
Code 9 and 10 (Mangrove/mud) |
5 |
Very High Sensitive |
Daily tide data from January 2019 to August 2020 were employed. The data is supplied from the Automatic Weather Station (AWS) Maritime Benoa Bali, owned by Meteorology, Climatology, Geophysics Agency (BMKG) of Indonesia. The Admiralty method was applied to analyze the tidal data. The method calculated an average tide value from the average difference between the highest and lowest during that period. The formula (1) for measuring the tides is as follows.
TR = - LWL (1)
Where :
TR = Tidal Range
HWL = Highest Water Level
LWL = Lowest Water Level
The tidal range sensitivity level category were developed from the criteria made by Utantyo et al. (2003) by displaying the tidal range sensitivity level into five categories. The sensitivity value is assessed based on the following conditions in Table 2.
|
Table 2. Tydal Range Sensitivity Ranking | |
|
No Tide Range Score |
Sensitivity |
|
Very Low Sensitive Low Sensitive Medium Sensitive High Sensitive Very High Sensitive |
|
2.3 Bathymetric Slope Classification and Ranking The Nusa Penida bathymetric slope data were obtained from BATNAS BIG (National Bathymetry, Geospatial Information Agency) of Indonesia in 2018 that was accessed in |
https://tanahair.indonesia.gi.id. The bathymetry data has a resolution of 6 arc-second (180 m). Based on Husnayen et al. (2011) bathymetric slope sensitivity was classified according to the following conditions in Table 3. |
Table 3. Slope Bathymetry Sensitivity Ranking
|
No |
Slope |
Score |
Sensitivity |
|
1. |
>1,2% |
1 |
Very Low Sensitive |
|
2. |
0.9-1.2% |
2 |
Low Sensitive |
|
3. |
0.6-0.9% |
3 |
Medium Sensitive |
|
4. |
0.3-0.6% |
4 |
High Sensitive |
|
5. |
<0.3% |
5 |
Very High Sensitive |
The Nusa Penida wave height data were obtained from the wave simulation modeling results on the MIKE21 Spectral Wave FM Module in 2018 from the Marine and Fisheries Department of
Bali Province. This wave height information was categorized into two seasons: the east monsoon wave height during June, July, August and the west monsoon wave height during December, January and February. Wave height sensitivity level classification were developed from the criteria made by
Utantyo et al. (2003) by displaying the wave height sensitivity level into five categories. The wave height value was
Table 4. Wave High Sensitivity Ranking
|
No |
Wave High |
Score |
Sensitivity |
|
1. |
>2 m |
1 |
Very Low Sensitive |
|
2. |
1.6 –2 m |
2 |
Low Sensitive |
|
3. |
1.1 – 1.5 m |
3 |
Medium Sensitive |
|
4. |
0.6 – 1 m |
4 |
High Sensitive |
|
5. |
<0.5 m |
5 |
Very High Sensitive |
2.5 Shoreline Sensitivity Analysis
SI = Shoreline Index
Tidal range, slope, and wave high parameters were classified and weighted after the shoreline type was detected. In this study, Shoreline Sensitivity Index was defined 100 m from the coastline to
the sea. This area is assumed to be the
mean of the intertidal zone of the Nusa
Penida coastal area. According to IPIECA and IOGP (2016) floating oil spills containing hazardous hydrocarbons can stranded and dissolved during the tidal phase in the intertidal zone. Of course this phenomenon can cause high mortality rates in intertidal zone communities. Therefore this study focuses on measuring the level of sensitivity of shoreline in the intertidal zone of Nusa Penida.
All parameters involved a polygon
score, so the overlay method is called
weight overlay with the equation (2)
from PKSPL-IPB (1998).
SI=
(∑ЅСј)
(2)
also classified as a sensitivity level with the following Table 4.
SCj = Shoreline Parameters Score Based on Agustina and Sunarto (2016),
shoreline sensitivity level was classified
into five category by the equation (3):
∑SImaks- ∑Sl min
=
(3)
From formula (3) it can be known that
Shoreline Sensitivity Index criteria are determined by the following range of values: Very low sensitive (<4), Low
Sensitive (4-8), Medium Sensitive (8-12), High Sensitive (12-16), and Very High Sensitive (16-20).
Fifty-one different observation points were categorized as Shoreline characteristics based on the field survey. The characteristics and sensitivity level of the Nusa Penida shoreline shown in Table 5. The distribution of Nusa Penida shoreline types is presented in Figure 1.
Where:
|
Table 5. Shoreline Type and Sensitivity in Nusa Penida | ||||
|
No. |
Shoreline Type |
Sensitivity |
Area (ha) |
Percentage (%) |
|
1. 2. 3. |
1B-Exposed, Solid Man-Made Structures (E) 1C-Exposed, Rocky Cliffs w/Boulder Talus Base (E) 3A-Fine to Medium Grained Sand Beaches (E) |
Very Low Sensitive Very Low Sensitive Low Sensitive |
49.84 780.04 74.68 |
4.77 74.63 7.15 |
|
4. |
6A-Gravel Beach (E) |
Medium Sensitive |
84.78 |
8.11 |
|
5. |
10F-Manggroves (E) |
Very High Sensitive |
55.83 |
5.34 |
|
Total |
1045.17 |
100 | ||
Table 5 shows that the shoreline in Nusa Penida was categorized type 1B: Exposed, Solid Man-Made Structures (E) is 4.77% (49.84 ha), 74.63% (780.04 ha) with type 1C: Exposed, Rocky Cliffs w/ Boulder Talus Base (E). These two types of shorelines are a category in the Very Low Sensitive category. Shoreline with type 3A: Fine to Medium Grained Sand Beaches (E) is 7.15% (74.68 ha). This
type of shoreline belongs to the Low Sensitive category. The shoreline type 6A: Gravel Beach (E) is 8.11% (84.78 ha). This type is included in the Medium Sensitive category. There is a shoreline with type 10F: Mangroves, which is 5.34% (55.83 ha. Shoreline with mangrove types is included in the Very High Sensitive category.
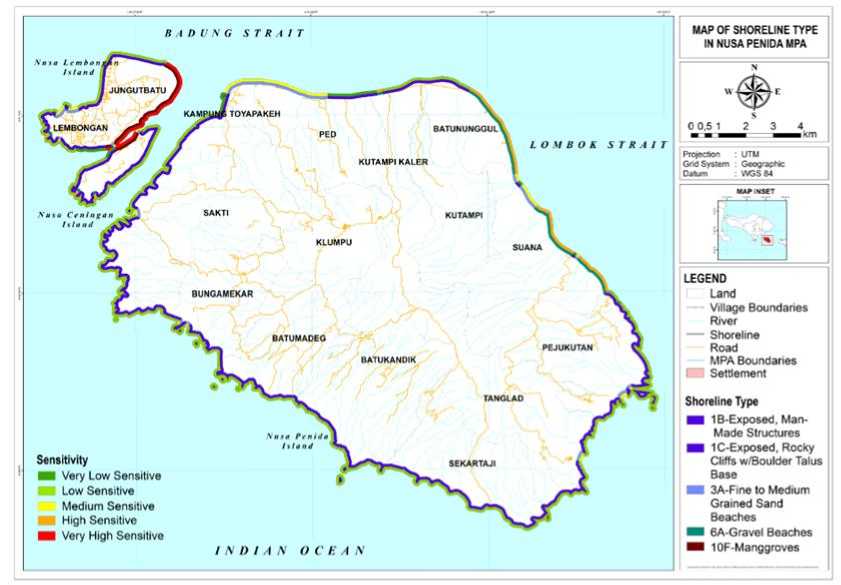
Figure 1.
Shoreline Type and Sensitivity in Nusa Penida MPA
|
3.1.2 Tide Range |
average was calculated as follows Table.6. |
Based on the daily tidal data
|
calculation, the Nusa |
Penida tidal |
Table 6. Tide Range in 2019
|
No. Month/Year |
Maximum Minimum Yearly Tydal Tydal Tydal Tydal High (m) High (m) Range (m) verage |
|
1 Jan-19 2 Feb-19 3 Mar-19 4 Apr-19 5 May-19 6 Jun-19 7 Jul-19 8 Aug-19 9 Sep-19 10 Oct-19 11 Nov-19 12 Dec-19 |
2.7 1.1 1.6 1.8 2.6 1.0 1.6 2.5 0.8 1.7 2.7 0.6 2.1 2.8 0.6 2.2 2.7 0.8 1.9 2.7 1.0 1.7 2.7 1.0 1.7 2.6 1.0 1.6 2.8 0.8 2.0 2.8 0.8 2.0 2.6 0.8 1.8 |
Table 7. Tide Range in 2020
|
No. Month/Year |
Maximum Minimum Yearly Tydal Tydal Tydal Tydal j j j Averape High (m) High (m) Range (m) Average |
|
1 Jan-20 2 Feb-20 3 Mar-20 4 Apr-20 5 May-20 6 Jun-20 7 Jul-20 8 Aug-20 |
2.6 0.9 1.7 1.8 2.6 0.9 1.7 2.5 0.9 1.6 2.8 0.8 2 2.9 0.7 2.2 2.8 0.8 2 2.6 0.8 1.8 2.5 0.9 1.6 |
Table 6 shows that in 2019 the tides m in 2020. The lowest tide point occurred in Nusa Penida ranged from 1.6 m to 2.2 in March and August, while the highest m. The lowest tide point occurred in tide point occurred in May 2020. The January and February, while the highest average tide value in Nusa Penida in 2020 tide point occurred in May 2019. The was also 1.8 m. Finally, the average tidal average tide value in Nusa Penida sea in value in Nusa Penida is 1.8 m, including 2019 was 1.8 m. Table 7 shows that Nusa in the High Sensitive category.
Penida's tides also ranged from 1.6 m - 2.2
Bathymetric slope sensitivity in Nusa Penida from BATNAS BIG was analyzed and it shown in Figure 2. From the picture above it is known the level of sensitivity of the bathymetric
slope of the intertidal zone of the Nusa Penida coast. Sensitivity level, area, and percentage of sensitivity level are obtained, as shown in Table 8.
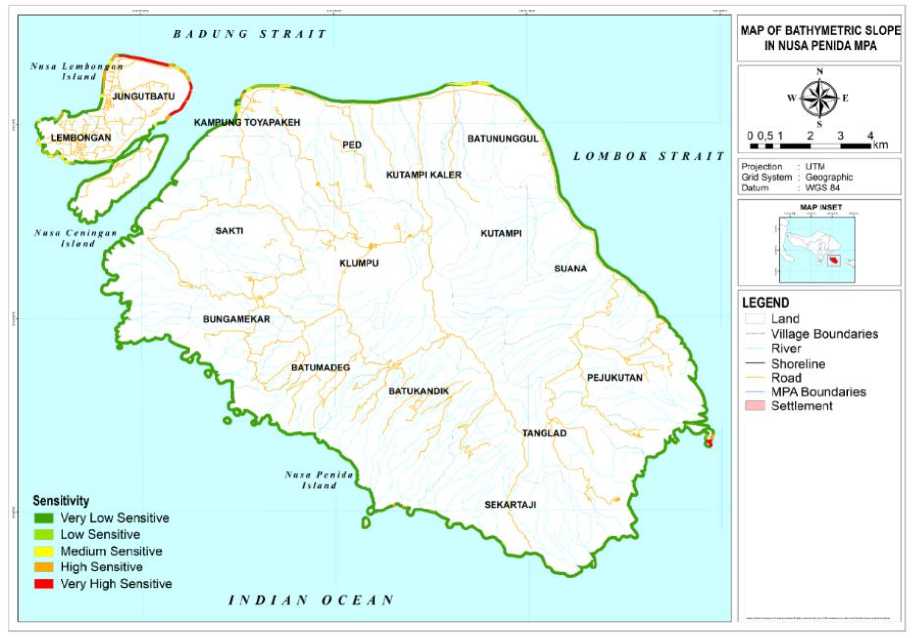
Figure 2.
Slope Bathymetry of Nusa Penida Marine Areas
Table 8. Slope Sensitivity
|
No |
Slope |
Sensitivity |
Area (ha) |
Percentage (%) |
|
1. |
<0.3% |
Very High Sensitive |
32.34 |
3.09 |
|
2. |
0.3 – 0.6% |
High Sensitive |
32.20 |
3.08 |
|
3. |
0.6 – 0.9% |
Medium Sensitive |
37.52 |
3.59 |
|
4. |
0.9 – 1.2% |
Low Sensitive |
31.10 |
2.98 |
|
5. |
>1.2% |
Very Low Sensitive |
912.01 |
87.26 |
|
Total Area |
1045.17 |
100 | ||
-
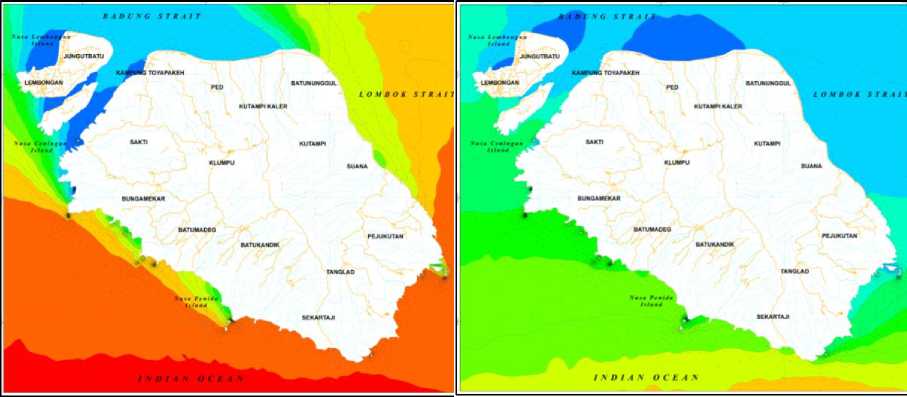
3.1.4 Wave High cases. The modeling of wave height in
As previously stated, the Nusa Penida Nusa Penida in each season is presented in wave height data showed as two seasons Figure 3.
(a) (b)
(c)
(d)
Figure 3.
(a) Wave high in Nusa Penida during the east season; (b) Wave high in Nusa Penida during the west season, (c) Wave high sensitivity during the east season;
(d) Wave high sensitivity during the west season.
Figure 3 (a) shows that the characteristic wave height in Nusa Penida in the east monsoon ranges from 0.1-2.2 m. The direction of the wave currents also indicates that the waves are moving from the Indian Ocean in the eastern part of the island and the Lombok Strait towards the coastal areas of Nusa Penida. Figure 3 (b) shows that the characteristic wave height in Nusa Penida during the west monsoon ranges from 0.1-1.6 m. The direction of the wave currents also shows that the waves move from the Indian Ocean in the
southern part of the island towards the coastal area of Nusa Penida, and from the east, the island is stifling to the west. Figure 3 (c) and (d) show the level of high wave sensitivity on the Nusa Penida coastal area during the east and west monsoons. It can be seen that there is a difference in sensitivity in each season due to differences in wave characteristics in the east and west monsoons. This difference occurs due to changes in the wind direction and energy that drives the surface waves. The wave high sensitivity
in each season shown in Table 9 and Table 10 in detail.
Table 9. The sensitivity of Wave High in Nusa Penida during East Season
|
No |
Wave High |
Sensitivity |
Area (ha) |
Percentage (%) |
|
1. |
>2.1 m |
Very Low Sensitive |
0 |
0 |
|
2. |
1.6-2 m |
Low Sensitive |
312.64 |
29.91 |
|
3. |
1.1-1.5 m |
Medium Sensitive |
207.72 |
19.87 |
|
4. |
0.6-1 m |
High Sensitive |
111.96 |
10.71 |
|
5. |
<0.5 m |
Very High Sensitive |
412.85 |
39.50 |
|
Total Area |
1045.17 |
100 | ||
Table 9 shows the high wave sensitivity ha), the high sensitive category was in Nusa Penida during the east season. 10.71% (111.96 ha), and the very high The area in the low sensitivity category sensitive category was 39.50% (412.85 was 29.91% (312.64 ha), the medium ha).
sensitive category was 19.87% (207.72
Table 10. The sensitivity of Wave High in Nusa Penida during West Season
|
No |
Wave High Sensitivity Area (ha) Percentage (%) |
|
1.1-1.5 m Medium Sensitive 13.77 1.32 0.6-1 m High Sensitive 340.63 32.59 |
|
5. |
<0.5 m Very High Sensitive 690.77 66.09 Total Area 1045.17 100 |
Table 10 and the diagram show that wave high sensitivity in Nusa Penida during the east season was categorized from medium sensitive to very high sensitivity. The area with the Medium Sensitive category is 1.32% (13.77 ha), the High Sensitive category was 32.59% (340.63 ha), and the Very High Sensitive category was 66.09% (690.77 ha).
The calculation of shoreline sensitivity on Nusa Penida's coast is only carried out 100 m from the coastline towards the sea following the determined AOI. The shoreline sensitivity level in Nusa Penida
can be divided into two seasons based on the wave conditions because the seasonal wave affects the level of sensitivity of the shoreline Nusa Penida. The shoreline sensitivity index in each season (East, West) is described as follows.
-
1) Shoreline Sensitivity Index during East Season (from June to August) The sensitivity of the shoreline in Nusa
Penida is in the Low Sensitive to very high sensitive category. Consecutive maps of sensitive areas and the percentage of sensitive areas were shown in Table 11 and Figure 4.
Table 11. Area and Percentage of Shoreline Sensitivity in East Season
|
No. |
Sensitivity |
Area (ha) |
Percentage (%) |
|
1. |
Very Low Sensitive |
0 |
0 |
|
2. |
Low Sensitive |
294.44 |
28.17 |
|
3. |
Medium Sensitive |
627.63 |
60.05 |
|
4. |
High Sensitive |
98.11 |
9.39 |
|
5. |
Very High Sensitive |
24.99 |
2.39 |
|
Total |
1045.17 |
100 |
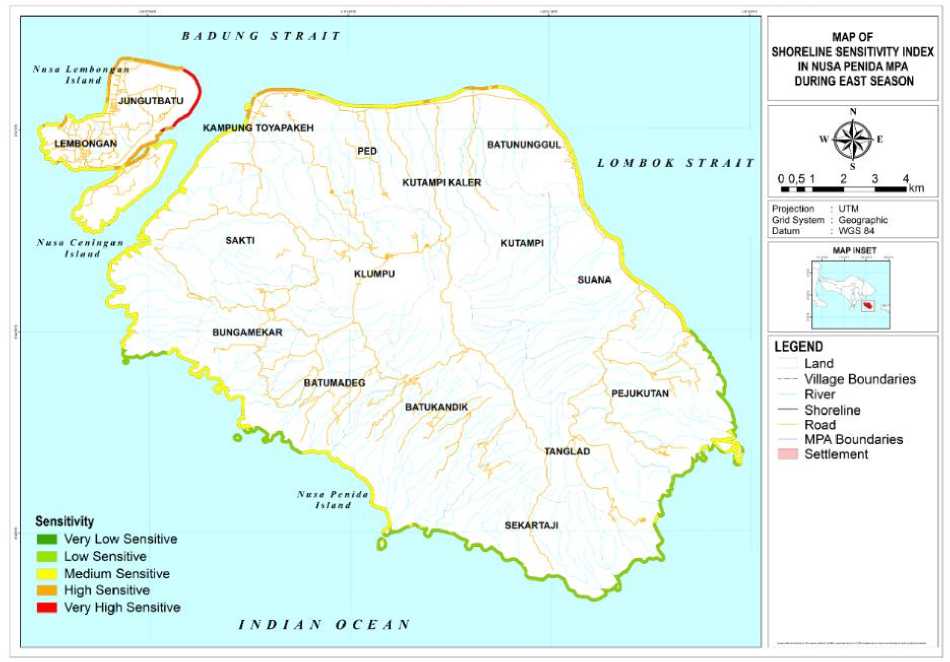
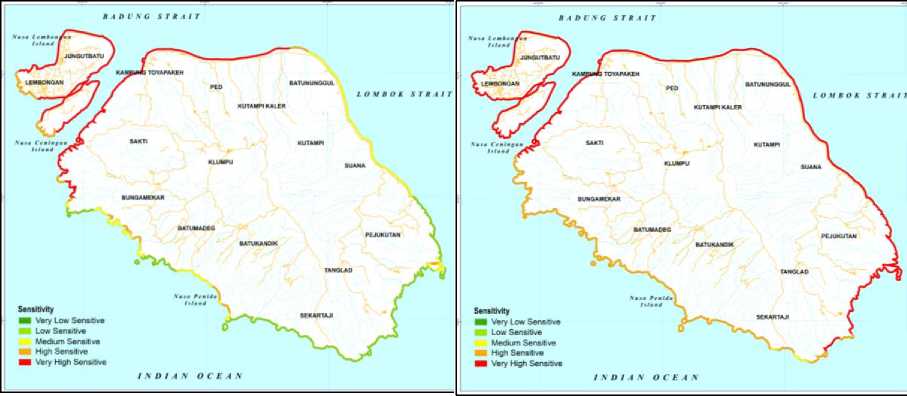
Figure 4.
Shoreline Sensitivity Index in Nusa Penida During East Season
Figure 5 shows that the east monsoon season with the low sensitivity category dominates in the eastern coastal areas of Nusa Penida, namely in the Sekartaji Village, Tanglad, and Pejukutan Village, as well as a small part in the coastal Batukandik Village, Batumadeg, and Bungamekar. The coastal areas with the Medium Sensitivity category dominate in the northern and western coastal areas of Nusa Penida, namely in the Suana Village, Batununggul, Kutampikaler, Ped, Sakti, Lembongan, and some part in
Bungamekar Village, Batukandik, and Pejukutan (Atuh Beach). The coastal areas of Nusa Penida with the high sensitive category dominate the coastal areas of Jungutbatu Village and Kampung Toyapakeh. Besides, there are also High Sensitive areas in Lembongan and Kutampi Kaler Villages coastal areas. Meanwhile, the coastal areas with the Very high sensitive category only dominate the coastal areas of Jungutbatu Village.
-
2) Shoreline Sensitivity Index during West Season (from December to February)
Based on the analysis of the sensitivity level of shoreline Nusa Penida in the west season, the sensitivity of shoreline in Nusa
Penida is low sensitivity to very high sensitive category. Consecutively, tables and maps of sensitive areas and the percentage of sensitive areas were shown in Table 12 and Figure 5.
Table 12. Area and Percentage of Shoreline Sensitivity in West Season
|
No. |
Sensitivity |
Area (ha) |
Percentage (%) |
|
1. |
Very Low Sensitive |
0 |
0 |
|
2. |
Low Sensitive |
0.12 |
0.01 |
|
3. |
Medium Sensitive |
816.95 |
78.16 |
|
4. |
High Sensitive |
203.11 |
19.43 |
|
5. |
Very High Sensitive |
24.99 |
2.39 |
|
Total |
1045.17 |
100 |
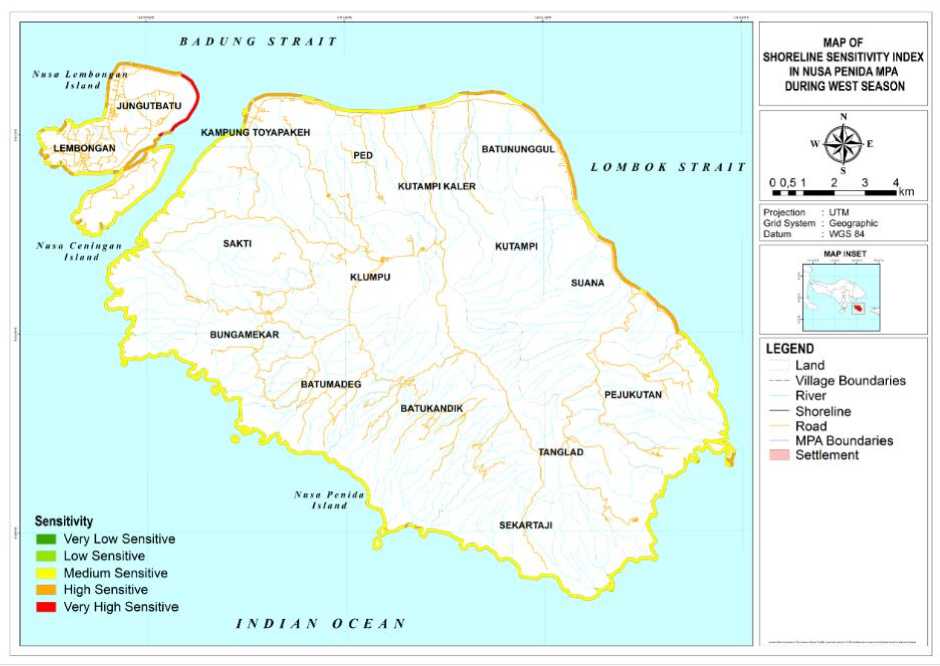
Figure 5.
Shoreline Sensitivity Index in Nusa Penida During West Season
Figure 5 shows that in the east monsoon, the low sensitivity category is in a small area of the coast of Sekartaji Village. The coastal areas with the medium sensitivity category dominate in the eastern, southern, and western coastal
areas of Nusa Penida, namely in the Pejukutan Village, Tanglad, Batukandik, Batumadeg, Bungamekar, Sakti, Lembongan, Ped, and Kutampikaler Village. The medium sensitive category is also found in a small part of the coastal
areas of Suana Village, Batununggul, and Kampung Toyapakeh. The coastal areas with the High Sensitive category dominate the northern coastal areas of Nusa Penida, namely on the coast of the Suana Village, Batununggul, Kampung Toyapakeh, and partly of Jungutbatu Village. Meanwhile, coastal areas with the Very high sensitive category are only found in a part of the coastal area of Jungutbatu Village.
The sensitivity of shoreline to oil spills can be determined based on several parameters such as substrate type, tides, slope and wave height. The substrate type parameter is used because the level of oil penetration to the substrate type will have a different impact based on its permeability properties. From the research conducted, Nusa Penida shoreline is divided into 5 types, namely, Exposed Solid Man Made, Exposed Rocky Cliffs, Grained Sand Beach, Gravel Beach and Mangrove.
NOAA (2019) states that shoreline with the type of Exposed Solid Man Made Structure and Exposed Rocky Cliffs is impermeable which causes oil to not be able to penetrate this type of shoreline. In addition, this type of shoreline is also included in the high energy shoreline class, which means that shoreline has the ability to clean naturally in a short time (rapid natural removal). Then for shoreline with the Grained Sand Beach and Gravel Beach types, it is permeable which causes oil to penetrate. In addition, this type of shoreline is also included in the mixed energy shoreline class, which means that shoreline still has the ability to clean naturally but in a relatively slow time. And for shoreline with mangrove type it is also permeable which causes oil to penetrate. This type of shoreline is also included in the low energy shoreline class, which means that shoreline tends to avoid
waves and tides so that the cleaning time is very slow (slow natural removal).
Lee, et al. (2020), state that tides and waves are important factors in determining the penetration speed of oil spills from the sea to the coast. However, waves and tides also have a major influence on the natural cleaning up of oil spills in coastal areas. High waves and tides will speed up the spill cleanup process. On the other hand, low waves and low tides will make the oil cleaning process slower. NOAA (2019) states that waves play a role in forming offshore currents that can reflect hard surfaces and push oil away from the coast. In addition, waves can also mix and process coastal sediments, causing the loss of stranded oil.
NOAA (2019) also adds that changes in tidal energy are also important in determining the potential impact of oil spills on coastal habitats. Tides have the potential to remove stranded oil on the coast. However, the tides in Nusa Penida are low and in the very high sensitive category. Areas with low tides usually accommodate more infauna than areas with high tides.
The slope of Nusa Penida varies greatly. The slope is also closely related to tides and wave height. Sloping areas will have a higher level of sensitivity, because the level of difficulty to clean the oil is also more difficult and the effect of wave energy and tidal currents is relatively small. Relatively steep beaches have greater wave energy and have the potential to clean up oil more quickly.
The shoreline sensitivity index of Nusa Penida is strongly influenced by the seasons because in the west and east monsoons there is a significant difference in wave height. In the west monsoon there is a decrease in wave height which causes the sensitivity level in several areas to increase. This increased sensitivity mostly occurred in the eastern and northern parts of the island, namely in the villages of
Sekartaji, Tanglad, Pejukutan, Suana and Batununggul. Western part of the island there is no change in the level of sensitivity because the wave conditions are relatively the same in each season. However, in Jungutbatu village there is an area in the Very High Sensitive category because the shoreline type is mangrove, with low wave height and tide, and a flat slope.
-
1. The Shoreline Sensitivity Index (SSI) in Nusa Penida MPA is at a low sensitivity level to very high sensitivity. SSI measurements using physical parameters such as shoreline type, bathymetric slope, tidal range, and wave height are able to provide an overview of the sensitivity level of the Nusa Penida coast because differences in the characteristics of each of these parameters can affect the duration of penetration of oil spills in coastal areas. Thus, the priority areas for rescue can be determined.
-
2. The SSI in Nusa Penida in the east and west monsoons is quite different but they are both dominated by the medium sensitivity category. This is because the majority of Nusa Penida's shoreline is in the form of steep cliffs. The difference in wave height during east and west monsoons greatly affects the sensitivity level of the Nusa Penida coastal area. The decrease in wave height during west monsoon caused an increase in the area with medium sensitivity by 18.16%, and an increase in the area with a high sensitivity by 10.04%. Interestingly, the coastal areas of Jungutbatu, Lembongan, and
Ceningan villages have very high
sensitivity and are not affected by the east or west monsoons. This area is very sensitive because the shoreline type of this area is mangrove forest which is very high sensitive to oil spills. In addition, the bathymeytric slope data also shows that this area has a flat slope, and also with low wave and tidal energy in every monsoons.
The protection of potential resources on the coast of Nusa Penida MPA is quite significant, so it is necessary to carry out further studies on the sensitivity of the Nusa Penida coast by developing methods and adding several parameters such as biological and socio-economic parameters so the shoreline sensitivity level of Nusa Penida MPA is more complete.
REFERENCES
Agustina, N. & Sunarto. 2016. Kajian Tingkat Kepekaan Lingkungan Terhadap Pencemaran Miyak di Wilayah Kepesisiran Jepara. Jurnal Bumi Indonesia. Vol. 5, No. 3, pages 1-10.
BPS. 2020. Kecamatan Klungkung dalam Angka 2019. BPS: Kungkung
Darma, N., R. Basuki, M. Welly. 2010. Profil Kawasan Konservasi Perairan (KKP) Nusa Penida, Kabupaten Klungkung, Provinsi Bali. Bali
Dermawan, A. 2014. Status Pengelolaan Efektif Kawasan Konservasi Perairan Pesisir dan Pulau-pulau Kecil di Indonesia. KKP:
Indonesia.
Dewanto, Y.A., D. Faturachman. 2018. Indonesian Sea Accident Analysis (Case Study from 2003-2013). IOP Conference Series: Earth and Environmental Science. Sc. 135 012001
Husnayaen, A., B. Rimba, T. Osawa, I N. S. Parwata, Abd. R. As-syakur, F. Kasim, I A. Astarini. 2018. Physical Assessment of Coastal Vulnerability Under Enhanced Land Subsidence in Semarang, Indonesia, Using Multi Sensor Satellite Data. Journal of Advances in Space Research. Page 1-19.
IPIECA/IMO/OGP. 2012. Sensitivity Mapping for Oil Spill Response. London: United Kingdom
IPIECA/IOGP. 2016. Impacts of Oil Spills on Shorelines. London: United Kingdom
Lee, K.H., T.G. Kim, and Y. H. Cho. 2020. Influence of Tidal Current, Wind, and Wave in Hebei Spirit Oil Spill Modeling. Journal of Marine Science and Engineering MDPI. Vol. 8 No. 69, Page 1-18
NOAA. 2019. Environmental Sensitivity Index (ESI) Maps and Data. [Cited 2019 Sept. 23]. Available from: https://response.restoration.noaa.g ov/resources/environmental-sensitivity-index-esi-maps.
Pemkab Klungkung. 2012. Rencana Pengelolaan KKP Nusa Penida, Kabupaten Klungkung Provinsi Bali. Klungkung.
PKSPL-IPB. 1998. Indeks Kepekaan
Lingkungan Selat Bali. Pusat Kajian Sumberdaya Pesisir dan Lautan Institut Pertanian Bogor.
Sanjaya, W., 2009. Monitoring Terumbu Karang dan Ikan Nusa Penida. Dinas Peternakan, Perikanan dan Kelautan (DPPK) Klungkung, Yayasan Bahtera Nusantara, The Nature Conservancy Indonesia Marine Program (TNC-IMP). 64 pp.
Tania. C., M, Welly., AH, Muljadi. 2011. Wilingness to Pay Study, Kawasan Konservasi Perairan Nusa Penida, Kabupaten Klungkung, Bali.
Turak E. and Lyndon D. 2011. Biodiversity and Conservation Priorities of Reef-Building Corals in Nusa Penida Final Report to Conservation International 66 pp.
UNEP-WCMC. 2019. Environmental Sensitivity Mapping for Oil and Gas Development: A High-Level Review of Methodologies.
Cambridge: UK.
Utantyo., Hartono., Sutikno. 2003. Aplikasi SIG untuk Pemetaan Indeks Kepekaan Lingkungan: Studi Kasus di Pesisir Cilacap dan Segara Anakan. Journal of Manusia dan Lingkungan. Vol. 10 No. 3, Pg. 131-140.
Widyarsana, I M. W. and E. Agustina. 2020. Waste Management Study in the Archipelago Tourism Area (Case Study: Nusa Penida District, Bali Province, Indonesia). ETMC and RC EnvE.
60
Discussion and feedback