LAND SUBSIDENCE MONITORING ON THE UNDERGROUND MRT CONSTRUCTION AREA IN JAKARTA, INDONESIA
on
Land Subsidence Monitoring on The Underground...
[Chara Bernike, dkk]
LAND SUBSIDENCE MONITORING ON THE UNDERGROUND MRT CONSTRUCTION AREA IN JAKARTA, INDONESIA
Chara Bernike1*), Masahiko Nagai2), Takahiro Osawa3)
1)Graduate Student of Environmental Science, Udayana University
2)Center of Research and Application of Satellite Remote Sensing (YUCARS), Yamaguchi University 3)Center for Remote Sensing and Ocean Science (CReSOS), Udayana University
*Email: charabernike@gmail.com
ABSTRACT
Space utilization for measurement of the changes of Earth’s surface is an alternative monitoring technique. Covering a large area with better spatial resolution, comparable accuracy and costly low compared with conventional measurement have made SAR technology more popular in monitoring the subsidence. Land subsidence is the vertical movement of the land surface mainly triggered by fluid extraction, load of construction, geological condition, natural compaction or tectonic activity. Previous researchers have found that Jakarta has experienced land subsidence for decades. On the other hand, rapid urban growth and severe congestion problem in Jakarta are also crucial issues. By providing the first MRT subway, it is expected to be solved the congestion problem. Persistent Scatterer Interferometry Synthetic Aperture Radar (PSInSAR) is one of method to identify the deformation with millimeter accuracy. It was perfectly useful for studied on the land subsidence in consequence of the first MRT subway project in Jakarta. The land displacement monitoring along MRT subway trajectory has been acquired by processing Sentinel 1 and ALOS PALSAR-2. This study was able to investigate the land subsidence by using SARPROZ. Finally, the results of this study indicated that land subsidence occurred in the construction area with the lowest land subsidence rate of -0.6 cm/year and the highest land subsidence rate was -7.3 cm/year.
Keywords: PSInSAR; subway; land subsidence; MRT.
Jakarta as the capital city of Indonesia is a very dense city, populated by 11,063,324 people (Department of Population and Civil Registration Jakarta, 2019). Rapid population growth will certainly have impacts on the carrying capacity of settlement areas, including the daily needs of people such as fresh water consumption and transportation. One of the critical issues of increased urban development is land subsidence and its impacts. United States Geological Survey (USGS) defines land subsidence as gradual settling or sudden sinking of the Earth’s surface due to the removal or displacement of subsurface earth
material. By its definition, subsidence is a lowering of the ground level in vertical motion caused by aquifer system compaction associated with groundwater withdrawal, the load of constructions, tunnel construction or underground mining and natural subsidence either from natural compaction or tectonic activities (Chaussard et al., 2013; USGS, 2020). Based on data obtained by Department of Industrial and Energy Jakarta, 3 groundwater used in Jakarta is 8,155,282 m3 in 2018 and 6,693,949 m3 until September 2019. South Jakarta consumed 4,348,123 m3 of groundwater in 2018 because it has a lot of high rises buildings and settlement areas. Records indicated vertical movement in Jakarta is vary from 2 cm up to 26 cm in the
ECOTROPHIC • 14(2):190-200 p-ISSN:1907-5626,e-ISSN: 2503-3395
190
coastal area (Abidin et al.,2011; Ng et al.,2012; Koudogbo et al., 2012; Caussard et al., 2013; Hutabarat et al., 2017; Widodo et al., 2019). Impacts of land subsidence physically can be seen on permanent damage of constructions and infrastructures, sinking of houses and buildings, wider expansion of coastal and/or flooding areas, and increased inland seawater intrusion (Abidin et al, 2015; Moe et al, 2016).
Tunneling may include groundwater dewatering. However, if it compared to groundwater withdrawn for daily need, tunnel dewatering may seem less influential but potentially subside. Researchers were analyzing subsidence using satellite remote sensing on several location, such as in Shanghai subway (Perrisin et al, 2012), Burata railway tunnel in Spain (Fernandez et al, 2013), Madrid city (Sillerico et al, 2015). Those studies showed that subsidence occurred on the underground construction area with various value. The land subsidence in Jakarta has been measured using leveling, GPS data, or InSAR methods (Bayuaji et al, 2010; Abidin et al, 2007; 2008; 2011; 2015). However, measuring displacement in a large area using conventional surveys such as leveling and GPS surveys, will costly high and limited on specific measurement points. Therefore, the technology that can be used to study ground deformation in wide areas and has better spatial resolution than conventional methods (Osmanoglu et al, 2010; Perrisin et al, 2012).
This paper aims to monitor the displacement on the new subway in Jakarta with approximately length is 6 kilometers through.
Persistent scatterers InSAR (PSInSAR) is a useful tool to investigate the subsidence pattern with a highly coherent target (Ferreti et al, 2001; Perrisin et al, 2012). This method identifies image pixels with coherent backscatter signals over a long interval of time. Considering the importance of monitoring subsidence of the underground
MRT construction area, this research applied Persistent Scatterer InSAR (PSInSAR) to obtain land subsidence in millimeter accuracy by using SARPROZ software then processing 19 scenes of Sentinel 1A from 2014 to 2016 and 13 scenes of ALOS-2 from 2016 to 2019.
Jakarta is located at Northern West Java sea between 5o48’30” and 6o24’00” S latitude and 106o33’00” and 107o00’00” E longitude, this area relatively flat with slopes <2%. Study area is formed by alluvial soil with high compressibility (compressibility index: 0.36 – 1.16), very soft or soft consistency, and low bearing capacity (Ministry of Energy and Mineral Resources).
The tunnel is excavated from South Jakarta to Central Jakarta with approximately 6 kilometers length with depth of tunnel is 17 meters to 25 meters through the Sisingamangaraja street as a transition from elevated station to underground station and Jendral Sudirman street. (Environmental Impacts Analysis of MRT Jakarta, 2010).
Nineteen scenes of Sentinel-1 with VV polarization between October 2014 and July 2016 along an ascending orbit were used to analyze the subsidence before construction period. To carry out a PSInSAR with SARPROZ from January 2016 to December 2019, was utilized ALOS PALSAR-2 with HH polarization during construction period. Sentinel 1A data is provided by Alaska Satellite Facility (https://search.asf.alaska.edu) and ALOS PALSAR-2 by Japan Aerospace Exploration Agency (https://www.eorc.jaxa.jp).
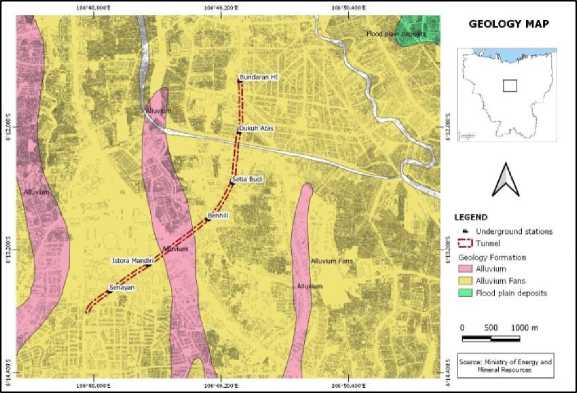
Figure 1.
Geology map of study area
Tabel 1. List of SAR data: Sentinel-1A (path number 98) ALOS-2 (path number 135)
|
No |
Sentinel-1A Date |
ALOS-2 Date |
|
1 |
2014-10-12 |
2016-01-25 |
|
2 |
2014-11-17 |
2016-09-05 |
|
3 |
2014-12-11 |
2017-06-12 |
|
4 |
2015-01-28 |
2017-10-30 |
|
5 |
2015-02-21 |
2017-12-11 |
|
6 |
2015-03-17 |
2018-01-08 |
|
7 |
2015-04-10 |
2018-04-16 |
|
8 |
2015-05-04 |
2018-08-06 |
|
9 |
2015-07-15 |
2018-12-10 |
|
10 |
2015-08-08 |
2019-02-04 |
|
11 |
2015-09-01 |
2019-06-10 |
|
12 |
2015-10-19 |
2019-10-14 |
|
13 |
2016-01-23 |
2019-12-09 |
|
14 |
2016-02-16 | |
|
15 |
2016-03-11 | |
|
16 |
2016-04-28 | |
|
17 |
2016-05-22 | |
|
18 |
2016-06-15 | |
|
19 |
2016-07-09 |
InSAR analysis method that used in this research was PSInSAR. Typically, PSInSAR corresponds to man-made objects such as building or bridge, as well as it will give a stable reflection to the sensor over
time. This method suitable applied in the dense of permanent structures. So, PSInSAR was chosen method to investigate the land subsidence in the study area. Multiple pairs of radar images with one master image were processed by using SARPROZ in MatLab. The internet connection is required while processing the data.
-
1. Data preparation
First of all, preparing required data for processing in SARPROZ at least 10 interferograms would be obtain reliable results. The master image had been selected to minimize the sum decorrelation with minimum normal baseline. An advanced technology was used in this software which automatically selected the master images based on the baseline information. Once a master image had set, the slave images would be resampled for each image with respected to master image. Coregistration was performance as last step in data preparation.
-
2. Preliminary analysis and geocoding
After preparing the data, further step was calculated the amplitude stability for each pixel where the amplitude dispersion index (DA) is defined as below (Feretti, 2001):
DA = µA
Where DA is the amplitude dispersion index, σA is standard deviation and µA is the mean of amplitude. The Amplitude Stability Index in the software is defined as a subtraction from 1, as highest value of correlation, with the amplitude dispersion index. Google Earth was used to choose the ground control object, in order to identify the reflectivity map for geocoding the dataset. In addition, SARPROZ was directly connected to Shuttle Radar Topographic Mission (SRTM) for providing the DEM which used removal the topographic phase.
-
3. Atmospheric Phase screen (APS) estimation
In SARPROZ, atmospheric phase was estimated in APS processing tools. The amplitude stability index was set with threshold 0.85 to select the PSCs. The threshold was a parameter to
eliminate inappropriate pixels to be PS candidates which were below the threshold value. Furthermore, reference point had to be selected considering that InSAR measure the relative movement of the ground to the reference point. The reference point mostly like to be stable. The value of surface stability was 0 to 1. The value was 0 or nearly 0 represented the low correlation, in contrast, the value of 1 was showing the perfectly coherence data which indicated the point was on the ground. So, selected reference point was point with value approach to 1. Some image had a lower than 0.85, as the threshold determined, would not include.
-
4. Multi temporal analysis
In SARPROZ, the PSs selected based on the amplitude stability index, based on amplitude information contained in SAR data, and the temporal coh(4e)rence in pixels based on phase information. In multitemporal analysis, the threshold was lower which included more points. In this study, selection of pixels had to have amplitude stability at least 0.69 and a coherence higher than 0.80 were selected as PSs. After the pixels selected, the selected pixels were geocoded and exported to be transformed to PS points. Finally, the time-series deformation was implemented in Google Earth or converted to csv file.
About 260 independent targets have been found at tunnel construction area from Sentinel 1A and ALOS PALSAR-2 data set with PSInSAR. Two LOS subsidence maps are presented in Figure 4.6, the first one was estimated with Sentinel 1A between 2014 and 2016, and the second one has been
detected by ALOS PALSAR-2 from 2016 to movement value, in the first plot by the color 2019. These radar data are described the scale.
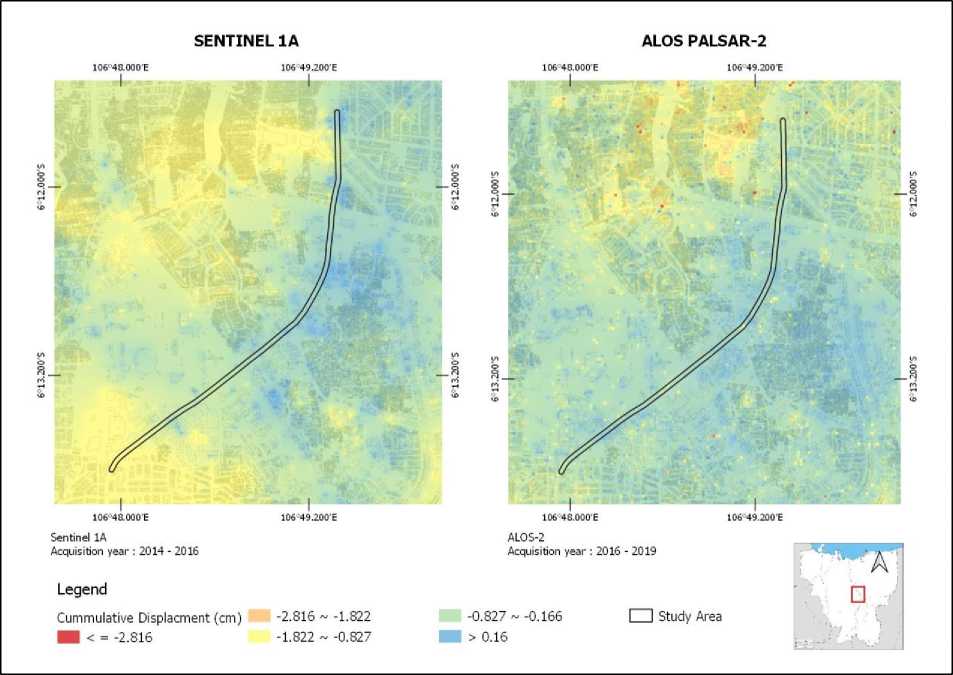
Figure 2.
The cumulative subsidence in research area
The displacement analysis result in LOS direction should be transformed to vertical motion by assumed that all movement is moved vertically.
MRT tunnel excavation in Jakarta was using four TBMs named Antareja I, Antareja II which were used in CP 104- CP 105 started from Pemuda statue to Setia Budi station, whereas Mustikabumi I and Mustikabumi II were excavated from Bundaram HI station to Setia Budi station in CP 106 package. The tunnel excavation in CP 104 – CP 105 established from September 2015 and CP 106 was on February 2016. All station was finally linked
on 23 February 2017, then the mechanical works and support systems installation gradually continued. Finally, on 24 March 2019, MRT Jakarta was officially operated. The PSs which represented the subsidence at the CP 104 – CP 105, PS’s ID point 5185 (Sentinel 1A processed images) and ID point 32402 (ALOS 2 processed images), were chosen. As well as at CP 106 project area, PS’s ID point 8775 (Sentinel 1A processed images) and ID point 52068 (ALOS 2 processed images), have been selected.
By calculated LOS displacement and incident angle of LOS, vertical displacements are found as shown below:
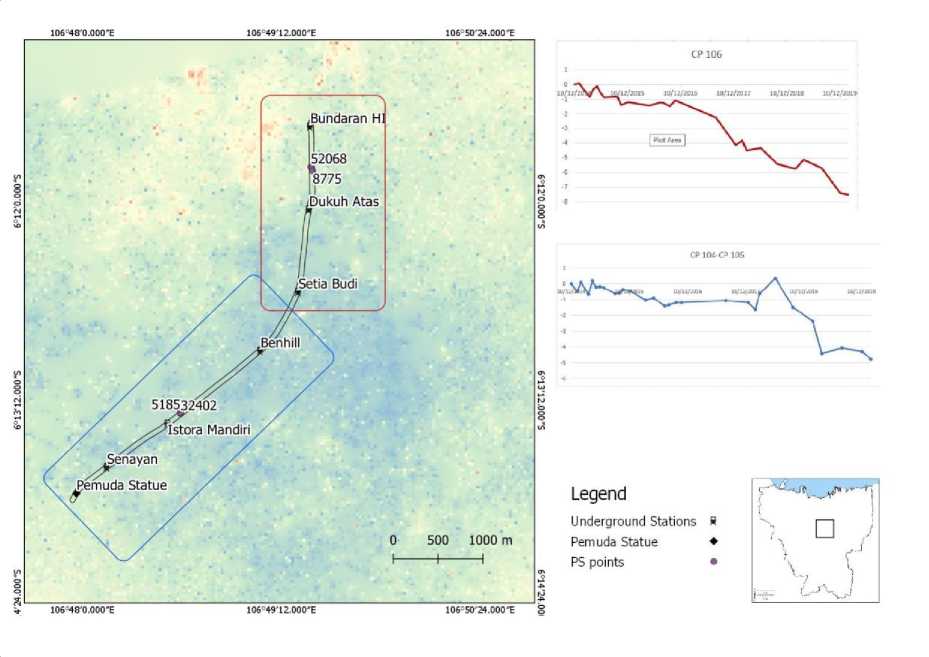
Figure 3.
Selected point of PS and progressive movement along subway trajectory (a) CP 106 (b) CP 104 – CP 105
The graph is given information about subsidence time-series at CP 104 – CP 105 and CP 106. Both of selected PS are shown subsidence trend continuously decline.
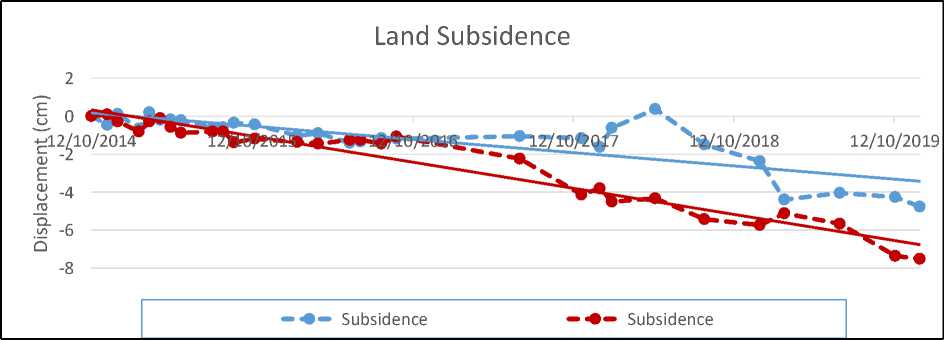
Figure 4.
Subsidence time-series
In order to validate the subsidence which was measured by satellite data, this study used 11 points of GPS geodetic
measurement provided by Ministry of
Energy and Mineral Resources in 2018. Eleven GPS geodetic points measurement for monitoring land deformation are spread all over Jakarta areas. This research used 3
points at North Jakarta (Muara Angke, Kebon Bawang and Marunda), 3 points at West Jakarta (Duri Kosambi, Latumenten and Victtoria Residence), 1 point at Central Jakarta (Gambir), 2 points at South Jakarta
(Duren Tiga and Kebagusan Raya), and 2 points at East Jakarta (Cipinang and Halim). Location of each point presented as a map below.
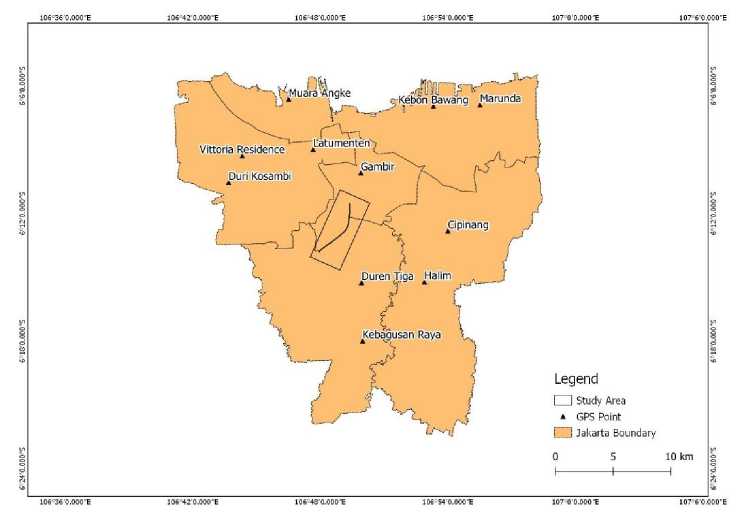
Figure 5.
Location of GPS Geodetic observation points
Furthermore, to validate the accuracy of ALOS-2 data with GPS Geodetic data in 2018, so the comparison between PSInSAR
and GPS Geodetic data measurement show as below.
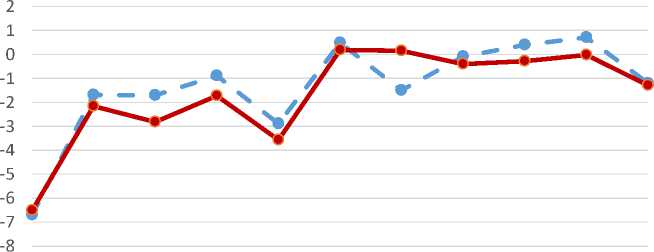

GPS PSInSAR
Figure 6.
PSInSAR and GPS Geodetic comparison
The relationship model of PSInSAR regression. A scatterplot data can be used to analysis and GPS geodetic was using linear determine strength of two variables.
Correlation coefficient value of linier regression is 0.875 which is acceptable.
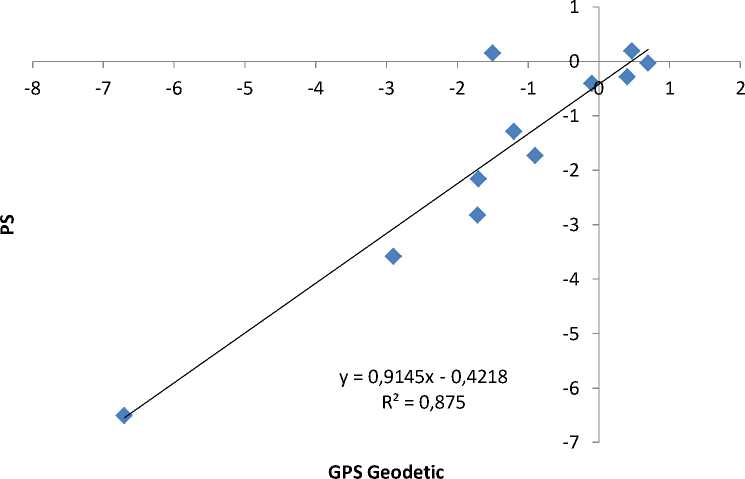
Figure 7.
Linier regression
In case of Shanghai, which has similar profile with Jakarta, the subway lines are formed on the very soft clay and very soft silt. The study revealed that the subsidence has occurred on the Shanghai subway which operated in 2009 onward with -2 cm/year to –4 cm/year (Perrisin et al, 2012). Other case of subsidence was in Genoa city, northern Italy. The tunnel in this city dominated by the marine deposit of the Ortovero clay, made up of prevailing marls, overconsolidated marls clays, siltstone and fine sandstones. Cumulatively value of displacement in genoa city subway was -0.5 to 2.5 cm/year most likely to the alluvial deposits (Roccheggiani et al, 2019).
Nonetheless, Other study related to tunnel construction is M-30 twin tunnel in Spain. The average subsidence identified in twin tunnel in Madrid city, does not represent any danger to the man-made structures due to the low value of average subsidence, below 0.5 cm/year. Geologically, M-30 tunnel in Madrid city is located in the tertiary Madrid basin with
dominated by intermediate Miocene and evaporitic sediment (Sillerico et al, 2015).
Compared to other study areas which are the urban area with dominated by alluvial deposits have showed the similarity in Jakarta case. The subsidence behavior in MRT Jakarta cumulatively was -1 cm to -4 cm/year. Thus, the numerous of buildings and soil characteristics continuously contributed to the displacement on the tunnel area. Accordingly, excavation does not directly give impact to surface displacement. However, it would increase the velocity of land subsidence in particular area. In case of tunneling project in MRT Jakarta can surely be seen in Figure 4.6 which showed the subsidence time series at the selected PS points.
This research the highlight of Sentinel 1A and ALOS-2 for monitoring the ground subsidence of the first MRT underground excavation, by applied PSInSAR have been processed with SARPROZ, in a dense city like Jakarta. The result reveals the useful of PSInSAR to
measure the time series displacement. SAR satellite imagery is useful for monitoring the displacement of the first tunnel construction in Jakarta. The Persistent Scatterer Interferometry Synthetic Aperture
(PSInSAR) was applied to measure the land subsidence. Conventional surveying methods can be costly higher than utilizing satellite imagery with same coverage area. In addition, ground validation data have given great agreement with PSInSAR measurement and the result’s provided detail historical deformation that has occurred on the ground’s surface. In this research, the behavior of land subsidence is clearly seen during 2014 – 2016 by Sentinel 1A (before tunnel excavation) and 2016 – 2019 by ALOS-2 (during and after construction). The rate of ground motion is slightly decline. However, after tunnel excavated, the rate of land subsidence increased rapidly until MRT officially operated. The ground subsidence in CP 104 – CP 105 is reached to -4.7 cm/year and CP 106 is -7.3 cm/year. It can be concluded that the underground work did not given a direct impact to the ground’s surface, yet the velocity of land subsidence increased.
REFERENCE
Abidin, H.Z., Andreas, H., Djaja, R. 2007. Land subsidence characteristic of Jakarta between 1997 and 2005, as estimated using GPS surveys. GPS Solut. 12:23-32. DOI
10.1007/s10291-007-0061-0
Abidin, H.Z., Andreas, H., Gumilar, I., Brinkman J J. 2015. Study on therisk and impacts of land subsidence in Jakarta. Proc IAHS 372, 115-120.
DOI:10.5194/piahs-372-115-2015.
Abidin, H.Z., Andreas, H., Gumilar, I., Fukuda, Y., Pohan, Y.E. 2011. Land Subsidence of Jakarta (Indonesia) and its Relation with Urban Development. Natural Hazards, 59: 1753–1771.
Abidin, H.Z., Andreas, H., Hutasoit, L.M., Gamal, Mai. 2008. Land Subsidence
Characteristics of the Jakarta Basin (Indonesia) as estimated from Leveling, GPS, and InSAR and its Relation with Groundwater
Extraction. Proceedings of 36th IAH Congress. Toyama, Japan, October 2008.
Acquisition Modes. [Cited 2020 July 10].
Available from: URL:
https://sentinel.esa.int/web/sentinel/u ser-guides/sentinel-1-sar/acquisition-modes.
ALOS-2 Project/PALSAR-2. {cited 2020 July 10]. Available from: URL: https://www.eorc.jaxa.jp/ALOS-2/en/about/palsar2.htm.
Andreas, H., Abidin, H.Z., Sarsito, D.A., Pradipta, D. 2019. The investigation on high-rise building tilting from the issue of land subsidence in Jakarta City. MATEC Web of Conference. DOI: http://doi.org/10.1051/mateconf/2019 27006002
Bayuaji, L., Sumantyo, J.T.S., Kuze H. 2010. ALOS PALSAR D-InSAR for land subsdidence mapping in Jakarta, Indonesia. Center of Remote Sensing Chiba University. 36: 1-8. Available from: URL: http://pubservices.nrc-cnrc.ca/cjrs
Berapa kepadatan penduduk DKI Jakarta saat ini, 2020, [cited 2020 June 29]. Available from: URL:
http://statistik.jakarta.go.id/berapa-kepadatan-penduduk-dki-jakarta-saat-ini/. (In Bahasa Indonesia)
Cambell, J.B., Wynne, R.H. 2011. Introduction to remote sensing (5th edition). New York: The Guilford press.
Chaussard, E., Amelung, F., Abidin, H.Z., Hong, S. 2013. Sinking Cities in Indonesia: ALOS PALSAR detectes rapid subsidence due to groundwater and gas extraction. Remote Sensing of Environment. 128(150-161).
Conte, S.D., Falomi, G., Banwell, M J., Giannico, C., Koudogbo, F., 2018. Satellite InSAR monitoring in urban tunneling projects. Tunneling and Trenchiess Confrence.
Crosetto, M., Monserrat, O., Cuevas-González, M., Devanthéry, N. & Crippa, B. 2016. Persistent scatterer interferometry: A review. ISPRS
Journal of Photogrammetry and Remote Sensing, 115, 78-89.
Djaja, R., Rais, J., Abidin, H.Z., Wedyanto, K. 2004. Land Subsidence of Jakarta Metropolitan Area. 3rd FIG Regional Confrence. Jakarta, Indonesia, 3-7 October 2004
Du, 2018. Correlating the subsidence pattern and land use in Bandung, Indonesia with both Sentinel-1/2 and ALOS-2 satellite images
Feidas, H. 2010. Validation of Satellite Rainfall Products Over Greece. Theoretical and Applied Climatology 99 (2010): 193–216.
Ferretti, A., Monti-Guarnieri, A., Prati, C. & Rocca, F. 2007. InSAR
principlesguidelines for SAR interferometry processing and interpretation. Noordwijk: European Space Agency (ESA)
Ferretti, A., Prati, C., Rocca, F. 2001. Permanent Scatterer in SAR Interferometry. IEEE Transactions on Geoscience and Remote Sensing. Vol. 39, No. 1.
Fryksten, J. 2019. “Study on ongoing subsidence in Uppsala City using Sentinel-1 radar data” (thesis). Sweden: University of Gävle
Ge, L., Ng, A.H.-M., Li, X., Abidin, H.Z., Gumilar, I. 2014. Land subsidence characteristics of Bandung Basin as revealed by ENVISAT ASAR and ALOS PALSAR interferometry. Remote Sens. Environ. 154, 46–60.
Giao, P.H., Hue, V T., Han, N.D., Anh, N.T.H., Minh, N.N. 2018. Land subsidence prediction for a new uran mass rapid transit line in Hanoi. Underground Space.
https://doi.org/10.1016/j.undsp.2018. 11.002
Hanssen, R.F. 2001. Radar interferometry: data interpretation and error analysis. Vol. 2. Dordrecht: Springer
Netherlands.
Harun, A.N., Kassim, M. R. M., Mat, I., & Ramli, S. S. 2015. Precision irrigation using wireless sensor network. International Conference on Smart Sensor and application (ICSSA). 71-75. IEEE
10.1109/ICSSA.2015.7322513
Hirose, K., Abidin H Z. 2001. Land subsidence detection using JERS-1 SAR Interferometry. Available from: URL: https://www.researchgate.net/publicat ion/252582242
Hutabarat, L.E., Ilyas, T. 2017. Mapping of land subsidence induced by groundwater extraction in urban areas as basic data for sustainability countermeasures. International
Journal of Technology, (2017):6,
1001-1011. ISSN 2086-9614. DOI: https://doi.org/10.14716/ijtech.v8i6.7 54
Japan Association on Remote Sensing. 1996. Remote Sensing Note. Tokyo
Joseph, G. 2005. Fundamentals of Remote Sensing Second Edition. India: Universities Press
Koudogbo. F., Urdiroz, A., Robles, J.G, Chapron, G., Lebon, G., Fluteaux, V., Priol, G. 2018. Radar interferometry as an innovative solution for monitoring the construction of the Grand Paris Express metro network – First Result. World Tunnel Confrenece. Dubai, 2018.
Land Subsidence. 2020. [cited 29 June 2020]. Available from: URL:
https://www.usgs.gov/mission-areas/water-resources/science/land-subsidence?qt-science_center_objects=0#qt-science_center_objects
Lauknes, T.R. 2010. ‘Rockslide Mapping in Norway by Means of Interferometric SAR Time Series Analysis’. (dissertation). Northern Norway:
University of Troms 0
Moe, I.R.,Kure, S., Januariyadi, N.F., Udo, K., Kazama, S., Koshimura, S. 2016. Effect of land subsidence on flood inundation in Jakarta, Indonesia. Journal of Japan Society of Civil Engineering. 72: 283-289. DOI:
10.2208/jscejer.721_283.
Ng, A.H., Ge, L., Li, X., Abidin, H.Z., Andreas, H., Zhang, K. 2012. Mapping land subsidence in Jakarta, Indonesia using persistant scatterer interferometry (PSI) technique with ALOS PALSAR. International Journal of Applied Earth Observation and Geionformation. 18:232-242.
DOI:10.1016/j.jag.2012.01.018
Osmanoglu, B., Dixon, T.H., Wdowinski, S., Cabral-Cano, E., Jiang, Y., 2010.
Mexico City subsidence observe with persistent scaterer INSAR.
International Journal of Applied earth Observation and
Geoinformation, 13 (1), 1-12.
Penggunaan air tanah di DKI Jakarta meningkat di tahun 2019. 2020.
[cited 29 June 2020]. Available from: URL: http://statistik.jakarta.go.id/pengguna an-air-tanah-di-dki-jakarta-meningkat-di-tahun-2019/
Perrissin, D., Wang, Z., Lin, H. 2012. Shanghai subway tunnels and highways monitoring through Cosmo-SkyMed Persistent Scatterers. Journal of Photogrammetry and Remote Sensing, 73, 58-67.
Sillerico, E., Ezquerro, P., Marchamalo, M., Herrera, G., Duro, J., Martinez, R. Monitoring ground subsidence in urban environments: M-30 tunnels under Madrid City (Spain). Ingeniería e Investigación. 32(5).
DOI: http://dx.doi.org/10.15446/ing.investi g.v35n2.46614
Traffic index ranking. 2020. [cited 2020 29 June]. Available from: URL:
https://www.tomtom.com/en_gb/traff ic-index/ranking/
What is remote sensing. 2020. [cited 2020 7 June]. Available from: URL:
https://oceanservice.noaa.gov/facts/re motesensing.html
Widodo, J., Herlambang, A., Sulaiman, A., Razi, P., Yohandri., Perrisin, D., Kuze, H., Sumantyo, J.T.S. 2019. Land subsidence rate analysis of Jakarta Metropolitan Region based on D-InSAR processing od Sentinel data C-Band frequency. Journal of Physics. 1185 (2019) 012004. DOI: 10.1088/1742-6596/1185/1/012004
200
Discussion and feedback