STUDY OF INTERNAL SOLITARY WAVES FEATURE EXTRACTION BASED ON STATIONARY WAVELET TRANSFORM BY SENTINEL-1A IMAGE IN LOMBOK STRAIT
on
Study Of Internal Solitary Waves Feature Extraction Based On Stationary Wavelet Transform...
[Chonnaniyah,dkk.]
STUDY OF INTERNAL SOLITARY WAVES FEATURE EXTRACTION BASED ON STATIONARY WAVELET TRANSFORM BY SENTINEL-1A IMAGE IN LOMBOK STRAIT
Chonnaniyah1,2*), Takahiro Osawa2), I Wayan Gede Astawa Karang3) 1)Graduate Study of Environmental Science, Udayana University
2)Center for Remote Sensing and Ocean Science (CReSOS) Udayana University 3)Faculty of Marine Science and Fisheries, Udayana University
*Email: chonnaniyah.unud@gmail.com
ABSTRACT
Stationary Wavelet Transform (SWT), mother function Symlet 4, shows an effective method for Internal Solitary Waves (ISW) feature extraction and four parameters (soliton numbers, first crest length, wavelength and propagation direction) estimation by Sentinel-1A C-band Synthetic Aperture Radar (SAR) imagery in Lombok Strait.The ISW feature can be distinguished from other features using the SWT noise reduction process and simple thresholding methods. ISW feature extraction results by SAR images can show ISW characteristics more clearly and can be used as a basis for obtaining ISW spatial-temporal distribution maps in the Lombok Strait.Our estimation results show that the arc-like type of ISW in the Lombok Strait propagated to the north of the sill with the detected soliton numbers are 2 solitons per packets with a wavelength about 3.20 km and the first crest length varies about 60.27 km near the Kangean Island with the propagation direction about 50.38 degree to the North.
Keywords: feature extraction, Internal Solitary Waves (ISW), Lombok Strait, Sentinel-1A, Stationary Wavelet Transform (SWT)
Internal wave (IW) is a phenomenon that occurs in the oceans beneath the sea surface. This wave is very important to study because it can affect several processes in the oceans and coastal areas. IW is generated by the interaction of the strong current flowing over the rough topography at thebottom of the sea. IWs can propagate up to several hundred kilometers transporting mass and momentum. The IWs manifestation of IWs can be seen at sea surface because of variations in surface currents induced by IWs activity below the surface which then modulates the sea surface roughness. IWs signatures at the sea surface are often detected by satellite imagery, both optical and radar imagery. Radar is the most effective technology for detecting and monitoring of IWs in the ocean. Synthetic Aperture Radar (SAR) is one of the most
commonly used instruments for detecting IWs, this is because SAR has the ability to detect small changes in roughness that occur at sea surface.
IWs which has a large amplitude and nonlinear properties are often known as Internal Solitary Wave (ISW). ISW that appear at sea surface usually have group characteristics or in a packet of oscillations, with the cycle numbers varying up to several dozen, depending on the age and the distance from the generation site. SAR’s backscatter over the ocean are mainly due to the roughnes of the sea surface roughness. The higher the sea surface roughness, the higher is the radar backscatter and the brighter is the image intensity. ISW is very easily distinguished from other phenomena in the ocean based on geometric structure and shape. Visible wave packets are usually characterized by several dominant features. The ISW amplitudes are rank-ordered, with the largest at the front of
the packet and the smallest at its rear; the wavelengths and the crest lengths are also rank-ordered, with the longest waves again at the front of the group (Apel, 2002). ISW signatures observed in SAR imagery are a series of alternating light/dark linear or curvilinear bands that represent the crests and troughs of the waves (Apel, 2004).
SAR is an effective method that can be used for ISW monitoring because it operates in all weather, day and night operation and a wide range of up to 250 km.Sentinel-1 is an advanced mission instruments C-band operation of the satellites European Remote Sensing (ERS) 1/2 have a better temporal resolution than previous missions. Sentinel-1 SAR images are open access and offer unlimited access. The rapid development of SAR technology and commercial operational SAR available, the exponential growing mount of SAR data urge us to find a faster and automatic method to screen SAR IWs images and extract IWs features automatically in SAR image.
The main interest of image processing using SAR imagery is the existence of speckle noise, which is usually scattered with bright and dark spot. Traditional image filters tend to smooth out the noise while blurring the important features in the image. De-noise method based on wavelet has the advantage of preservation capabilities derived from localization ability wavelet function. He (2006) applied the Stationary Wavelet Transform (SWT) to calculate image gradient info and obtain the detected edge as ISW feature. This algorithm can be implemented easily and effectively for ERS 1/2.
Lombok Strait has intensive characteristic of the ISWs generation, ISW in the Lombok Strait were generated in stratified water by tidal flows over the sill area (Susanto et al., 2005). The use of SAR imagesto detect the generation and characteristics of IWs in the Lombok Strait area has been observed in several recent studies (Karang et al., 2012; Mitnik et al., 2000; Susanto et al., 2005). Following the He's algorithm (2006), this study applies SWT on Sentinel-1A images in Lombok Strait as a method for extracting ISW features. The purpose of this research is to find out the most effective type of SWT function as a mother function in the 30
IWs feature extraction process. Feature extraction results are then used to estimate several ISW parameters to determine ISW dynamics in the Lombok Strait using Sentinel-1A imagery.
Sentinel-1 is the result of a joint initiative between European Space Agency (ESA) and Copernicus that launched two similar satellites, Sentinel-1A and followed by Sentinel-1B, which has a 180-degree difference in orbit. Sentinel-1A is the first mission that launched on April 3, 2014 and the second mission, Sentinel-1B, was launched on April 25, 2016. Each satellite has a revisi time about 12 days (or a repeat cycle) and 175-orbit per cycle. By operating both satellites in the orbit, global revisit time will be 6 days.At the equator, revisit time is 3 days and less than 1 day above the Arctic. Sentinel-1 satellite is equipped by C-band SAR operating at 5405 GHz center frequency and angle of incidence of 200 - 450. These include the right-shaped active array antenna that provides fast scanning for the elevation and azimuth, the data storage capacity of 1 downlink capacity of 410 Gb and 520 Mbit / s X-band. Sentinel-1 has been designed for a minimum life span of 7 years in orbit.
Sentinel-1 has four operating modes: an interferometric wide mode, a wave-mode, a stripmap mode and an extra wide-swath mode. Sentinel-1 data Level-1 product distributions are divided into two types, Single Look Complex (SLC) and Ground Range Detected (GRD). Level-1 SLC products are focused SAR images, which uses orbit and attitude data from satellites for georeference processes, and conducted in slantrange geometry. Level-1 GRD products are detected SAR images and also focused, multilooked and an Earth ellipsoid model used for projecting the ground range. Phase information is missing. The product result has around a square resolution pixel and the square pixel distance with speckle is reduced by the cost of reducing geometric resolution. Theground range projected by the azimuth
surface will produce a Sentinel-1 GRD ground range and flight direction (Table 1). Product, with coordinates oriented along the
Table 1. Sentinel-1 Operational Products (Topouzelis and Singha, 2017)
|
Acquisition Mode |
Resolution Resolution Pixel Spacing ENL Swath Class (Rz x Az) (m) (Rz x Az) (m) (km) |
|
SM (stripmap mode) |
FR 9 x 9 4 x 4 3.9 HR 23 x 23 10 x 10 34.4 80 MR 84 x 84 40 x 40 464.7 |
|
IW (interferometric wide swath) |
HR 20 x 22 10 x 10 4.9 250 MR 88 x 89 40 x 40 105.7 |
|
EW (extended interferometric wide swath) |
HR 50 x 50 25 x 25 3 400 MR 93 x 87 40 x 40 12 |
Az: azimuth, ENL: equivalent number looks, FR: full resolution, HR: high resolution, MR: medium resolution, Rz: range
Wavelet is an effective limited duration waveform that has a zero average value. Wavelet is a base. The basis of wavelets comes from the scale function. The scaling function has properties that can consist of the number of copies that have been expanded, translated, and scaled. This function is a derivative functio of the dilation equation, which is the basic theory of wavelets. The mother's wavelet equation is as follows(Misiti et al., 2009):
∫ψ(t) e-2iπωtdt = 0 i = 0,∙∙∙, n (1)
Function ψ has a zero integral and oscillates taking positive and negative values. This function also orthogonal to the polynomials of a degree lower or equal to n, that controls the oscillations of ψ. The larger n, the more ψ oscillates.The translation and dilation of wavelet equation is as follows(Misiti et al., 2009):
-
/ \ 1 (t - b ^
Ψa,b (t) = T^ II (2) √ a < a J
Wavelet comparison with sine waves, which is the basis of Fourier analysis, are the duration time. Sine waves are not limited in long-time, they extend from minus to infinite plus.
Wavelet is an irregular and asymmetrical function. Wavelets have several mother functions that make them flexible to various signals to be transformed. Some types
of wavelet functions are then called wavelet families. Here some wavelet family that has proven very useful included in Matrix Laboratory (MATLAB) wavelet toolbox (Misiti et al., 2009) from the simplest functions: Haar, Daubechies, Coiflets, Biorthogonal, Symlets, Morlet, Mexican Hat and Meyer.Wavelet transforms have the ability to analyze locally the fluctuations in grayscale levels of images. Wavelet allows for extracting new image that can isolate the edges. Applications of wavelet transforms in image processing are often same with analysis, de-noising and compression.
The Stationary Wavelet Transform (SWT) is an alternative implementation of the discrete wavelet transform, in which the down-sampling stage at each scale is replaced by an up-sample of the filter before the convolution. SWT presented by Nason and Silverman (1995), which is widely used for the image processing and gave the decomposition and reconstruction algorithm of the SWT. They implement high and low-pass filter corresponding to the data signal at every level to produce two sequences at the next level. The output of the down-sampling filter is not so for two new sequences each having the same length as the original sequence. Instead, the modified filter at every level by coating with zero. Thus the representation is not excessive and the number of samples in the representation equal to the total number of image pixels.
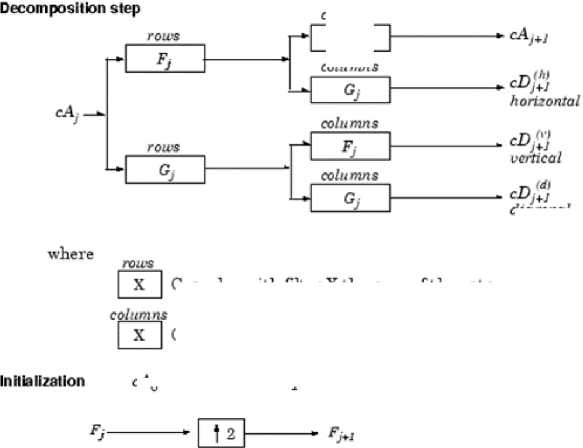
For images (two-dimensional cases), the algorithmis almost similar to one-dimensional
cases.Inthe case of two dimensions, the scale function used is the same function as the onedimensional case. It's just that in the twodimensional case using the decomposition method that divides the image into 4
components: the approach at level j + 1, and the signal detail (high frequency signal) in three orientations (horizontal, vertical, and diagonal). The basic decomposition step for the image shown in Figure 1.
Two-Dimensional SWT
columns
columns
diagonal
where
Initialization Fg = Lo_D
Gi
σ,
Convolve with filter X the rows of the entry
Convolve with filter X the columns of the entry
cAq = s for the decomposition initialization

Upsample
12
Initialization Gg = Hi_D
Note size(cAj) - sizc(cD'^) - size(cD'l'1) - sizclcD^I - s where s - size of the analyzed image
-
Figure 1.
Basic decomposition step for SWT (Mathworks, n.y)
In this study, the SWT was used as a method to isolate detected ISW features on Sentinel-1A imagery in the Lombok Strait area. ISW feature extraction process in this research is divided into three steps. The first step is pre-processing, which is the initial stage for SAR image processing. The preprocessing process includes radiometric calibration, geometric correction, speckle filter and land-sea mask also used to dispose of land data so that the extraction process focuses only in the oceans. The next stage is the de-noising process that is processed after the image is transformed using SWT. The result of this de-noising process will be used as the input image at the ISW feature extraction next step. ISW feature extraction process uses gradient operator to detect 32
changes in the pixel value of the image. The final step of the extraction process is a mathematical morphological process that serves to separate ISW features in the form of lines with small objects that are also extracted. The ISW feature extraction method is described in Figure 2.
Studies of the evolution, parameters and propagation of the IWs is an important mechanism to determine the hydrodynamics of the Lombok strait. Estimation of several parameters (soliton numbers, first crest length, wavelength and propagation direction) has been analyzed in this study. Calculation of the soliton number calculated by analyzing the extracted images. The number of arcs and extracted lines is the number of solitons that represent a bright peak. First crest (leading
soliton) is the soliton that is at the front in one package and usually has the brightest intensity of the other solitons. The length of the first crest is measured by the distance between the two brightest ends of the soliton. Calculation of the soliton wavelength in one package is an estimation of the distance between two adjacent solitons. The wavelength in one packet decrease from the front to the rear.
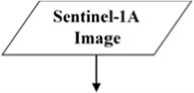
Image Pre-processing
Stationarj Wavelet Transform
Uaar Daubechies Svmlct
De-noising Image
I
Image Post-processing
(Morphological Process)
ISW Feature Fxtraction Result
-
Figure 2.
Research flowchart
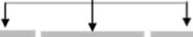
Based on the method estimation of ISWs propagation direction by Gao et al., (2008), the partial propagation direction of ISW are extracted. To calculate the propagation direction, sketched in the Figure 3.The wave crest illustrated with curves AB, C is the center point of the line AB, line CD is perpendicular to line AB, a is the angle between the propagation direction and the North direction. The first step, drawing a line (AB) between the two end points of the wave crests. Step two, get the center point (C) of a line (AB), and the image of the transect line through the center point perpendicular to connect two endpoints (CD). And the transect line is drawn parallel to the direction of ISW propagation. The angle between the transect and north lines is the direction of ISW propagation (a).
Figure 3.
ISW propagation direction extraction sketch
Software that was used in this study are the Sentinel Application Platform (SNAP) and MATLAB R2016. SNAP is used to process the images downloaded from the web to get the image that has been calibrated and corrected well as input subsequent image processing. SNAP software that used has been equipped with Sentinel-1 toolbox so it can be used as a Sentinel-1 image processor. MATLAB R2016 is used to process the output image of the SNAP process. The Wavelet toolbox was used as a tool for the wavelets transform analysis and decomposition. Image enhancement and morphological process also used the Image Processing Toolbox to get the ISWs feature.
This research conducted in Lombok Strait area. Lombok Strait is an important pathway in the process of trans-oceanic water mass transport. The current that crosses Indonesian waters is known as Indonesian Throughflow (ITF) which played a role in the transfer of warm water masses from the Pacific Ocean to the Indian Ocean annually. In shallow waters between the Nusa Penida and Lombok islands, there is a sill that has a depth of less than 350 meters. Together with a large tidal current, Lombok Strait has intensive characteristic of the IWs generation.
The use of SAR images for IWs detection and characteristics in the Lombok Strait area has been presented in several recent studies. Karang and Nishio (2011) describes some results on the IWs and other oceanic features in the Lombok strait using Advanced Land Observing Satellite Phased Array L-band Synthetic Aperture Radar (ALOS PALSAR) imagery, parameters of
IWs such as wavelengths, crest length and type of modulation were estimated from the images. The distribution of IWs in the Lombok Strait area has been studied by screening the combnation of optical and radar images, ALOS PALSAR images and Satellite Pour l’Observation de la Terre (SPOT) images, for sea-surface signatures of IWs(Karang & Nishio, 2012). Matthews et al., (2011) has investigated the characteristics of IWs in Lombok strait in relation to the monsoon regulation using satellite imagery and numerical modelling then introduced two basic wave types were identified in Lombok Strait, which are often called arc-like IWs that spread to the northern part of the strait and the IWs irregular spreading in the southern part of the strait.
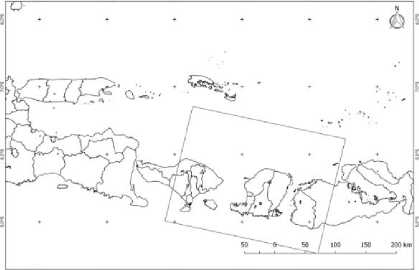
The selection location is determined from the swath availability from Sentinel-1A data. For the area of study, it takes from Sentinel-1A image scenes for the descending orbit about 250 km swatch width around Lombok Strait area. Interferometric Wide swath mode has been used in this study that obtained data at spatial resolution about 5 x 20 m. This mode records targets in three subswaths using Terrain Observation with Progressive Scans SAR (TOPSAR). This technique can produce homogeneous image throughout the swath. The swath range (Figure 4) is suitable for the IWs monitoring over the Lombok Strait area (114.96o – 117.43oE and 7.53o – 9.16oS). IHOV IMOV UMV IUH UMV IILOV
IiLOt uιn met ιr 11 uι,zt
Figure 4.
Research location. The red box is the Sentinel-1A frame.
Feature extraction and observation of ISWs in the Lombok Strait was studied with the usage of Sentinel-1A images. This data can be downloaded from the Copernicus website (https://scihub.copernicus.eu/). Descending orbit data acquired on December 2, 2017, at 21:52 UTC and February 5, 2017 at 21:53 UTC has been used in this study. The polarization used is Vertical-Vertical (VV) on GRD product type and Interferometric Wave sensor mode.
Satellite SARs have become the most-important sensors for observing ocean internal waves, being capable of day-night, allweather observations with a wide range monitoring. Many researchers are using the SAR as a tool to study the characteristics and dynamics of IWs almost all over the world. Sentinel-1, a new technology launched by ESA as a follow-up mission ERS 1/2, is a potential tool for monitoring the activities of IWs. With a 12-day temporal resolution, it will make the frequency of observation more intensive. Sentinel-1 carries a C-band instrument that can operate in all weather conditions.
In SAR images, visible bright and dark lines associated with the IWs. IWs cause divergent and convergent patterns currently below sea surface. In these convergent places the currents unite and cause rough sea surfaces. Rough seas from relatively high surface waves reflect more light then calm seas. This is seen as a bright band in the SAR image. If the sea is calm there is almost no light reflected from the satellite (absorbed) and this causes the dark band on the SAR image. Thus the interaction between sea surface waves and currents due to IWs can be seen in the SAR image.
(a)
(c)
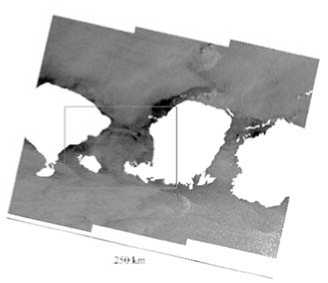
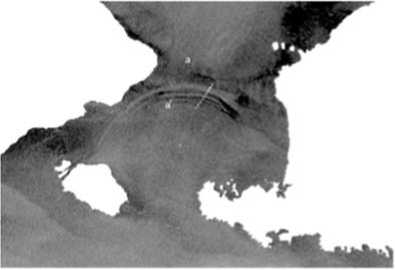
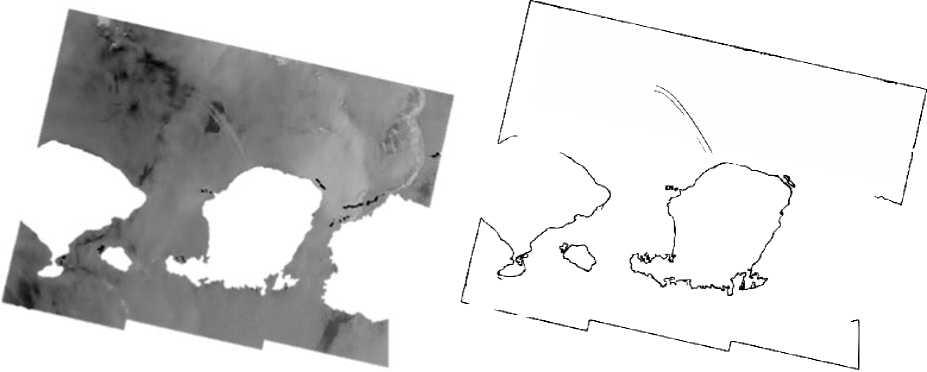
Figure 5.
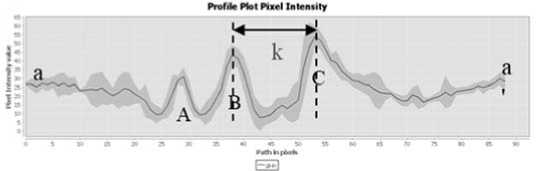
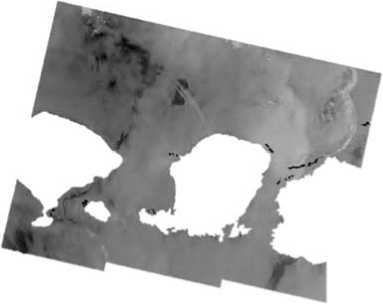
(a) Sentinel-1A image acquired on February 5, 2017 at 21:53 UTC; (b) enlarge the image section in the red box in (a); and (c) profile plot of radar backscatter (sigma0) along transect a-a’ indicated by white line in (b)
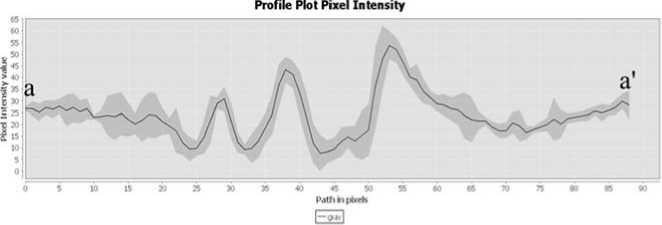
Figure 5 presents a clear radar signature of ISW arc-like in the Lombok Strait. ISW signatures in this image have a bright front signature against a darker sea. The radar backscatter (sigma0) normally stronger in the front of the wave train (with respect to the propagation direction) as expected due to dispersion effect. On the graph of Figure 5 (c) clearly 3 solitons can be discovered by 3 peaks (A-C) plot intensity values. The wavelength can be estimated by calculating the distance between two consecutive peak (k) in Figure 5 (c). Estimated wavelength in this image is about 2.02 km.
Radar signature of ISW feature extraction base on SWT process has been carried out by Sentinel-1A on the descending
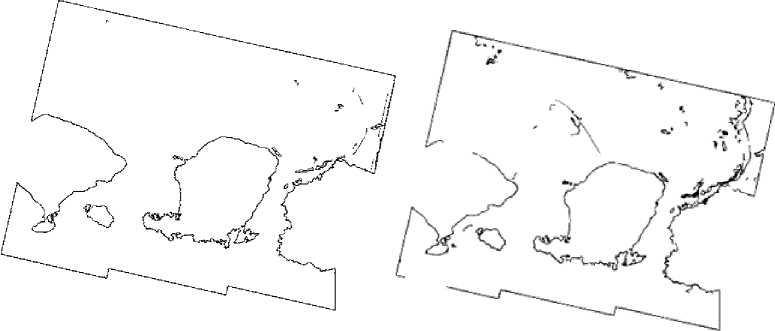
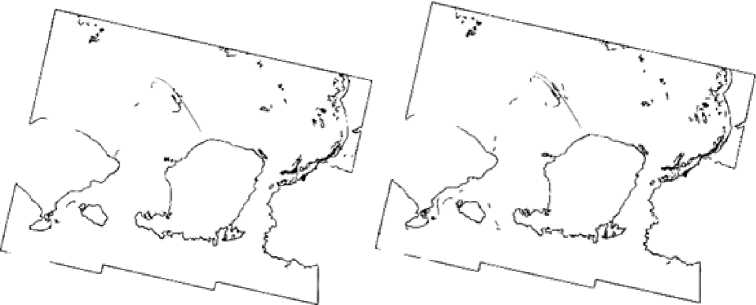
orbit with the strong radar signature of ISW in the Lombok Strait area shown in Figure 6. This Sentinel-1A image from the Lombok Strait, 3008 x 2528 pixels in size, that cover an area about 250 km and recorded on December 2, 2017 is used as a first test image. In this figure, we can observe the large ISW packet along with radar backscatter possibility of tropical rain cells and dark spots because of the wind conditions. Figure 6 (a) shows an original image after pre-processing, Figure 6(b) shows an image extraction result without wavelet transform and Figure 6(c) is the extracted image through the transformation process using the simplest wavelet function.
Figure 6 shows the effect of wavelet transformation on feature extraction results. The transformation process using wavelet will isolate signals that have similar morphology with the selected wavelet function.
(a)
(b) (c)
Figure 6.
Sentinel-1A image acquired on December 2, 2017, at 21:52 UTC at the Lombok Strait. (a) Original image, (b) extraction result without wavelet transform and (c) extraction result based on stationary wavelet transform
(a)
(b) (c) (d)
Figure 7.
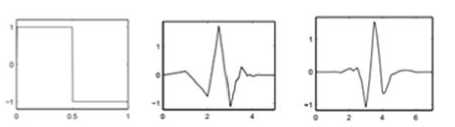
(a) Profile plot of ISW radar backscatter (sigma0) by Sentinel-1A in Figure 5.2; and wavelet function of (b) Haar; (c) Daubechies 3; (d) Symlet 4
Study of the effectiveness from performed to obtain the best wavelet
different wavelet functions is also function in detecting ISW features. The
Haar, Daubechies 3 (db3) and Symlet 4 (sym4) wavelet functions are the most similar functions to the ISW backscatter
signal morphology (Figure 7). The comparison results of these three processes are presented in Figure 8.
(a) (b)
(c)
Figure 8.
Extracted feature results: using (a) Haar, (b) Db3 and (c) Sym4 wavelet function phenomena based on the geometrical structure
The results of this extraction process still contains other ISW signatures, an recognation algorithm based on a geometrical structure and the shape of ISW patterns. The main oceanic phenomenon observed in SAR images are ship,rain cells, eddies, fronts, atmospheric waves and oil slicks. Oil slicks seen as a dark covered area in the SAR images. Fronts, as a different temperature confluence area, are defined as a single quasilinear bright lines. Eddies are seenas dark spiral form. Therefore, we have applied this basic knowledge about the geometrical structure and the shape of ISW in our recognition algorithm to be able to discriminate IWs features from IWs-likes.
Alpers et. al. (2011) present some criteria to discriminate IWs from other
and the shape of the radar backscatters.
-
1) ISW packet seen as a bright line on the radar image. The bright line is the starting line that followed by dark line (first crest soliton) which is then repeated continuously behind the line of diminishing intensity behind.
-
2) ISW packet located in a marine area that has the characteristics of a stratified waters, have an irregular topography and have strong currents.
-
3) Ineach packet, the distance between adjacent soliton is in the range of 15 to 120 km.
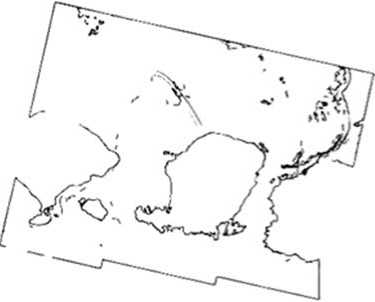
The final result of the ISW extraction process using the sym4 wavelet function is presented in Figure 9.
(a) (b)
Figure9.
(a) Result of SWT and de-noising process using sym4 function level 5, (b) final result of ISW feature extraction
Our estimation results show that the arc-like type of ISW in the Lombok Strait propagated to the north of the sill with the detected soliton numbers are 2 solitons per packets with a wavelength about 3.20 km and the first crest length varies about 60.27
km near the Kangean Island with the propagation direction about 50.38 degree to the North (Figure 10). This estimation result agrees well with those investigated by Susanto et al. (2005), Ningsih et al. (2008), and Matthews et al. (2011).
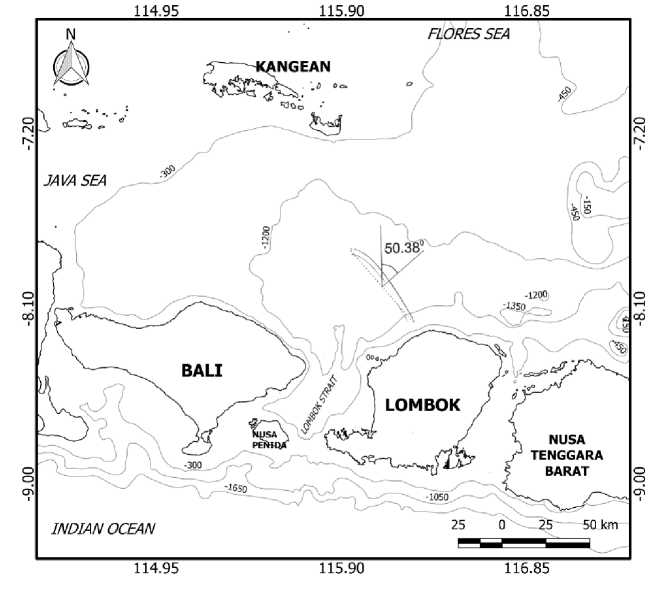
Figure 10.
Result of propagation direction calculation of ISW feature extraction by Sentinel-1A imageacquired on December 2, 2017, at 21:52 UTC at the Lombok Strait
The Stationary Wavelet Transform (SWT), Mother function Symlet 4, shows an effective method for Internal Solitary Waves (ISW) feature extraction and several parameters (soliton numbers, first crest length, wavelengthand propagation direction) by Sentinel-1A in Lombok Strait. ISWs packet (characteristic) can be distinguished from other phenomena based on their geometrical structure and shape. Our estimation results show that the arclike type of ISW in the Lombok Strait propagated to the north of the sill with the detected soliton numbers are 2 solitons per packets with a wavelength about 3.20 km and the first crest length varies about 60.27 km near the Kangean Island with the propagation direction about 50.38 degree.
REFERENCES
Alpers, W., Member, S., & Huang, W. 2011. On the Discrimination of Radar Signatures of Atmospheric Gravity Waves and Oceanic Internal Waves on Synthetic Aperture Radar Images of the Sea Surface, IEEE Transactions on Geoscience and Remote Sensing, 49(3), 1114–1126.
Apel, J. R. 2002. ‘Oceanic Internal Waves and Solitons’, in an Atlas of Oceanic Solitary Waves. Global Ocean Associates, Prepared for the Office of Naval Research –Code 322, pp. 1–40.
Apel, J. R. 2004. ‘Oceanic Internal Waves and Solitons’, in Jackson, C. S. (ed.) Synthetic Aperture Radar Marine User’s Manual. Washington DC.: NOAA/ NESDIS, pp. 189–206.
Gao, Q., Dong, D., Yang, X., Husi, L., & Shang, H. 2018. Himawari-8 Geostationary Satellite Observation of the Internal Solitary Waves in The South China Sea. In The International Archives of the Photogrammetry, Remote Sensing and Spatial Information Sciences (Vol. XLII, pp. 7–10). Beijing, China.
He, Ming Xia, Chen, H., Guo, L., Zhuang, X.,
and Li, H., 2006. Internal Wave Extraction in SAR Oceanic Surface Image Based on Stationary Wavelet Transform. Proc. 2005 Dragon Symposium “Mid-Term Results”, Santorini, Greece.
Karang, I. W. G. A., &Nishio, F. 2011. Internal waves in the Lombok Strait revealed by ALOS PALSAR images. Proc. IEEE International Geoscience and Remote Sensing Symp. IGARSS 2011. Vancouver, Canada. pp. 253-256.
Karang, I. W. G. A. &Nishio, F., 2012. The Distibution of Internal Waves in The Lombok Strait Area Studied by MultiSensor Satellite Images. UniversitasUdayana Repository.
Karang, I. W. G. A., Nishio, F., Mitnik, L., &Osawa, T. 2012. Spatial-Temporal Distribution and Characteristics of Internal Waves in the Lombok Strait Area Studied by Alos-Palsar Images. Earth Science Research, 1(2), 11–22.
Mathworks, n.y.Nondecimated Discrete Stationary Wavelet Transforms (SWTs). https://www.mathworks.com/help/wavel et/ug/discrete-stationary-wavelet-transform-swt.html. [Accessed 22 March 2017].
Matthews, J. P., Aiki, H., Masuda, S., Awaji, T., & Ishikawa, Y. 2011. Monsoon regulation of Lombok Strait internal waves. Journal of Geophysical Research: Oceans, 116(5), 1–14.
https://doi.org/10.1029/2010JC006403.
Misiti, M., Misiti, Y., Oppenheim, G., & Poggi, J.-M. 2009. Wavelet Toolbox TM 4 User’s Guide. The MathWorks Inc.
Mitnik, L., & W. Alpers. 2000. Sea surface circulation through the Lombok Strait studied by ERS SAR. Pp. 313–317 in Proceedings of the 5th Pacific Ocean Remote Sensing Conference (PORSEC 2000), Vol. I, 5-8. Dec 2000, Goa, India.
Mitnik, L. M. 2008. Advanced land observing satellite palsar observations of the oceanic dynamic phenomena in the coastal zone. International Geoscience
and Remote Sensing Symposium (IGARSS), 2(1), 351–354.
https://doi.org/10.1109/IGARSS.2008.47 79000.
Nason, G.P., Silverman, B.W., 1995. The stationary wavelet transform and some statistical applications in wavelet and statistics, Lecture notes in statistics. A. Antoniadis Ed. Berlin: Spinger Verlag, 281-299.
Ningsih, N. S., Rahmayani, R., Hadi, S., & Brojonegoro, I. S. 2008. Internal Waves Dynamics in the Lombok Strait Studied
by a Numerical Model. International Journal of Remote Sensing and Earth Sciences, 5, 17–33.
Susanto, R. D., Mitnik, L. & Zheng, Q., 2005. Ocean Internal Waves Observed in The Lombok Strait. Oceanography, 18(4), pp. 125-132.
Topouzelis, K. and Singha, S. 2017. Oil Spill Detection Using Space-Borne Sentinel-1 SAR Imagery. Oil Spill Science and Technology: Second Edition. Elsevier Inc. doi: 10.1016/B978-0-12-809413-6.00006-0.
40
Discussion and feedback