ESTIMATION OF PRIMARY PRODUCTIVITY FOR TUNA IN INDIAN OCEAN
on
Ecotrophic ♦ 4 (2) : 86 - 91
ISSN: 1907‐5626
ESTIMATION OF PRIMARY PRODUCTIVITY FOR TUNA IN INDIAN OCEAN
Ende Kasma 1), Takahiro Osawa2) and I Wayan Sandi Adnyana 3)
1) Sekolah Menengah Kejuruan Negeri 1 Palabuhanratu, 2) Center for Remote Sensing and Ocean Sciences
3) Master Program of Environment Science Postgraduate Program Udayana University
ABSTRACT
Indonesia has abundant fisheries potency, one of fisheries potency in Indian Ocean is tuna fish. Primary productivity data used as indicator of tuna fisheries potency in Idian Ocean.
Research location is in Indian Ocean 070 - 210 S and 1070 - 1210 E. Weekly satellite data in 2007 used are chlorophyl, sea surface temperature, Photosynthetic Available Radiation (PAR) and euphotic zone (Zeu) data. Daily fisheries data is from tuna fish catching data 2007 in PT. Perikanan Samudera Besar (PT. PSB). Satellite data is processed by Vertically Generalized Production Model (VGPM) formula to obtained primary productivity. Tuna fish catching data correlated to satellite data to know correlation of primary productivity value to fish catching data.
Result of this research is there four species of tuna fish catch in Indian Ocean, that are Madidihang or Yellowfin tuna (Thunnus albacores), Bigeye tuna (Thunnus obesus), Southtern Bluefin tuna (Thunnus macoyii), and Albacore (Thunnus alalunga). Where 73% tuna fish is Bigeye tuna. Bigeye, Albacore and Yellowfin tuna are produced annually, while Southern Bluefin tuna in northwest monsoon is no fish production. Chlorophyll-a, sea surface temperature and primary productivity value in research location are from 0,06 mg/m3 to 0,38 mg/m3, from 24,640C to 31,820C, and from 73,22mgC/m2 to 658,57 mgC/m2 respectively. Coefficient correlation in primary productivity and fish catching in fishing ground area is small (r = 0.008), its explained that, fish catching number is not influenced by primary productivity. In high or low primary productivity condition tuna fish catched in Indian Ocean area. Potential fishing ground area of Bigeye tuna, Albacore, Yellowfin and Southern Bluefin tuna in Indian Ocean are in 110 – 160 S and 1060 – 1210 E, the primary productivity value is from 73 mgC/m2day to 732 mgC/m2day and differences of sea surface temperature value of tuna fish are from 240 C to 310 C, 240 C to 300 C, and 250 C to 310 C for Bigeye tuna, Albacore and Yellowfin tuna, respectively. While Southern Bluefin tuna distribution is in temperature area from 260C to 300 C and primary productivity value is from 92 mgC/m2day to 449 mgC/m2day.
Keywords : Primary productivity, tuna, Vertically Generalized Production Model (VGPM), hook rate, satellite data.
ABSTRAK
Potensi perikanan di Indonesia masih sangat berlimpah, salah satunya adalah potensi perikanan tuna yang terdapat di Samudera Hindia dan belum termanfaatkan secara optimal. Data produktivitas primer perairan dapat digunakan sebagai salah satu indikator untuk memperkirakan sumberdaya perikanan tuna.
Lokasi data penelitian berada di Samudera Hindia dengan koordinat 070 - 210 LS dan 1070 - 1210 BT. Data satelit yang digunakan adalah data satelit mingguan tahun 2007 meliputi data khloropil, suhu permukaan laut, Photosyntetic Available Radiation (PAR), dan data euphotic zone (Zeu). Data perikanan diambil dari data harian hasil tangkapan perikanan tuna PT. Perikanan Samudera Besar Bali pada tahun 2007. Seluruh data satelit diolah menggunakan rumus Vertically Generalized Production Model (VGPM) untuk mendapatkan nilai produktivitas primer perairan. Data hasil tangkapan ikan tuna dikorelasikan dengan data satelit untuk mengetahui hubungan antara nilai produktivitas primer dengan ikan hasil tangkapan.
Berdasarkan hasil penelitian, di Samudera Hindia tertangkap empat jenis ikan tuna yaitu Madidihang/Yellowfin tuna (Thunnus albacores), tuna mata besar/Bigeye tuna (Thunnus obesus), Southtern Bluefin tuna (Thunnus macoyii), dan Albacore (Thunnus alalunga), dimana sekitar 73% total hasil tangkapan adalah jenis tuna mata besar. Tuna mata besar, albacore, dan yellowfin tertangkap hampir sepanjang tahun, sedangkan Southern Bluefin tuna tidak tertangkap pada saat musim timur (northwest monsoon). Nilai khloropil pada daerah penelitian yaitu 0,06 mg/m3 - 0,38 mg/m3, suhu permukaan laut 24,640C - 31,820C, dan produktivitas primer 73,22mgC/m2 - 658,57 mgC/m2. Koefisien relasi antara produktivitas primer dan ikan hasil tangkapan di daerah penelitian sangat kecil (r = 0.008), hal ini berarti bahwa jumlah ikan hasil tangkapan tidak dipengaruhi oleh nilai produktivitas primer perairan. Daerah penangkapan yang potensial untuk ikan tuna mata besar, Albakora, Madidihang, dan Southern Bluefin tuna di Samudera Hindia pada sekitar koordinat 110 – 86
160LS dan 1060 – 1210BT dengan rentang nilai produktivitas primer yang sama yaitu 73 mgC/m2day sampai 732 mgC/m2day, hanya berbeda pada rentang suhu permukaan laut yaitu masing-masing pada suhu 240C-310C (tuna mata besar), 240C-300C (Albacore), dan 250C-310C (Madidihang). Sedangkan untuk Southern Bluefin tuna menyebar pada perairan dengan kisaran suhu 260C-300C dengan nilai produktivitas primer antara 92 mgC/m2day sampai 449 mgC/m2day.
Kata kunci : Produktivitas primer, tuna, Vertically Generalized Production Model (VGPM), hook rate, data satelit.
INTRODUCTION
Background
Tuna fisheries potency is not apparent specifically. Therefore, this media differences can be anticipated by study the tuna fish behavior and application of detected device technology. In this time, this technology can identified tuna fisheries potency location by coastal zone nutrient parameter identification or its coastal zone primary productivity and resulted fishing ground tuna map location.
Pauly and Christensen (1995) describe that there is a high correlation between primary production and fish abundance and also attempt to obtain a more accurate estimate of the primary production required to sustain the world fisheries catches.
All life weather on land or in the sea is based on chlorophyll, the only capable of synthesizing living matter. At sea, this first link in the chain of life is constituted by phytoplankton; microscopic organisms such as diatoms, flageliforms, floating free or grouped carried by the currents. This primary production from the root of the high productivity of various links in the tropic chain which the basis of fishing activities.
Primary production is the production of organic compounds from atmospheric or aquatic carbon dioxide, principally through the process of photosynthesis, with chemosynthesis being much less important. All life on earth is directly or indirectly reliant on primary production. The organisms responsible for primary production are known as primary producers or autotrophies, and form the base of the food chain (Available at http://en.wikipedia.org/ wiki/Primary_production., 2007).
This research is concerned about how to detect the primary productivity using an established mathematical model which the input parameters are derived from satellite data. This research is also concerned about estimating fish productivity using a model and it compared to the fish catch data with variability of environment parameter such as sea surface temperature and chlorophyll-a concentration.
RESEARCH METHODOLOGY
Research Location
Research location is in Indian Ocean between south of Java, Bali and Nusa Tenggara, and the north of
Australia. Fish catch data used is in 7° – 21° S and 107° – 121° E (Figure 4.1).
■•* 1'"∙ l∙>∙ ∣∣<> ∣∣5 ∣3o IJo BI HO
Research Location I______________________________________________________________
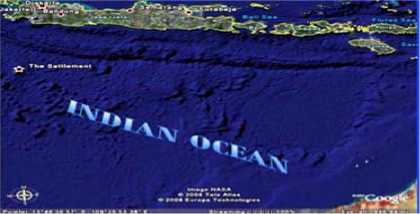
Figure 1 Research Location
Data source in this research is: satellite data that used in this research are MODIS (Moderate Resolution Imaging Spectroradiometer) and SeaWifs satellite data every weeks in period 2007. MODIS and SeaWifs satellite data supported by the website:oseancolor.gsfc.nasa.gov. Fish catch data 2007 from fish catch vessel (PT. Perikanan Samudera Besar) that operated in Indian Ocean.
Instrument in this research are as follow; 1 unit laptop (Pentium M 2 GHz, RAM 1 GB, HD 80 GB, OS : Microsoft), software ENVI 4.4, ER-Mapper 7.0, Arc View 3.2, SPSS, Surfer, and MS. Office 2007.
Data Analysis
Chlorophyll-a, sea surface temperature, photosynthetic available radiation, and primary productivity data supported by MODIS and SeaWifs that processed using digital image processing with ENVI software, ERMapper and Arc View GIS 3.2. Digital image processing divided into three steps there are: (1) preprocessing; (2) processing and (3) post processing.
Primary productivity calculation based on the basic concept that harmonization of photosynthetic and carbon will be happened in euphotic layer. In this research, model that used is Vertically Generalized Production Model
(VGPM) developed by Benhrenfeld & Falkowski (1997). The equation that used is:
Ppeu = 0,66125 * Pbopt * (Eo/(Eo + 4.1))Csur * Deu * Dirr
Where :
Ppeu : bruto of daily primary productivity in eufotic layer (mg C/m2 hari)
Pbopt : index of flux photosynthesis optimum in eufotic layer (mg C/mg Chl * h)
Eo : photo–synthetically available radiation – PAR (unit : W/m2)
Csur : chlorophyll concentration in surface water (W/m3) Deu : depthness of euphotic layer (m)
Dirr : Daily photoperiod (in decimal hours) calculated for the middle of the month for each pixel
RESULT
Primary productivity
Primary productivity in the territorial waters are determined by some factors. In this studies, main factors that are influenced primary productivity and Vertically Generalized Production Model (VGPM) are sea surface temperature (SST), chlorophyll-a (Chl-a), euphotic zone (Zeu), photosynthetic available radiations (PAR) and solar radiation times a days (Dirr).
From weekly primary productivity values during January to December are continuously similar, by high value range. The high value majority located in seashore area (between 400 mgC/m2day and over 1000 mgC/m2day). While in fishing ground area with significant fish catching, primary productivity is from 100 to 500 mgC/m2day.
Lowest primary productivity value in research location with fish production is 73.22 mgC/m2day in March 22nd to 29th 2007 and the highest is 732.98 mgC/m2day in June 2nd to 9th 2007. Lowest chlorophyll-a is 0.06 mg/m3 on January 17th to 24th 2007 and the highest is 0.38 mg/m3 on August 21st to 28th 2007. And lowest sea surface temperature is 24.640C in August 13rd to 20th 2007 and the highest is 31.820C from February 26th to March 5th 2007.
Tuna Fish Catch Production
Four species tuna fish by long line method in Indian Ocean fishing ground are Yellowfin tuna (Thunnus albacores), Bigeye tuna (Thunnus obesus), Southtern Bluefin tuna (Thunnus macoyii), and Albacore (Thunnus alalunga).
From weekly fish catch data, hook rate means is from 0.002% to 0.007%, and the highest is from 0.003%. There is no fish catch in March 6th to 21st and September 14th to 21st 2007. Highest Bluefin tuna and Bigeye tuna fish production is in December 11st to 18th 2007, 17 and 363 heads fish, respectively. Highest Yellowfin tuna fish production is in May 17th to 24th 2007 (98 heads fish), and
Albacore fish production is relatively high in February 10th to 17th 2007 (59 heads fish).
Table 1 Tuna Production in 2007
|
No |
Month |
Fish Name |
Amount |
Hook | |||
|
Yellowfin |
Bigeye |
Bluefin |
Albacore |
Rate | |||
|
1 |
January |
12 |
284 |
9 |
44 |
349 |
0,248 |
|
2 |
Pebruary |
122 |
526 |
24 |
125 |
797 |
0,545 |
|
3 |
March |
68 |
274 |
3 |
26 |
371 |
0,271 |
|
4 |
April |
153 |
532 |
2 |
87 |
774 |
0,550 |
|
5 |
May |
289 |
562 |
1 |
79 |
931 |
0,666 |
|
6 |
June |
63 |
426 |
0 |
55 |
544 |
0,397 |
|
7 |
July |
50 |
310 |
0 |
69 |
429 |
0,336 |
|
8 |
Augus't |
14 |
185 |
0 |
91 |
290 |
0,216 |
|
9 |
September |
11 |
109 |
0 |
17 |
137 |
0,100 |
|
10 |
October |
17 |
341 |
1 |
40 |
399 |
0,292 |
|
11 |
November |
65 |
731 |
17 |
91 |
904 |
0,631 |
|
12 |
December |
106 |
828 |
22 |
94 |
1050 |
0,726 |
|
Amount |
970 |
5108 |
79 |
818 |
6975 | ||
The maximum tuna fish catch production during 2007 is Bigeye tuna (73%), Yellowfin tuna (14%), Albacore tuna (12%), and Southern Bluefin tuna (1%). And monthly fish catch production in 2007 is fluctuated. The maximum fish catch total is in December 1,050 heads fish followed 0,726% hook rate, meanwhile minimum fish catch in September 171 heads fish and 0,1% hook rate.
DISCUSSION
Variability of Primary Productivity
Figure 2 is explain weekly Indian Ocean primary productivity in 20007. Constant minimum value of primary productivity is not shows significant number and tends to increased in 15th weeks (April) and reached its maximum value in 31st weeks (August)
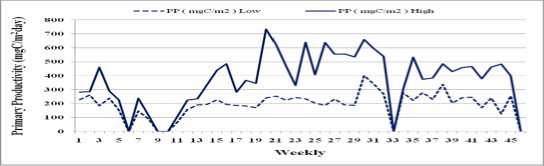
Figure 2 Fluctuation of Primary Productivity in 2007
Meanwhile, high maximum primary productivity value is present significant value weekly. Maximum high primary productivity value is in weeks of 20th (June) or in southeast monsoon, sst and chl-a value are 280 - 290C, and chl-a 0.1 – 0.2 mg/m3 respectively, and presumed there is an upwelling process.
Primary productivity value higher in June to September (southeast monsoon) than in December to March (northwest monsoon). Some factors that caused high primary productivity value in southeast monsoon are air temperature in southeast monsoon is colder than
northwest monsoon, Chlorophyll-a value is high (> 0.1) and produced upwelling process. Hendiarti et al., (1995) conclude that, there is upweilling in southeast monsoon on south of Java-Bali Islands, chlorophyll mean concentration is 0.39 mgC/m3 and during northwest monsoon is 0.18 mgC/m3.
Susanto et al., (2001) explained an upwelling process in coastal west area of Sumatra and south of Java is response of wind during southeast monsoon. Different condition occurs during northwest monsoon. In transitional period (April to May and October to November) water mass stream in equator area influenced downwelling on coastal area of west Sumatra and south of Java (Clarke and Liu, 1993; Sprintall et al., 2000). According to Wyrtki (1961), upwelling in south of Java is temporally and placed in boundary zone of coastal Java current and south of equator current.
There is not available primary productivity on 10th to 17th March, because satellite data is cloudy and can not be processed. While, in 6th – 12nd March, 14th -2st September and 27th -3st December there is no fish catch.
Variability of Fishery Data
Bigeye tuna (Thunnus obesus) is the biggest catch than others tuna fish in research location in Indian Ocean, that are Yellowfin tuna (Thunnus albacores), Southtern Bluefin tuna (Thunnus macoyii), and Albacore (Thunnus alalunga).
Bigeye tuna dominated 73% of fish catch, the highest of fish catch is in 11th to 18th of December 2007. Chlorophyll-a, SST and primary productivity value are from 0.07 to 0.11 mg/m3, from 25.63 to 30.330C, and from 127.26 to 482.20 mgC/m2day, respectively. Uda (1952) in Hela and Laevastu (1970) show species of Bigeye tuna is high tolerance to high temperature (110 C – 280 C), and temperature of fish catch is about 180C - 230 C.
Small fish catching in September, although primary productivity and chlorophyll-a are high. This would be a small number of vessels of PT. Perikanan Samudra Besar (PSB) are fishing. High fish catch will achieved if
fisherman are fished, according to high number of fish catch by operation of other vessels that are fishing.
Meanwhile, Bigeye tuna is epipelagic, mesopelagic and oceanic and live in 250 m depth water. Temperature and termoclyn layer depth is environment main factor influence the distribution of the fish, vertically and horizontally. Water temperature of Bigeye tuna is in 130 C to 290 C and optimum temperature is 170 C to 220 C (Collette and Nauen, 1983).
A number of fish catch of PT. PSB show the tends to have been decrease annually. Since 1973, the fishing fish in Indian Ocean area are decrease (Batubara, 2003). A mean number of fish catch in each of a hundreds of hook rate in 1997 to 1999 are decrease, respectively are 0.84, 0.78, 0.57 (Gaol et. al., 2002). In 2007, weekly hook rate means is 0.003 and 0.415 monthly.
Correlation Between Primary Productivity To Fish Catching, Chlorophyll-a, And Sea Surface Temperature
Condition of primary productivity value in from 50 to 150 mgC/m2day is explained in Figure 3 in one times of fish catch, there are 1 to 23 heads of tuna. There are 1 to 24 heads of tuna are caught in from 150 to 450 mgC/m2day primary productivity value and 1 to 14 head of tuna are caught in from 450 to 732 mgC/m2day primary productivity value. Primary productivity coefficient correlation value is not significant in this condition or none of correlation (r = 0.008), therefore, fish catching is not influenced by marine primary productivity value in range of those three numbers. In that primary productivity value condition, tuna are constantly catch.
According to research of Matsuura et al., (1997), in east of Indian Ocean, conclude a chlorophyll-a concentration in surface layer not high involved, and increased involved to lower layer and maximum concentration involved is from 75 to 100 m depth. While Hendiarti et al., (1995) state that maximum chl-a concentration in south of Java-Bali Islands is under 20 m depth on southeast monsoon and under 80 m depth during northwest monsoon. Frequently, that deepness is upper limit of termoclyn layer.
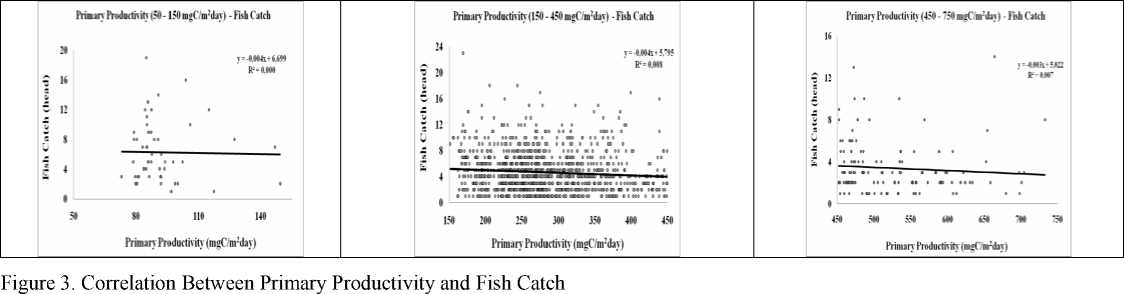
Table 2 Tuna Fishing Ground and Oceanography Parameter of Tuna Fish in 2007
|
Species of Fish |
3 Chlorophyll (mg/m) |
Sea Surface Temperature (0C) |
2 Primary Productivity (mgC/m) |
Coordinat Fishing Ground | ||||||||||||
|
NWM |
TRANS'1 |
SEM |
TRANS'2 |
NWM |
TRANS'1 |
SEM |
TRANS'2 |
NWM |
TRANS'1 |
SEM |
TRANS'2 |
NWM |
TRANS'1 |
SEM |
TRANS'2 | |
|
Bigeye tuna |
0.06 - 0.18 |
0.06 - 0.23 |
0.08 - 0.37 |
0.07 - 0.32 |
25 - 31 |
26 - 31 |
24 - 29 |
25 - 29 |
127 - 482 |
73 - 484 |
168 - 732 |
224 - 591 |
110–150 S |
120–160 S |
120–160S |
100–160 S |
|
(Thunnus obesus) |
1090–1210 E |
1070–1200E |
1070–1210 E |
1050–1170 E | ||||||||||||
|
Yellowfin tuna |
0.06 - 0.13 |
0.06 - 0.21 |
0.08 - 0.38 |
0.08 - 0.32 |
26 - 31 |
26 - 31 |
25 - 29 |
25 - 29 |
146 - 482 |
73 - 478 |
168 - 732 |
205 - 588 |
110– 150S |
110– 150S |
110– 150S |
120– 150 S |
|
(Thunnus albacores) |
1070–1210 E |
1050–1170 E |
1090–1210 E |
1060 –1170 E | ||||||||||||
|
Albacore tuna |
0.06 - 0.13 |
0.06 - 0.21 |
0.08 - 0.38 |
0.08 - 0.34 |
26 - 30 |
27 - 30 |
24 - 29 |
25 - 28 |
151 - 482 |
79 - 452 |
169 - 732 |
231 - 532 |
120–160 S |
120–160 S |
120–160 S |
110–160 S |
|
(Thunnus alalunga) |
1120–1180E |
1070–1190 E |
1070–1210 E |
1050–1170 E | ||||||||||||
|
Southern Bluefin tuna |
0.06 - 0.13 |
0.06 - 0.21 |
- |
0.08 - 0.13 |
26 - 30 |
26 - 30 |
- |
26 - 29 |
146 - 449 |
92 - 288 |
- |
252 - 379 |
120–150S |
120–140 S |
- |
120–160 S |
|
(Thunnus macoyii) |
1080–1160 E |
1090–1160 E |
- |
1110–1190 E | ||||||||||||
Tuna living layer is below the thermoclyn layer, caused the primary productivity is not influenced tuna fish catching. Important fish in this fish production is tuna (Bigeye tuna), where optimum fishing layer catch is in 250 m, this adequate to optimum temperature bigeye tuna which are caught in from 100C to 150C (Hanamoto. 1986)
The correlations between primary productivity and SST in fishing ground area are inversely proportional (r = -0.197), therefore a lower surface temperature could produce lower primary productivity value. Could be assumed an inversely proportional in chl-a and SST correlation. According to the previous research, SST distribution pattern in Indian Ocean is different to thermoklin layer temperature pattern as a fishing layer of tuna (Gaol, 2003).
Meanwhile, correlation primary productivity and chl-a concentration by Pearson coefficient correlation, high correlation and proportional are obtained (r = 0.67). This high coefficient, explained that high concentration of chl will also produce high primary productivity. Behrenfeld and Falkowski (1997) explained some factors involve in primary productivity, and chlorophyll surface concentration is main factor in the process of primary productivity. Zagaglia et al., (2004) in Hiroyuki and Winarso (2006), explained that, primary productivity always have proportional trend to chl-a concentration.
In figure 3, explained tuna fish are catch in large number in from 150 to 450 mgC/m2day, from 250 to 300C, and from 0.05 to 0.30 mg/m3, on primary productivity value, sea surface temperature and chlorophyll value, respectively, in various fish catching number (1 to 24 heads of tuna).
Condition of Potential Tuna Fisheries in Indian Ocean
Bigeye tuna, Albacore, Yellowfin tuna and Southern Bluefin tuna are catching in Indian Ocean in 110 – 160 S and 1060 – 1210 E the primary productivity value is from 73 mgC/m2 to 732 mgC/m2 and different in sea surface temperature value, that area from 240 C to 310 C, from 240
C to 300 C, and from 250 C to 310 C for Bigeye tuna, Albacore and Yellowfin tuna, respectively. While Southern Bluefin tuna distributed in area with temperature from 260 C to 300 C and primary productivity value is from 92 mgC/m2 to 449 mgC/m2.
Tuna fish and skipjack distributed in tropical and subtropical area. Distribution of tuna and skipjack is not influenced by longitude and latitude differences (Nakamura, 1969).
CONCLUSION AND SUGGESTION
In Indian Ocean fishing ground area of PT. Perikanan Samudra Besar (PT. PSB), there are four species of tuna, Yellowfin tuna (Thunnus albacores), Bigeye tuna (Thunnus obesus), Southtern Bluefin tuna (Thunnus macoyii), and Albacore (Thunnus alalunga). Bigeye tuna is siginificant fish production in the area catch (73%).
The coefficient correlation in primary productivity and fish catching in fishing ground area are small (r = 0.008), explained that, fish catching number is not influenced by primary productivity. In high or low primary productivity condition tuna fish is catching in Indian Ocean area.
Potential Fishing ground area of Bigeye tuna, Albacore, Yellowfin and Southern Bluefin tuna in Indian Ocean are in 110 – 160 S and 1060 – 1210 E, the primary productivity value is from 73 mgC/m2day to 732 mgC/m2day and differences of sea surface temperature value of tuna fish are from 240 C to 310 C, 240 C to 300 C, and 250 C to 310 C for Bigeye tuna, Albacore and Yellowfin tuna, respectively. While Southern Bluefin tuna distribution is in temperature area from 260 C to 300 C and primary productivity value is from 92 mgC/m2day to 449 mgC/m2day.
According to tuna fisheries potency in Indian Ocean, fishermen, particularly PT. PSB or others tuna fishery coorporation should find another tuna fishing ground area, because a fishery potency in Indian Ocean is tends to
decrease, summarized from a number of hook rate of tuna fish that are tends to decrease. . And intensive fish catching during November – December and in April - July should be done, where fish production is high relatively.
REFERENCES
Batubara, 2003. "Kajian potensi ikan tuna berdasarkan realisasi hasil tangkapan kapal long line PT Perikanan Samudera Besar". Makalah (tidak dipublikasikan).
Behfereld, M.J and P.G. Fawkolsky. 1997. A Consumer’s Guide to Phytoplankton Primary Productivity Models. American Society of Limnology and Oceanography, Inc. Limnology and Oceanography Journal Vol. 42 (7): 1479-1471
Clarke, A. J. and X. Liu, 1983. Observations and Dynamics of Semiannual and Annual Sea Levels near the eastern Equatorial Indian Ocean Boundary. J. Geophys. Res., 23, 386 - 399
Collette, B. B., dan C. E. Nauen. 1983. Scmrids of The World. FAO Fish Syn. 2(125), 137 p
Gaol, J.L. 2003. Kajian Karakter Oseanografi Samudra Hindia Bagian Timur dari Satelit Multi Sensor dan Hubungannya dengan Hasil Tangkapan Tuna Mata Besar (Thunnus obesus). Disertasi. Institut Pertanian Bogor.
Hanamoto, E. 1986. Effect of Oceanographyc Environment on Bigeye tuna Distribution. Doctor Thesis. Tokyo University.
Hela, I., dan T. Laevastu. 1970. Fisheries Oceanography. Fishing News (Books) LTD. London
Hendiarti, N., S. I. Sachoemar, A. Alkatiri, dan B. Winarno, 1995. Pendugaan Lokasi Upwelling di Perairan Selatan P. Jawa – Bali Berdasarkan Tinjauan Parameter Fisika Oceanografi dan Konsentrasi Klorofil-a. Prosiding
Seminar Kelautan Nasional 1995. Panitia Pengembangan Riset dan Teknologi Kelautan serta Industri Maritim, Jakarta.
Hiroyuki, K., and G. Winarso. 2006. Seasonal distribution of chlorophyll-a concentration deduced from modis ocean color data in the eddy area hyuga-nada east kyusu seawater. Prociding of International Symposium on Remote Sensing 2006 Pan Ocean Remote Sensing Conference Vol. I. DUSOL Publication Co., Chair. Korea. P 475-478
Matsuura, M., T. Sugimoto, M. Nakai, and S. Tsuji, 1997. Oceanographic Conditions near the Spawning Ground of Southern Bluefin Tuna: Northeastern Indian Ocean. J. Oceanogr., 53: 421 – 433.
Nakamura, H. 1969. Tuna distribution and migration. Fishing News (Books), Ltd. London. 76p
Nontji, A., 1993. Laut Nusantara. Penerbit Jembatan, Jakarta.
Sprintal, J., Gordon, A. L., Murtugudde R., and Susanto R. D. 2000. A Semi-anulla Indian Forced Kelvin Waves Observed in the Indonesian Seas, May 1997. Journal of Geophysical Research 105: 17.217 - 17.230
Susanto, R.D., Gordon, A.L., Zheng. Q., 2001. Upwelling along the coasts of Java and Sumatera and its Relation to ENSO. Geophysical Research Letters 28, 1599-1602.
Uktolseja, J.C.B. 1987. Estimated Growth Parameters and Migration of Skipjack Tuna - Katsuwonus pelamis In The Eastern Indonesian Water Through Tagging Experiments. Jurnal Penelitian Perikanan Laut No. 43 Tahun 1987. Balai Penelitian Perikanan Laut, Jakarta. Hal. 15-44.
Wyrtki, K., 1961. Physical Oceanography of the Southeast Asean Waters, NAGA Rep. 2. Scripps Inst. of Oceanography La jolla, Calif.
91
Discussion and feedback