STUDI PENANGKAPAN IKAN KEMBUNG (Rastrelliger kanagurta) DENGAN MENGGUNAKAN DATA SATELIT DI LAUT JAWA PADA MUSIM TENGGARA DAN BARAT LAUT
on
Ecotrophic ♦ 5 (1): 21 - 26 issn: 1907-5626
STUDI PENANGKAPAN IKAN KEMBUNG (Rastrelliger kanagurta) DENGAN MENGGUNAKAN DATA SATELIT DI LAUT JAWA
PADA MUSIM TENGGARA DAN BARAT LAUT
Bardiyanto¹, dan I Wayan Kasa2
-
1) Sekolah Menengah Kejuruan Negeri 1 Mundu Cirebon
-
2) Master Program of Environmental Science Posgraduate Program, Udayana University
ABSTRAK
Ikan kembung (Rastrelliger kanagurta) merupakan salah satu ikan pelagik yang penting di Laut Jawa, karena banyak ditangkap dan dikonsumsi oleh masyarakat. Muson merupakan faktor utama yang mempengaruhi karakteristik Laut Jawa.
Lokasi penelitian adalah di Laut Jawa. Data khlorofil-a dan suhu permukaan laut (SPL) diperoleh dari satelit AquaMODIS. Data angin diperoleh dari satelit QuikScat dan data tinggi paras muka laut (TPML) dari satelit Jason 1. Data perikanan dari tempat pelelangan ikan Dadap (Jawa Barat) dan Pekalongan (Jawa Tengah). Musim penangkapan ikan dianalisis menggunakan metode rasio rerata bergerak. Sedangkan usaha penangkapan optimum dan penangkapan yang lestari menggunakan model produksi surplus. Jumlah tangkapan yang diperbolehkan adalah 80% dari tangkapan lestari.
Pada musim barat laut, arah angin adalah ke tenggara, sedangkan pada musim tenggara, arah angin ke barat laut. Khlorofil-a and kecepatan angin relatif lebih tinggi pada musim tenggara. Sedangkan SPL dan TPML relatif lebih rendah pada musim tenggara. Korelasi antara khlorofil-a dan SPL adalah -0,578. Sedangkan korelasi antara kecepatan angin dan SPL sebesar -0,728. Korelasi antara SPL dan TPML adalah 0,78. Pada musim barat laut, daerah kurang potential lebih besar daripada daerah potential. Sedangkan daerah potential berada di Laut Jawa bagian barat. Sedangkan pada musim tenggara, daerah sangat potential dan potential menyebar merata di Laut Jawa, khususnya di sekitar Pulau Bawean, Masalembo dan Kangean. Tingkat akurasi antara prediksi daerah penangkapan ikan dengan lokasi penangkapan ikan dari nelayan sebesar 80,2%.
Indek musim tangkapan ikan mulai meningkat dari bulan April dan mencapai puncak pada bulan Juli dan Agustus. Hal ini disebabkan pada bulan tersebut, kandungan khlorofil-a tinggi dan SPL rendah, sehingga produktifitas primer perairan meningkat. Upaya penangkapan optimum sebesar 345 kapal tiap bulan, sedangkan jumlah tangkapan yang diperbolehkan sebesar 437,808 kg tiap bulan. Penangkapan ikan Indian Mackerel telah berlebihan atau over fishing.
Korelasi antara ENSO dan hasil tangkapan ikan kembung adalah 0,127. Ini berarti tidak ada hubungan antara ENSO dengan hasil tangkapan ikan kembung. Nilai F hitung sebesar 6,513 dengan tingkat signifikan sebesar 0.005. Ini berarti SPL dan khlorofil-a secara bersama-sama mempengaruhi hasil tangkapan ikan kembung. Sedangkan korelasi antara tangkapan ikan dengan SPL dan khlorofil-a sebesar 0,57.
Kata kunci: Ikan kembung, Suhu Permukaan Laut, Khlorofil-a, Muson, Tinggi Paras Muka Laut
ABSTRACT
Indian Mackerel (Rastrelliger kanagurta) represent one of important fish pelagic in Java Sea. This fish is mainly caught and consumed by local community. Monsoon is the main factor governing the characteristics of the Java Sea.
This research location is in Java Sea. Chlorophyll-a and SST data will be obtained from Aqua-Modis Satellite. Wind data is `from QuikScat Satellite. Sea surface height data is from Jason 1 Satellite. Fishery data will be taken from the Fishing Port of Dadap (West Java) and Pekalongan (Central Java). Pattern of fish catching season will be analyzed using time series technique with ratio to moving average method. Effort optimum and MSY will be taken with Surplus production models by Schaefer (1957). The Total Allowed Catch is 80% x MSY.
Wind direction during northwest monsoon flows southeastward and during southeast monsoon flows northwestward. Generally, wind speed and chlorophyll-a in Java Sea during southeast monsoon is relatively higher compare with it during northwest monsoon. Generally, SST and SSH in Java Sea during southeast monsoon is relatively lower compare with it during northwest monsoon. Correlation between chlorophyll-a and SST is inversely correlated with correlation coefficient - 0.578. Correlation value between wind speed and SST is -0.728. SST and SSH correlation is 0.78.
During northwest monsoon, low potential area was bigger than potential area. This is cause by chlorophyll-a and low wind speed, SSH and high SST. Therefore, fish production becomes few. Potential area was located in western part of
Java Sea. Meanwhile in southeast monsoon, mainly high potential area were in Bawean Island, Masalembo Island and Kangean Island. And potential area was over the Java Sea. This is cause by chlorophyll-a and high wind speed, SSH and low SST. This is indicating upwelling. So, fish production during southeast monsoon was bigger than during northwest monsoon. This match-up value between fishing ground GIS and fishing ground by fisherman is 80.2%.
Catching season index shown that the increase of Indian Mackerel abundance is occurring in April and the maximum number is in July and Augustus. This is caused by the highest chlorophyll-a concentration (0.42 mg/m³) and a low SST (27-28ºC), so create a high primary productivity. This environment condition will support fish spawning. Optimum effort value is 345 vessel/month. And TAC value is 437.808 kg/month. The number of fishing vessel since 2002 increased to 2007, over optimum effort. Meanwhile, the fish production is over TAC until the end of 2004. Then it decreased under TAC to 2007. This indicates that fish catching of Indian Mackerel in Java Sea is classified over fishing.
Correlation value between Indian Mackerel fish catch to ENSO in Java Sea is 0.127. This is indication of ENSO phenomena did not influence fish catching.
F calculates is 6.513 with significant level 0.005. This means, chlorophyll-a and SST are together influence fish catching of Indian Mackerel in Java Sea. And correlation between fish catching with SST and chlorophyll-a is 0.57.
Keyword: Indian Mackerel, Sea Surface Temperature, Chlorophyll-a, Sea Surface Height, Monsoon
INTRODUCTION
Background
The natural fish stock of the entire Indonesian seas is 5.14 million ton/year in Indonesian waters and 1.26 million ton/year in the Indonesian Exclusive Economic Zone (EEZ). Pelagic fish play an important role in the economics of fisherman in Indonesia; approximately 75 percent of the total fish stock, or 4.8 million ton/year, is pelagic fish (Hendiarti et al., 2005).
In the year 1997, the evaluation of maximum sustainable yield (MSY) of fish pelagic are 2,862 million ton/year of pursuant to production, potency and mount the exploiting at region of fishery management. While maximum sustainable yield (MSY) in Java Sea equal to 0,34 million ton/year (Fauzi, 2005).
Indian Mackerel (Rastrelliger kanagurta) represent one of important fish pelagic in Java Sea. This fish a lot of caught and consumed by society. Monsoon is the main factor governing the characteristics of the Java Sea. During the southeast monsoon, these currents shift of water mass from the eastern part and from western during northwest monsoon with lower intensity.
Application of remote sensing use satellite have rapidly growth, one of them is in the field of fishery. Parameter in remote sensing for the fishery, for example SST and sea color. Data of SST can predict the existence of front and upwelling, while sea color can predict the chlorophyll-a and primary productivity, so that can determine the area of fish catch (Susilo, 2000).
The problem in this research were: 1) How are the chlorophyll-a, SST, SSH, wind speed and wind direction using satellite data during northwest and southeast monsoon in Java Sea? 2) How are the total allowed catch (TAC), trends and season of fish catching of Indian Mackerel (Rastrelliger kanagurta) in Java Sea ? and 3)
How is the correlation between fish catching of Indian Mackerel (Rastrelliger kanagurta) with the satellite data of chlorophyll-a and SST during northwest and southeast monsoon in Java Sea ? The research objective were: 1) To know chlorophyll-a, SST, SSH, wind speed and wind direction using satellite data during northwest and southeast monsoon in Java Sea; 2) To know the TAC, trend and season of fish catching of Indian Mackerel (Rastrelliger kanagurta) in Java Sea; and 3) To know correlation of between fish catching of Indian Mackerel (Rastrelliger kanagurta) with the satellite data of chlorophyll-a and SST during northwest and southeast monsoon in Java Sea.
RESEARCH METHOD
This research location was in Java Sea, specifically at 108°- 116°East Longitude, 4°.30”- 6°South Latitude. The time series data of monthly averaged were SST and chlorophyll-a derived from the Aqua-Modis. This data were obtained from Ocean Color, National Aeronautics and Space Administration. Data of wind speed and wind direction derived from the QuikScat Satellite and this data were obtained from Remote Sensing System. Data of SSH derived from the Jason 1 Satellite and this data was obtained from LAS, NOAA. That was from 2002 until 2007 during northwest monsoon and southeast monsoon. Data of fish catching was obtained from fisherman using appliance catch the purse seine at the Fishing Port of Dadap and the Fishing Port of Pekalongan. Data of fish catching was obtained during five years that was from July 2002 until June 2007. Pattern of fish catching season will be analyzed by using series time technique with ratio to moving average method. Effort optimum and MSY will be got with Surplus production models by Schaefer. The TAC was 80% from MSY.
The chlorophyll-a, SST, SSH, wind speed and wind direction during northwest monsoon and southeast monsoon will be analyzed with correlation of Pearson using Microsoft Office Excel 2003. Fish catching data, chlorophyll-a and SST from year 2002 until 2007 during northwest monsoon and southeast monsoon will be analyzed with the multiple regression using SPSS 15 software.
Jan Feb Jul Aug Sep Dec
Month
Determination of zone potency of fishing ground by combining the SST and chlorophyll data by using GIS method. Chlorophyll-a and SST divided to become 3 classification to determine area of low potential, potential and high potential fishing ground as show table 1
RESULT AND DISCUSSION
Wind direction during northwest monsoon generally flow southeastward with average 93° until 108°. While wind direction during southeast monsoon flow northwestward with average 297° until 301°. Generally, wind speed in Java Sea during southeast monsoon is relatively faster when compared with that during northwest monsoon. Wind speed during 2002 - 2007 started to increase after December and reaching the maximum value in August. Maximum wind speed in August 2006 was 8.2 m/s. Minimum wind speed in December 2002 was 4.9 m/s. Average of wind speed in Java Sea were 6.2 m/s to 7.4 m/s.
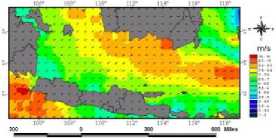
Figure 1.
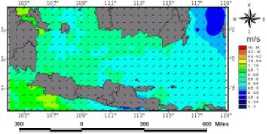
Direction and wind speed in August 2006 during Southeast Monsoon (left) and during Northwest
Monsoon (right) in Java Sea
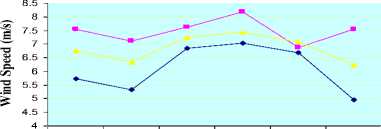
Minimum Maximum Average
Jan Feb Jul
Aug Sep Dec
Month
Figure 2. Seasonal Wind Speed in Java Sea
Generally, chlorophyll-a in Java Sea during southeast monsoon is relatively higher when compared with that during northwest monsoon. Maximum chlorophyll-a in August was 0.47 mg/m³. Minimum chlorophyll-a in December was 0.22 mg/m³. Average of chlorophyll-a in Java Sea were 0.33 mg/m³ to 0.42 mg/m³.
Figure 3. Seasonal Chlorophyll-a in Java Sea
Generally, SST in Java Sea during southeast monsoon is relatively lower than the northwest monsoon. Sea surface temperature increased after August and reaching the maximal value in December. Maximum SST in December was 31°C Minimum SST in August was 27.668°C. Averages of SST in Java Sea were 27.9°C to 30.3°C. Sea surface temperature will become cool in eastern of Java Sea, Flores Sea and Banda Sea during southeast monsoon. This is indicating that upwelling and the territorial water is rich of phytoplankton. This phytoplankton will drift to Java Sea by current.
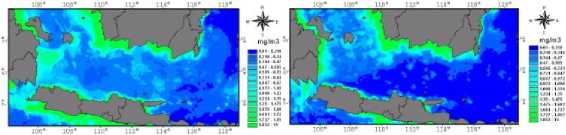
Figure 4 .hlorophyll-a Distribution in August 2006 during
Southeast Monsoon (left) and in December 2006 during Northwest Monsoon (right) in Java Sea
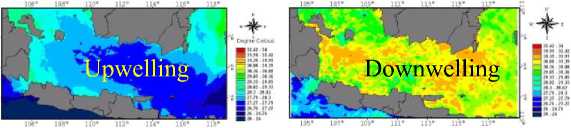
Figure 5. SST Distribution in August 2006 during Southeast Monsoon (left) and in December 2006 during Northwest Monsoon (right) in Java Sea
Gordon (2005) explained the seasonal of the sea surface temperature is accentuated by Ekman transport caused by upwelling in the southeast monsoon during July to September along Flores Sea, eastern part of Java Sea and in the Banda Sea. The Ekman transport effects are evident in the surface chlorophyll-a field, with upwelling, cooler surface temperatures matching regions of higher primary productivity. During northwest monsoon, the Ekman transport causes the happening of downwelling.
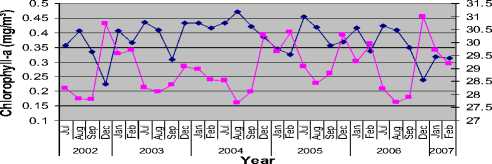
The figure 6 shows SST and chlorophyll-a concentrations have an inverse pattern, when the sea surface temperature was minimum, chlorophyll-a concentration was reaching the maximum value, it is clearly shown in August. Correlation between chlorophyll-
a and SST in Java Sea was inversely correlated with correlation coefficient - 0.57. It is similar to Palenzuela et al., (1998) conclusion that the sea surface temperature and chlorophyll-a concentration were inversely correlated. It might be well understood, because when the upwelling phenomenon is occur, the bottom layer of the water which is cooler but rich of nutrient will comes up. This rich nutrient water will attract the phytoplankton to gather and it can appear in August with high chlorophyll-a concentration comparing with the other months.
Chlo-a SST
Chlorophyll-a and SST are applied to predicted fishing ground area. Chlorophyll-a and SST divided to become 3 classification to determine area of low potential, potential and high potential fishing ground.
During northwest monsoon, low potential area was bigger than potential area. This is cause by chlorophyll-a and low wind speed, SSH and high SST. Therefore, fish production becomes few. Potential area was located in western part of Java Sea.
Meanwhile in southeast monsoon, mainly high potential area were in Bawean Island, Masalembo Island and Kangean Island. This area was fish catching area for fisherman in many times. Meanwhile, potential area was over the Java Sea. This is cause by chlorophyll-a and high wind speed, SSH and low SST. This is indicating upwelling. So, fish production during southeast monsoon was bigger than during northwest monsoon.
Figure 6. Correlation between Chlorophyll-a and SST in Java Sea
Generally, SSH in Java Sea during southeast monsoon is relatively lower than during northwest monsoon. The pattern of seasonal SSH is similar with the pattern of seasonal SST. Sea surface height increase after August and reaching the maximal value in February. Minimum SSH in August 2003 was -11.8 cm. Maximum SSH in February 2006 was 8.4. Average of SSH in Java Sea were -2.6 cm to 5.3 cm. Positive SSH value is indication of higher than SSH average annually. And negative SSH value is lower indication than SSH average annually. Sea surface height and SST have correlation. When the SST is low, creates a heavy water mass, so SSH become low. Contrary, when SST is height, water mass become lighter, so SSH is more height. In northwest monsoon, SST is high and SSH is increase and contrary in southwest monsoon. SST and SSH correlation in Java Sea is 0.78. This index indicates the different characteristic of SST and SSH in Java Sea corresponds to Monsoon event.
Sea surface height is a depth-integrated quantity dependent upon the temperature and salinity structure of the water column. Hence any relationship between SST and SSH provides dynamical information about the coupling between the ocean surface and subsurface. Small-scale correlations between SST and SSH are high (R=0.7) in areas associated with fronts and mesoscale variability. These small-scale correlations are seasonal (Jones et al., 1998).
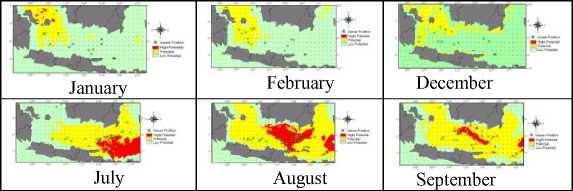
Figure 7 Comparison of Fishing Ground GIS and Fishing
Ground by Fisherman
This match-up value between fishing ground GIS and fishing ground by fisherman is 80.2%. This mean clearly explains correlation between the prediction of Indian Mackerel fishing ground map by GIS model and fish production. And also the fish production will increase in supported environment system condition.
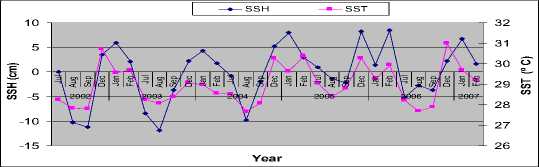
Figure 8. Correlation between SSH and SST in Java Sea
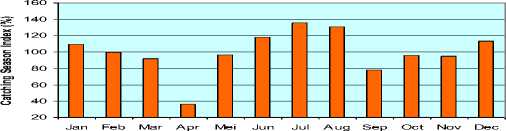
Abundance of fish occurs in July and August with fish catching index are 135.7% and 130.8%. This is caused by the highest chlorophyll-a concentration (0.42 mg/m³) and a low SST (27-28ºC), so create a high primary productivity. This environment condition will support fish spawning.
Table 1Classify of Fishing Ground Area
|
Variable |
Value of SST (º C) | |||
|
> 29 |
28 - 29 |
< 28 | ||
|
Value of Chlorophyll-a (mg/m³) |
0.10 - 0.20 |
Low Potential |
Low Potential |
Low Potential |
|
0.21 - 0.40 |
Low Potential |
Potential |
Potential | |
|
> 0.40 |
Low Potential |
Potential |
High Potential | |
Source: Gower (1972) and http://www.fishbase.org/Summary/
In Java Sea, spawning period of Indian Mackerel became the April until August, and December month. Spawning peak is August month (Nurhakim, 1993). Spawning Indian mackerel in coastal bays harbours and deep lagoons, usually in some turbid plankton-rich waters and form fish schools. Spawning time for Indian Mackerel is March to September in India. Indian Mackerel lived in 27-280C condition in Java Sea (Anonym, 2008a).
M onth
Figure 9. The Fish Catching Season of Indian Mackerel in Java Sea
Fish catching trend of Indian Mackerel is explain in CPUE during 2002-2007. Indian Mackerel fish catching trend explained that fish catching in the middle of 2002 is decrease until the middle of 2003 then it is increase. And the maximum of Indian Mackerel fish catching trend is in the middle of 2004. Then a lower sharp occur in the middle of 2007. This condition is correlated to the number of fishing vessel that fishing the fish.
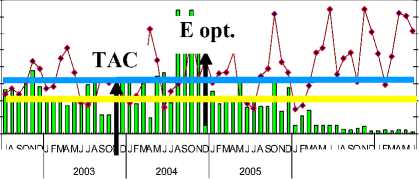
Using surplus production models by Schaefer (1957) in Anonym (2008b), an optimum effort value is 345 vessel/month. And total allowed catch (TAC) value is 437.808 kg/month. Figure 10 explains the number of fishing vessel since 2002 is increase to 2007, over optimum effort. Meanwhile, the fish production is over TAC until the end of 2004. Then it decrease under TAC to 2007. This indicates that fish catching of Indian Mackerel in Java Sea is over fishing. Anonym (2005) the Java Sea include in over exploited or over fishing.

fish production number of vessel
1,600,000
1,400,000
1,200,000
1,000,000
800,000
600,000
400,000
200,000 0
800
700
600
500
400
300
200
100 0
JASONDJ
FMAMJ JASONDJ FMAMJ
2002
2006
2007
Year
Figure 10. Correlations between Fish Production and Number of Vessel in Java Sea
Pauly et al., (1995) strongly recommended that there are two main actions to sustain the fish resources in the ocean such as:
1. Zoning the oceans into unfished marine reserves for several time to give a chance for fish resources to spawning and growing, and
2. Limiting some area levels of fishing effort would allow sustainable fisheries.
An ENSO phenomenon is indicated by MEI value is over to 1. This occurs in the end of 2002 and the end of 2005. And La Nina phenomenon is indicted by MEI value is under to -1. Figure 11 shows fish catching pattern is not correlated to ENSO pattern. Correlation value between Indian Mackerel fish catch to ENSO in Java Sea is 0.12757. This is indication ENSO phenomena are not influenced fish catching.
adhotomo and Durand (1996) said impact of the ENSO event in the years 1982-1983, 1987-1988 and 1991 which involved dislocation of rain fall distribution were
not indicated directly by clear changes in Java Sea fish
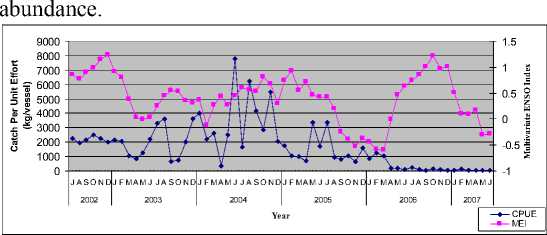
Figure 11. Correlation between Fish Catching and ENSO in Java Sea
The multiple regression was used to know influence chlorophyll-a and SST to fish catching of Indian Mackerel. F calculates is 6.513 with significant level 0.005. This means, chlorophyll-a and SST are together influence to fish catching of Indian Mackerel in Java Sea. And correlation between fish catching with SST and chlorophyll-a is 0.57. According Santoso (2007), correlation value more than 0.5 showed strong enough correlation.
In southeast monsoon, Ekman transport is produce upwelling process. This is indicated by movement deep water mass with cold temperature and nutrient contain to the sea surface. This high nutrient will influence extra phytoplankton and this phytoplankton will be spread by fast wind.
A phytoplankton is main food for Indian mackerel fish, and produces a rapid growth for fish. Cool temperature is also preferred by Indian mackerel fish. This is shown in southeast monsoon. High chlorophyll-a concentration and cooler SST produce a high fish catching of Indian mackerel. It is contrary in northwest monsoon.
After grouping the classification of fishing ground condition and parameter classification of fishing ground such as SST and chl-a in 2002-2007 (table 2), then overlaid each parameter to obtain distribution of prediction Indian Mackerel fishing ground map using GIS model, shown in figure 11.
CONCLUSION AND SUGGESTION
The research conclusions are: 1) Chlorophyll-a and wind speed in Java Sea during southeast monsoon is
relatively higher than that during northwest monsoon. And SST and SSH in Java Sea during southeast monsoon is relatively lower than that during northwest monsoon. 2)The fish catching of Indian Mackerel in Java Sea during southeast monsoon is higher than that during northwest monsoon. 3) The fish catching season of Indian Mackerel in Java Sea occur in July with index 135.7%. Meanwhile lowest fish catching index in April with 35.8%. 4) Total allowed catch of Indian Mackerel is 437,808 kg/month and effort optimum is 345 vessel/month. The fish catching effort is over fishing in Java Sea. 5) ENSO did not influence fish catching of Indian Mackerel in Java Sea. 6) The chlorophyll-a and SST are together influences to fish catching of Indian Mackerel in Java Sea with significant level 0.005. And correlation between fish catching with SST and chlorophyll-a is 0.57. 7) The match_up ratio between fishing ground data by fisherman and GIS is 80.2%.
Based on the result of this research, the author’s suggestion are: 1) For researcher , it is needed to carry out further research in Java Sea using acoustic survey to get a better accuracy due to fishing ground area. 2) Stake holder or government need immediately take policy to handle over fishing in Java Sea. Example: determining conservation area of some location in Java Sea, and may not fish catching effort in that area for several time to give a chance for fish resources to spawning and growing. 3) For fishermen, the fish catching effort better was located in western part of Java Sea during northwest monsoon.
REFERENCES
Anonym. 2005. Revitalisasi Perikanan. Departemen
Kelautan dan Perikanan. Jakarta
Anonym. 2008a. Rastrelliger kanagurta (Indian
Mackerel). Available from:
URL: http://www.fishbase.org/Summary/species Summary.php?ID=111&genusname=Rastrelliger &speciesname=kanagurta. Verified January 8, 2008.
Anonym. 2008b. Estimation Of Maximum Sustainable Yield Using Surplus Production Models. Available from: URL:
http://www.fao.org/docrep/W5449E/w5449e0b.h tm. Verified July 16, 2008
Fuzi, A. 2005. Kebijakan Perikanan dan Kelautan. Gramedia: Jakarta
Gordon, A.L. 2005. Oceanography of the Indonesian Seas and Their Through flow. Oceanography Society. Volume 18, Number 4. Rockville, USA
Gower, J.F.R. 1972. Opportunities and Problems in Satellite Measurements of The Sea. UNESCO Tech.
Hendiarti, N, Suwarso. E, Khairul. A, Retno. A, Suhendra, and Ikhsan. 2005. Seasonal Variation of Pelagic Fish Catch Around Java. Oceanography Society., Volume 18, Number 4. Rockville, USA.
Jones, M.S. Allen, M. Guymert,T. And Saunders, M. 1998. Correlations between altimetric sea surface height and radiometric sea surface temperature in the South Atlantic. Journal of geophysical research. Volume 103. Washington. Available from: URL:
http://cat.inist.fr/?aModele=afficheN&cpsidt=221 4340. Verified July 15, 2008.
Nurhakim, S. 1993. Beberapa Aspek Reproduksi Ikan Banyar (Rastreliger kanagurta) di Perairan Laut Jawa. Jurnal Penelitian Perikanan Laut (81):8-20.
Palenzuela, J.M.T, Mar Sacau Cuadrado, Jaime Peón Fernández, Mónica Miguel Lago, 1998. Sea Surface Temperature and Chlorophyll-a
Correlation Study. Dep. Física Aplicada
.Facultad de Ciencias. Universidad de Vigo.
Pauly, D. and V. Christensen. 1995. Primary Production Required to Sustainable Global Fisheries. Nature Vol. 374. p 255 – 257
Sadhotomo, B. and J.R. Durand. 1996. General Features of Java Sea Ecology. Proceeding of Acoustic.. Central Institute for Fisheries. Ministry of Agriculture. Bandungan, May 27-29, 1996.
Santoso, S. 2007. Menguasai Statistik di Era Informasi dengan SPSS 15. Gramedia: Jakarta
Susilo, S. 2000. Penginderajaan Jauh Kelautan Terapan. Fakultas Perikanan. IPB. Bogor
26
Discussion and feedback